


 nueva página del texto (beta)
 Inglés (pdf)
 Artículo en XML
 Referencias del artículo
 Enviar artículo por email
 Citado por SciELO
  Similares en
SciELO
Similares en
SciELO 
 Permalink
1 Introduction
The rise of the Internet has allowed vast collections of data to be available online, democratizing both the generation of online content and the access to information by users. For example, in February 2016, the catalog of books at Amazon.com1 had about 31 million books of which 135.998 were added during the previous 30 days. The exploration of this type of collections requires intelligent tools to guide users towards products of their interest while minimizing frustration due to the purchase of products that are not of interest to the users and spending valuable time exploring a collection without finding something interesting. Recommender systems are the primary of these tools.
Collaborative filtering algorithms have made great strides by introducing user and product profiling algorithms based on product evaluations provided by users. The patterns found in users evaluations can spread the good experiences of some users in the system, to others. In fact, these systems have demonstrated good ability to forecast the evaluations that users would give to products not yet known to them.
However, user profiles generated by these systems are usually vectors indexed by an abstract space, also named a latent space, devoid of interpretability. Therefore, users cannot modify their profiles to adjust the recommendations received, so users may feel enclosed in “the bubble” described by Pariser [15]. Moreover, some studies have shown that users feel more positive about the recommendations received when they have the opportunity to control them [8, 31].
At the moment, the typical way to escape “the bubble” is to evaluate repeatedly different products that have been searched manually. In this way, the system reacts to the change in the user preferences and refreshes the given recommendations. Unfortunately, this cycle it is not always successful due to limitations of users and systems. For example, the success of manual searches depends heavily on the knowledge that each user has about the product domain. In most cases, users face a blank search box in which they must formulate a query without knowing the vocabulary that characterizes products. For example, in the domain of movie films, for effective searching, it might be necessary to have in mind some names of directors, or actors.
This problem is known as the vocabulary problem [4]. Collaborative Tagging Systems [3, 6, 24], here referred as CTS, have made significant progress in the collective characterization of products using a free language. CTS allow users to tag, using their own words, the features they consider most relevant to the products of the collection. In addition, CTS also enable users to express their agreement with the tags that other users apply to the products. With these two resources (“tags” and “likes”) and using vocabulary selection strategies such as those described in [23, 25] it is possible to build depurated vocabularies, also called folksonomies [18], that characterize products in a language that is natural and easy for most users in the system.
In this paper, we propose a family of recommendation models, called LinearTag models, which formulates its recommendations by inferring the affinity of users for tags by using product evaluations. Also, we experiment with these inferred profiles, or TagProfiles, using them as a tool of interaction that enables users to receive new tailored recommendations as they modify their profiles.
To test the performance of the proposed LinearTag methods, we experimented with them in three different ways. First, we compared our methods against those based on latent factors. Second, we compared our inferred user profiles (TagProfiles) against profiles generated using keywords (KeywordProfiles) extracted from product descriptions instead of tags. Third, we designed a user experience to let 25 users interact with their TagProfiles as a way to obtain new recommendations in a movie recommender system.
2 Preliminaries
2.1 Notation
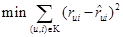
To expose our models, we will use the notation used by Koren in many of his works [9, 10]. According to this notation the index variables i and j are reserved to refer to a particular user, and a product, respectively. The rating, that a user u gives of a product i, is denoted as rui. Those ratings vary between 1 and 5, where 1 means total disgust, and 5 total satisfaction. The set of tuples (user,product) for which the evaluations rui are known, are stored in the set K. Thus, K = {(u, i) |rui is known}. The aim of the recommendation methods is to estimate ratings,  , that minimize the prediction error in the training set:
 .
.
To prevent overfitting, it is necessary to regularize the models with constants that penalize the norm of the estimated variables. These regularization constants are denoted as: λ1, λ2, . . . and their optimal values are determined by cross validation.
Also, we assume that there is a tag vocabulary set Γ in which tags, referred as g, are stored. In the set Ψ, we store tuples (i, g) that indicate whether the tag g was applied to the movie i. Therefore, Ψ = {(i, g) |g is applied to i}.
2.2 Product Characterization Methodologies
In the Information Retrieval field, it is common to use a Vector Space Model (VSM) representation for the documents [22, 29]. In VSM, documents are represented as vectors indexed by terms. Similarly we need to represent products as vectors qi, but instead of terms we use tags, so qi ∈ ℝ|Γ|, where individual qig coefficients, indicate the relevance of the tag g to the movie i:
 .
.
In this work, we will use three methodologies to assign these coefficients: the hard-qi methodology; a softened version denoted as soft-qi and the supervised product characterization proposed by Vig et al. in the TagGenome work [31].
The hard-qi methodology assigns 1 to the coefficient qig if the tag g was applied to the product i and 0 otherwise. Thus:

The soft-qi methodology assigns 0.7 and 0.1 depending on whether or not the tag g was applied to i:

The TagGenome methodology, use a multilevel logistic regression model that estimates the probability that a tag g is relevant to the product i (a movie). As a ground truth, they use a survey, in which users assess the relevance of the tags to the movies. The TagGenome model estimates the value of the qig coefficients as follows:

where coefficients βg are the multilevel coefficients inferred by the logistic regression, that are specific for each tag. And Xgi is a vector, of seven features extracted for each pair movie-tag (i, g). Three of this features are similarity measures, between the movie i and the tag g, calculated using different user contributed resources such as tags, ratings, and keywords extracted from text-based reviews. Other features are count variables, or averages such as the number of times the tag is applied to the item, number of times the tag appears in the product textual reviews, or the average rating of the product. The last variable is a meta-feature that seeks to incorporate to the survey data, those item-tag pairs selected for the TagGenome, on the assumption that for those pairs, the relevance measure is close to 1. As future work we plan to consider soft similarity in a sense presented in [30], when the similarity of features is taken into account.
3 Proposed LinearTag Models
In this work, we propose a family of tag-based recommender models called the LinearTag models. These models are the tag-based versions, of the Single Value Decomposition (SVD) models, denoted as SVD models (or latent factor models), described by Funk [2] and Paterek [16] on the occasion of the Netflix Prize [1]. Therefore, we will first introduce the Latent Factor Models, in which we inspired, and next, we will present the proposed LinearTag models.
3.1 Latent Factors Models
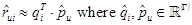
SVD typical models assume that a rating, is a similarity measure between a product u and a user i, both represented as vectors in an abstract (or latent) space of size f. Thus:
 ,
,
where  is the vectorial characterization of the product i, and
  is the characterization of the user u. Usually, the dot product operation is used to calculate the similarity between pairs of those vectors. In this work we will use, two particular SVD models as baselines: the typical RSVD model, and the RSVD+B model (+B stands for “plus bias”). RSVD models, are named after the acronym of Regularized SVD models, in order to emphasize that the norm of the parameters estimated is controlled using a regularization constant λ.
Table 1 shows the equations that Typical RSVD and RSVD+B models use to predict their ratings. RSVD+B models [14] integrate, to the prediction, the user and the product bias, denoted respectively by  and
and  . These bias estimates indicate the deviations, of users and product ratings, from the overall average rating in the system, denoted by µ.

3.2 Linear Tag Models
In this work, we propose the tag-based versions of the latent models shown in Table 1. Therefore in the proposed LinearTag models, we also characterize products and users as vectors, but instead of using a latent space, we use an interpretable space of tags of dimensionality |Γ|. Thus:
Here, we denote the characterization of the product as qi, instead of , to emphasize that in LinearTag models the characterization of the product is known, whereas in latent factor models the product characterization has to be estimated.
With this basic idea, we formulate the family of models presented in Table 2. As it can be observed, Typical LinearTag and LinearTag+B models are the tag-based versions of RSVD and RSVD+B. The Adjusted LinearTag+B method is different because it adjusts the characterization coefficients of the product, qig, by estimating the adjustment coefficients  . Therefore, in the Adjusted LinearTag+B model,
  .
.

We are aware that different authors have proposed the Typical LinearTag model before us [12, 25]. However, we include it in the family LinearTag because it is the starting point of the family and its behavior can be significantly improved by either using the soft-qi, or the TagGenome product characterization.
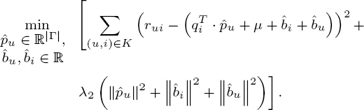
The estimation of the set of unknown parameters  is calculated, in the same way that RSVD models do [2, 16], by minimizing the regularized error of prediction. The regularization is controlled by adding a term that penalizes the norm of the estimates, using the λ constant. Thus:
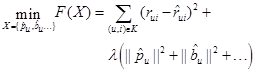 .
.
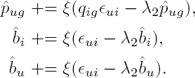
The minimization of the error function is achieved by applying the gradient descent method in successive epochs. In each epoch, the estimation of the parameters is decremented by the gradient of the function to minimize, F(X), multiplied by the learning rate ξ. Therefore, if we represent the parameter to be estimated by xj, where xj ∈ X, the value of parameter xj is modified using the following update rule:
 .
.
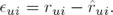
In the following subsections, we describe each of the three proposed methods, indicating for each method the error function to minimize, the meaning of the parameters, and the necessary update rules to estimate the values of parameters. To shorten the expressions, we will denote by  , the difference between a known evaluation and its estimated value:
3.2.1 The Typical LinearTag Model
The typical LinearTag model is the simplest of the LinearTag models proposed. As shown in Table 2, In this model, the user profile, , is the only unknown variable and its value is found by minimizing the function:
 .
.
The assignation of the qig coefficients is made using either the hard-qi, the soft-qi or the TagGenome methodologies explained in section 2.2 Next, we find the coefficients  using the gradient descent method. Therefore, by obtaining the derivative of F(X) respect to pug, we get the update rule:

3.2.2 Proposed LinearTag+B Model
As stated before, the LinearTag+B method includes the user and product bias, denoted respectively as and . User biases can be considered the inherent tendency of users to give higher or lower ratings than the overall average rating in the system µ. Likewise, the product bias , indicates the tendency of certain products to receive higher or lower ratings than the average. For example, the high budget movie Titanic, tends to receive higher rating than similar movies. As in the previous model, unknown parameters  are estimated by minimizing the regularized expression of the prediction error:
Its parameters are estimated using the following update rules:
3.2.3 Proposed Adjusted LinearTag+B Model
The Adjusted LinearTag+B model tries to adjust the initial characterization of the movies, in a collaborative way, by introducing in the expression to minimize, an adjustment vector denoted by  . Therefore the new product characterization coefficients, denoted by
  , are adjusted by multiplying its initial value by the adjustment coefficients . Thus,
  , and therefore, the expression to minimize changes to:

It has the following update rules:

4 Experiments
To experimentally validate the proposed models, we conducted experiments in three different ways. First, we compared the performance of the LinearTag methods against RSVD methods already described in Table 1. Second, we applied the LinearTag methods to a different, but interpretable space, in order to compare the inferred user profiles. Therefore, instead of using a space of tags, we represented products and users in a space of keywords automatically extracted from movie descriptions. The extracted keywords were weighted using a technique similar to tf-idf. Third, and final, we ran an experiment with 25 users to investigate if users can understand and interact with their inferred user profiles as an artifact to control the recommendations that they receive.
4.1 Experiment 1: Comparing LinearTag Methods against RSVD methods
4.1.1 Data
To measure the prediction error of the proposed models, we use the Movielens 1M dataset [7]. This dataset has 1,000,209 ratings of 3,900 films, given by 6,400 users. This data was collected with the movie recommender system http://www.movielens.org. The used tag vocabulary was the 1,129 tags of the TagGenome work [31], which were selected using the quality measure proposed by Sen et al. [23]. The characterization of products, as vectors qi, in the space of tags, was made by using the three methodologies for product characterization explained in section 2.2: the hard-qig, the soft-qig and the TagGenome methodologies. Recall that, unlike hard qig and soft qig methodologies that only use tag applications, the TagGenome approach also requires textual reviews of the movies. For our experimentation, we just use the TagGenome relevance values publicly available at http://files.grouplens.org/datasets/tag-genome. Table 3 shows an example of the ten most relevant tags applied to the movies Toy Story and Rambo, and the relevance values assigned by the logistic regression.
Table 3 Example of the TagGenome folksonomy
| Toy Story (1995) | Rambo (2008) | ||
|---|---|---|---|
| Tag | Relev. | Tag | Relev. |
| toys | 0.999 | world war ii | 0.998 |
| computer animation | 0.998 | wwii | 0.987 |
| pixar animation | 0.995 | best war films | 0.973 |
| kids and family | 0.995 | wartime | 0.965 |
| animation | 0.987 | war | 0.951 |
| animated | 0.979 | true story | 0.944 |
| children | 0.973 | gunfight | 0.923 |
| cartoon | 0.947 | story | 0.863 |
| pixar | 0.941 | germany | 0.862 |
| disney anim. feat. | 0.929 | forceful | 0.856 |
| imdb top 250 | 0.924 | biographical | 0.832 |
| kids | 0.922 | tense | 0.825 |
| story | 0.913 | courage | 0.822 |
| fun | 0.900 | history | 0.793 |
| childhood | 0.898 | historical | 0.770 |
| adventure | 0.894 | runaway | 0.761 |
| light | 0.884 | war movie | 0.754 |
| original | 0.880 | talky | 0.708 |
| great | 0.872 | dramatic | 0.700 |
| great movie | 0.859 | sacrifice | 0.697 |
4.1.2 Evaluation Measure
The metric used to measure the prediction error was the root-mean-square error (RMSE) calculated as follows:
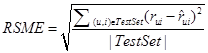 .
.
All values of RMSE are averages over five randomly selected test folds. On each fold, 80% of the dataset was used for training and 20% for testing.
4.1.3 Baseline Method and Initial Values for Parameters
We use the RSVD and RSVD+B methods, described in Table 1, as baselines. We fixed the initial parameters as follows: epochs number: 100, learning rate ξ = 0.001; regularization constants λ1 = λ2 = λ3 = 0.011, dimensions of the latent space f = 1, 129 (the same number of tags in the TagGenome folksonomy |Γ|).
4.1.4 Results and Discussion
Table 4 shows the results obtained for each methodology of product characterization. Since the dawn of collaborative filtering methods [5, 20, 28], content-based filtering systems have been considered their counterpart. Therefore, the success of collaborative latent factor models [1, 11], has brought harsh criticisms over content-based recommenders, mainly due to their poor performance [13, 17, 19]. Our results might provide evidence that supports these criticisms when comparing the poor RMSE = 2.20035 achieved by the Typical LinearTag method against the RMSE = 0.86446 attained by the Typical RSVD method. Fortunately, our results also gives evidence against those criticisms when the RMSE = 0.83525 reached by the Adjusted-LinearTag+B method is observed. As can be seen, content-based recommender systems can be enriched with some features that make them similar or even better than the methods based on latent factors.
Table 4 Rating prediction RMSE results obtained using Movielens1M+TagGenome folksonomy
| Model | Features | RSME |
|---|---|---|
| Baseline Typical RSVD | Latent factors | 0.86446 |
| Baseline RSVD+B | Latent factors | 0.86420 |
| Typical LinearTag | hard-qitags | 2.20035 |
| soft-qitags | 0.96330 | |
| TagGenome | 0.89355 | |
| Proposed LinearTag+B | hard-qitags | 0.90123 |
| soft-qitags | 088835 | |
| TagGenome | 0.85265 | |
| Adjusted LinearTag+B | hard-qitags | 0.88629 |
| soft-qitags | 0.87565 | |
| TagGenome | 0.83525 |
Therefore, first, we can observe that Typical LinearTag RMSE is reduced from 2.20035 to 0.96330, and 0.89355 when products are characterized using either the soft-qi or the TagGenome methodology instead of the hard-qi. The reason is that hard-qi characterization prevents the algorithm, to use not applied tags to estimate their ratings, whereas the soft-qi and the TagGenome permit to do it. Then we can conclude that using a hard-qi characterization that only works with the tags explicitly applied to the movies has a negative impact in the RSME achieved.
Besides, LinearTag + B methods generate a considerable reduction of the RMSE in every method tested. Even the RMSE = 0.85265 reached by the LinearTag+B method using the TagGenome product characterization is better than the RSME = 0.86420 attained by the Baseline RSVD+B. So, we can say that the incorporation of product and user biases into the rating prediction rules make the algorithms smarter as they can distinguish better products among others with similar characteristics, and consequently, they can formulate better recommendations. Furthermore, the Adjusted LinearTag+B method decreases the RMSE in all sets of features by adjusting the characterization of the products in a collaborative way. This last improvement, produced a reduction of 3.3% outperforming the RMSE attained by the baseline method RSVD+B.
4.2 Experiment 2: Comparing LinearTag versus LinearKeyword profiles
In this section, we compare the inferred user tag profiles generated against user profiles defined in other interpretable spaces. For this purpose, we extracted the words in the movie descriptions and characterized movies in a vector space of keywords weighting them using a tf-idf like methodology. We call this a keyword space.
4.2.1 Data
We tested our proposed methods over the same Movielens 1M dataset used in the previous experiment, but we added the characterization of movies in the keyword space.
For this purpose, we first gathered movies synopses and casts descriptions from Netflix’s web pages. Next, we characterized movies as bags of words di. And finally, we preprocessed the aggregated vocabulary Σ to reduce its dimensionality.
We preprocess synopses by concatenating people names and last names (e.g. TomCruise); removing numbers and stop words; and deleting words that occurred whether in less than ten movies or in more than 95% of the movies. After the preprocessing stage, we obtained a vocabulary Σ with a dimensionality of 6.155 words.len
Next, we used the Okapi BM25 [21] weighting scheme as the tf-idf like methodology. Thus:

where coefficients qiw indicate the relevance of the word w to the movie i, df(w) is the number of movies in which appeared the word w, M is the number of movies, tf(w, di) is the number of occurrences of word w in the movie bag-of-words di, len(di) is the number of words in di, and avdl = 33 is the average of words on each document di. According to [21], constants k1 and b where assigned to 1.2 y 0.75. Table 6 shows movies “Bewitched” and “Rocky V” characterized in a keyword space using the Okapi BM25 weighting scheme.

Table 6 Example of movies characterized using Okapi BM25
| Bewitched (2005) | Rocky V (1990) | ||
|---|---|---|---|
| Tag | BM25 | Tag | BM25 |
| WillFerrell | 0.237 | BurtYoung | 0.249 |
| Jack | 0.147 | TaliaShire | 0.242 |
| update | 0.142 | broke | 0.15 |
| Samantha | 0.131 | upandcoming | 0.15 |
| sitcom | 0.131 | shots | 0.15 |
| witch | 0.119 | boxer | 0.15 |
| NicoleKidman | 0.119 | crooked | 0.142 |
| convinced | 0.116 | trainer | 0.136 |
| MichaelCaine | 0.114 | glory | 0.136 |
| right | 0.107 | accountant | 0.131 |
| hoping | 0.105 | ended | 0.131 |
| know | 0.103 | lifetime | 0.128 |
| career | 0.099 | memory | 0.124 |
| perfect | 0.098 | training | 0.124 |
| doesn’t | 0.097 | rocky | 0.121 |
| actor | 0.092 | inspired | 0.107 |
| make | 0.068 | taking | 0.101 |
| film | 0.045 | career | 0.099 |
4.2.2 Results and Discussion
Table 7 shows the results obtained with the LinearKeyword methods. For ease of comparison, we transcribed some results obtained by the LinearTag methods. From these results, we can draw three conclusions. i) LinearTag methods attain lower RMSEs than LinearKeyword methods, ii) in the same way that LinearTag methods do, LinearKeyword methods reach an important reduction in their RMSEs when user and product bias estimators are incorporated in the rating prediction, lowering the RMSE from 3.73389 to 0.90912, and iii) the method Adjusted LinearTag+B does not produce improvement when it is used with a product characterization based on a tf-idf like methodology.
Table 7 RMSE in Movielens1M+Netflix Keywords
| Model | Weights | RSME |
|---|---|---|
| Typical LinearKeyword | BM25 | 3.73389 |
| Typical LinearTag | soft-qi | 0.96330 |
| Proposed LinearKeyword+B | BM25 | 0.90912 |
| Proposed LinearTag+B | soft-qi | 0.88835 |
| Adjusted LinearKeyword+B | BM25 | 0.90914 |
| Adjusted LinearTag+B | soft-qi | 0.87565 |
Table 8 and Table 9 show respectively the TagProfile and KeywordProfile of a particular user from the Movielens system. If we observe the ‘Liked” ‘column in Table 8, we can see that the user likes horror, sci-fi and actions movies. Whereas, if we read his (or her) KeywordProfile we have to do a little research of the proper names to understand how both profiles describe the preferences of the same user. From this research, we learned that Angela Bassett has had a recurring role on horror series, as well as Michael Rooker, who is famous for his participation in “The Walking Dead” and “Henry: Portrait of a Serial Killer”. Following the comparison, keywords such as such as “thriller” and “killer” seem informative, but we also find non-informative keywords such as “crash”, “city” and “school” that, at first sight, does not seem to give any clue about user’s preferences.
Table 8 An example of the ten most liked and disliked tags in a TagProfile of a random user
| TAGS | ||||
|---|---|---|---|---|
| rank | Liked | pug | Disliked | pug |
| 1 | true story | 0.182 | light | 0.238 |
| 2 | vampire | 0.179 | talky | 0.185 |
| 3 | crime | 0.160 | queer | 0.182 |
| 4 | creepy | 0.151 | world war ii | 0.164 |
| 5 | Coming of age | 0.149 | cross-dressing | 0.149 |
| 6 | rape | 0.145 | oscar (best cinem | 0.142 |
| 7 | vampires | 0.140 | humorous | 0.139 |
| 8 | action | 0.137 | muppets | 0.138 |
| 9 | sci-fi | 0.136 | africa | 0.127 |
| 10 | suspense | 0.134 | multiple story lines | 0.122 |
Table 9 An example of the ten most liked and disliked keywords in a KeywordProfile of the same user from Table 8
| KEYWORDS | ||||
|---|---|---|---|---|
| rank | Liked | pug | Disliked | pug |
| 1 | thriller | 0.016 | best | 0.011 |
| 2 | MichaelRooker | 0.015 | Won | 0.009 |
| 3 | killer | 0.015 | WoodyAllen | 0.008 |
| 4 | crash | 0.013 | Madonna | 0.006 |
| 5 | TomSizemore | 0.013 | SpikeLee | 0.006 |
| 6 | AngelaBassett | 0.012 | comedy | 0.005 |
| 7 | City | 0.012 | NeilJordan | 0.005 |
| 8 | marty | 0.012 | BobHoskins | 0.004 |
| 9 | scott | 0.012 | JackWarden | 0.003 |
| 10 | School | 0.012 | FrankOz | 0.003 |
Same happens when we compare the columns labeled “Disliked” of the inferred user profiles. Again, with a little research we learned that keyword “FrankOz” in the KeywordProfile can be aligned to the tag “muppets” in the TagProfile because Frank Oz performed the Muppet characters of Miss Piggy and Fozzie Bear. Also, actor Jack Warden seems to have participated in several comedies. Therefore, with these observations, we conclude that when compared against keywords, tags vocabularies are more suitable to express people preferences, or at least they require less domain knowledge to be understood.
4.3 Experiment 3: Using TagProfiles as an Artifact of Interaction
To test the TagProfiles generated, we developed an movie-recommender-system interface based on TagProfiles and tested it with 25 users. This interface builds users’ TagProfiles as users rate movies and then formulates new recommendations as users modify their TagProfiles. Individuals were undergraduate and graduate computer science students at the Universidad Nacional de Colombia.
4.3.1 Survey Questions
The purpose of providing users with their explicit TagProfiles was manifold. Particularly we wanted to find answers to the following questions:
4.3.2 An Interface based on TagProfiles
We developed a prototype of a movie recommender system based on LinearTag models. The collection of movies used is the one of the Movie-lens 1MB dataset, with the same tag folksonomy used in the experiment 1. We characterize movies using the soft-qi characterization methodology, which only needs the information of the set of tags applied to each movie.
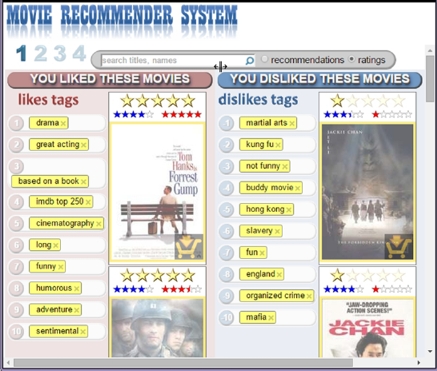
Figure 1 and Figure 2 show the two phases of the TagProfiles interface developed. In the first phase, users rate movies as they observe how their TagProfiles are inferred and displayed. In the second phase, users obtain new recommendations as they criticize their profiles by editing them. Figure 1 shows an example of interaction during the first phase of the TagProfiles interface. In the example shown in the screen-shot, a hypothetical user rated several movies starring Tom Hanks with five starts and several movies starring Jackie Chan with one star. Then, it can be seen that the system inferred that user’s most liked tags are “drama”, “greatActing”, “basedOnaBook” and so on. The most disliked tags are “martialArts”, “kungFu” and so on. Figure 2 shows an example of the interaction on phase two. Now, the same user inserts into his (or her) profile, tags related with Japanese animes such as “Miyazaki”, “Studio Ghibli”, “animated” and so on. Then, the system recommends Miyazaki’s most awarded movies such as “Spirited Away” and “Howl´s Moving Castle”.

4.3.3 Users Experience
We introduced the system to participants showing them a brief tutorial on the system and then asked them to rate at least 20 movies before they change to phase 2. Then, in phase 2 users were invited to refine their profiles by reordering and deleting the tags they do not agree with and adding new tags until their profile reflected their preferences. As users modified their profiles, they received new recommendation; so we asked users to add to their wish-lists those movies they considered interesting. The experience finished when users completed five movies in their wish-list. Finally, we asked them to fill a little survey with the following questions:
4.3.4 Results and Discussion
We got the following results:
90% of users consider their profiles properly capture their preferences.
100% of users found at least three new tags and enumerate them.
100% of users filled their wish-lists with at least five movies.
From this experience we draw three conclusions. First, collaborative tags definitively are a suitable vocabulary to express user preferences. Second, TagProfiles, used as artifacts of exploration, help users to elicit their preferences relieving the vocabulary problem. Third, TagProfiles empower users to explore actively the data collection in a very personalized way.
5 Related Work
The research for models based on tags and the comparison of them against models based on latent models is not new. In fact, some hybrid models reach similar RMSE rates as the model TagiCofi proposed by Zhen et al. [32], or the model Hybrid-Tag proposed by Sen et al. [25]. These hybrid models produce rating estimations that can be viewed as a weighted average of the predictions given by tag-based models and latent-factor models. In spite of their precision, we did not compare our proposed models against them because we are interested only in fully interpretable models to generate linear profiles (or TagProfiles) that let users explore a collection in a personalized way by modifying this profile. For this reason, we focus our attention on the improvement of linear models based on tags.
Regarding those models, in the work Tagommenders [26], Sen et al. propose the models Implicit-Tag, Implicit-Tag-pop and Regress-Tag. Similarity, Nguyen et al. [14] proposed variations with reduced dimensionality of the Regress-Tag model named Implicit-Tag, Implicit-Tag-Pop. Among these models, Regress-Tag is the only one that produces numerical estimations of ratings using the following linear regression:
where coefficients  are the weights assigned to the user affinity coefficients pug, in order to minimize the prediction error. The coefficients pug are not estimated in the linear regression because they are calculated in a previous phase. The coefficients pug are calculated using a Bayesian generative model that believes that ratings rug, that users give to movies with an specific tag g, are observed variables produced by a hidden variable pug, which in turn is generated by a normal distribution whose media and variance are estimated by maximizing the likelihood of the ratings rug observed. According to the reported results, Regress-Tag was the best method but could not attain the error margin of RSVD baseline, producing a prediction error 3.57% superior.
On the other hand, the tag-based recommendation method proposed by Nguyen et al. [14] reached the prediction error attained by the latent factor methods. This model predicts ratings using the same regression model used by the Regress-Tag method. In addition, this model produces low-dimensional TagProfiles with only those tags that can predict more of the 50% of the rating using a metric based on mutual information [27]. The main issue of this approach is that predictions can only be formulated and presented to users with this kind of tags. For other users, it is necessary to lower the percentage of prediction, and when this happens, the prediction error increases in a considerable way. For example, when the percentage of prediction is lowered from 50% to 40% the error measure increases by a 46%, surpassing the RMSE produced by latent factor models by 41%.
From this review, we conclude that at the moment, there are not approaches that reach the same RMSE errors attained by our methods.
6 Conclusion
In this work, we experimented with building user profiles based on tags as a resource to generate recommendations and also as a tool for providing a personalized browsing experience of a data collection for the users. For this purpose, we proposed a set of methods (LinearTag) that generates interpretable linear user profiles achieving similar or even lower prediction errors than the ones produced by the methods based on latent factors in the state-of-the-art.
Next, we compared profiles based on tags (TagProfiles) against those based on keywords automatically excerpted from product descriptions. Unlike tags, keywords were more difficult to understand requiring, in some cases, domain knowledge for interpretation and in other cases, they cannot be interpreted in the context of user preferences.
Finally, we experienced with 25 users who interacted with their TagProfiles with the aim of getting new recommendations by modifying their profiles. This experience showed that: i) users interacted with their TagProfiles in a natural way; ii) users easily improved their tag vocabulary as they interacted with their profiles; and iii) users participated actively in the process of adjusting their profiles as they received new recommendations better adjusted to their preferences.

