


 nueva página del texto (beta)
 Inglés (pdf)
 Artículo en XML
 Referencias del artículo
 Enviar artículo por email
 Citado por SciELO
  Similares en
SciELO
Similares en
SciELO 
 Permalink
1 Introduction
Human stampedes caused by panic and overcrowding occur frequently because of abnormal events (e.g., a fire or explosion) produced in collective events (e.g., religious pilgrimages, music concerts and sportive events). These events provoke panic and when people are agglomerated they try to escape pushing each other without realizing that others are being crushed. Since crowds can consist of individuals with diverse physical (i.e., anthropometric) and social characteristics determined by cultural diversity, it is difficult to configure the space in advance and find solutions in real-time to save people and reduce catastrophe.
Crowd simulations for humanitarian logistics provide means for studying crowd behaviour under different conditions. After studying video pedestrian patterns, behavioural scientists have concentrated on the rules that people are accustomed to using in their daily lives and transform them into heuristic formulas. They have focused mainly on four types of danger associated with crowds: (i) trampling and crushing at religious sites; (ii) trampling, crushing and drowning on ships at sea or waterways; (iii) crushing in massive concerts or enclosed spaces such as clubs; (iv) contingency situations of nature, as can be earthquakes, floods, avalanches or landslides, that cause destruction to human made structures.
Simulating crowded places helps architects to design safe public spaces. However, until now, they have ignored everyday human behaviour when walking, particularly in groups, waiting for children or elderly members of the group, or stopping to talk, or even tying shoelaces, which imply much more complex simulations. Indeed, humans react to stress and crowding in different ways depending on their size, age, gender and other physical characteristics; on their personal psychological characteristics; on whether they are alone or in groups such as family. Their behaviour also changes per culture dependent characteristics such as proxemics, and even by how people of different cultures understand instructions. Ignoring these fundamental aspects dehumanizes people by simply considering them as particles that react to forces according to their mass.
This paper proposes an approach to explore the impact of anthropometry and cultural diversity in the behaviour of crowds in panic situations. Human density makes people come into physical contact creating behaviour that can be understood as an exchange of real physical forces. Our approach models crowds using microscopic simulation using multi-agent systems, where dynamics is coupled with crowd simulation modified by anthropometric and cultural parameters. Our approach includes techniques for reproducing and simulating the behaviour of the crowd to generate models that can help decision making to control such situations. The main contribution of our work is to use computational science, data processing and visualization techniques to perform our simulation for eventually supporting critical decision making.
The remainder of the paper is organized as follows. Section 2 presents a general overview of existing work dealing with challenges related to crowd studies focusing on behaviour modelling, simulation and decision making. We particularly address data management issues related to the analysis and simulation processes of the crowds in the context of humanitarian logistics. Section 3 introduces our agent based approach for simulating crowds for addressing human logistics. Section 4 describes the experimental validation that we conducted for simulating a case of stampede and discusses our results. Section 5 concludes the paper and discusses future work.
2 Related Work
Pedestrians have been empirically studied for more than four decades [1, 2, 3]. Initial methods were based on direct observation, photographs, and time-lapse films to develop a level-of-service concept [4], design elements of pedestrian facilities [5, 6, 7, 8], or planning guidelines [9]. Most research into panic, however, has been of empirical nature (e.g., [10, 11, 12, 13]), carried out by social psychologists and others.
Simulation models have been proposed for addressing crowd dynamics modelling, route choice behaviour of pedestrians, and emergency and evacuation situations. Experimental efforts have revealed quantitative details of pedestrian interactions, which have been modelled by mathematical equations. Corresponding computer simulations of large numbers of pedestrians have been compared with the empirically observed dynamics of crowds. Such studies have led to a deeper understanding of how collective behaviour on a macroscopic scale emerges from individual human interactions. The analysis of crowds using mathematical and simulations lead to important conclusions for developing human logistics strategies. For example, self-organized patterns of motion demonstrate that “intelligent” collective dynamics can be based on simple local interactions; under extreme conditions, coordination may break down giving rise to critical crowd condition such as the so called “freezing-by-heating” and “faster-is-slower” effects, but also the transition to “turbulent” crowd dynamics. This section describes existing works according to four perspectives: techniques used for observing high density crowds which we understand as possible data harvesting methods (section 2.1); crowd models that provide mathematic abstractions of crowd behaviour (section 2.2); simulation of crowds that apply mathematical and artificial intelligence methods for reproducing the way crowds evolve under different conditions (section 2.3); finally humanitarian logistics that integrate existing methods into systems that support decision making (section 2.4).
2.1 Observing High Density Crowds
The computer vision community has started addressing different research problems related to the scenarios involving large crowds. Existing approaches focus on the tasks of crowd detection, and detection and tracking of individuals in the crowd. These approaches have mainly used representations based on xt slices of spatio-temporal video volume [2], shape and colour models of individuals [14], boundary contours [15], trajectories of interest points [16], and approaches which explicitly count the number of people in the crowd [2, 3].
Computer vision algorithms cannot handle crowded scenes because their performance concerning object detection, tracking and event detection decreases in such conditions, [17] addresses this problem by modelling moving crowds as aperiodic dynamical systems manifested by a time dependent flow field. Such a flow field in a general scene consists of regions with qualitatively different dynamics, reflecting the motion patterns emerging from the spatio-temporal interactions of the participants between each other and with the physical world [18].
Also proposes a crowd classification with respect to density and then it discusses methods that can be applied to track people within crowds. In a scene with a sparse or moderate crowd, most pedestrians can be fully observed and the pedestrians can be detected with a frame-based human detector. Persons are then tracked by combining detections into tracklets and associating the tracklets into long trajectories [5, 19].
In [20, 21, 22] it is proposed the Data Association based Tracking (DAT) algorithm, which is extended by using shape and appearance models [23], body-part detectors [24], or a boosting algorithm to train the parameters [25]. However, in a denser crowd where the pedestrians are heavily occluded by the others, frame-based detection is highly unstable, and associating among many trajectories is very expensive. To address this limitation, it is possible to use local feature points to track individual within a crowd. Brostow [16], Li [26], and Sugimura [27] were among the first to do this. They assume that the feature points belonging to the same person are close in space and their motion exhibit high correlation over time. The most important limitation of this approach is that targets moving together with the same speed cannot be identified as separate persons, whereas a local body movement is usually wrongly estimated as a different target.
Optical flow algorithms have been widely used for tracking pedestrians. Initial approaches assume that optical flow on the target is uniform, and the target is tracked by computing the mean flow around the target location [28, 29]. Some approaches use foreground-background segmentation to get a precise target region. In crowded scenes, targets are frequently occluded and their region changes over time. Thus, the target location does not change linearly. This requires a propagation model that adaptively changes over time and space with non-linear behaviour like the solutions proposed by Rodriguez [15] and Kratz [30]. In the high density and the extremely dense crowd situations, the most promising tracking algorithms use motion information in local areas. For example, Ali and Shah [17] assume that pedestrians in the crowd behave as particles in the flow. This assumption leads to a solution only able to track pedestrians moving in the same direction as the crowd. Rodriguez [31] first divide the video into short clips and for each local area in the clip, flow vectors are quantized into four categories based on the direction where vectors are heading. The quantized clips are trained within the Correlated Topic Model (CTM), generating a set of topics. For each new frame, a probability distribution over the topics is measured, and the probability of the motion is then derived. The new target position is estimated as a combination of the observation and the tracker prediction.
2.2 Modelling Crowds
In his fruitful work Helbing has proposed a simplified model of pedestrian interactions: the “social force model”. He has addressed crowd dynamics, typically the formation of large-scale spatio-temporal patterns of motion, when many pedestrians interact with each other. Helbing et al. [32] found that high-density flows, such as flows with extreme local densities of up to 10 people per square meter, can result in a phenomenon called crowd turbulence and can trigger the trampling of pedestrians. To prevent such disasters high-density flows must be avoided, particularly the three conditions that can result in a disaster: (i) low infrastructure capacity, (ii) large numbers of pilgrims, and (iii) merging flows, intersecting flows, or counter flows (i.e., flows of people moving in opposite directions), especially in reduced spaces. If many pedestrians head toward or pass through a location with low infrastructure capacity in a short time, this location can become a bottleneck with high densities and a high risk of crowd turbulence.
2.3 Simulating Crowds
Numerous occurrences of stampedes in the recent past have shown that better coordination between public safety organizations and remodelling alone cannot solve the problem of managing large crowds. Prediction of pedestrian-flows in pedestrian zones, and buildings with an exceptional architecture or in challenging evacuation situations, have been addressed by simulation models (e.g. queuing models [33], transition matrix models [34], and stochastic models [35]). In addition, there are models for the route choice behaviour of pedestrians [7, 36]. Helbing observed that none of these modes adequately considers the self-organization effects occurring in pedestrian crowds. A first modelling approach that seems suited to reproduce spatio-temporal patterns of motion was proposed by Henderson [37, 38], who conjectured that pedestrian crowds behave similar to gases or fluids. Realistic gas-kinetic or fluid-dynamic theory for pedestrians contain corrections due to their specific interactions (i.e. avoidance and deceleration manoeuvres). Thus, for practical applications a direct simulation of individual pedestrian motion is easier and more flexible to achieve. In consequence, pedestrian simulation mainly focuses on agent-based models of pedestrian crowds, which allow to consider local coordination problems. The “social force model” [31, 39], is maybe the most well-known of these models, but there are also cellular automata of pedestrian dynamics models [6, 8, 40, 44] and AI-based models [45, 46]. Below we present a brief description of the main behaviour models based on AI.
Reynolds [47] proposed one of the first solutions for large groups of entities with emergent behaviour being an extension of particle systems. It is based on three basic rules: separation, alignment, and cohesion. These rules maintain together, in a direction and free of collisions a group of boids or bird-like objects.
The Predictive/Velocity-based models [48] propose methods where agents compute the set of velocities that lead to a collision with an obstacle. To move on routes without collision, agents choose velocities outside this domain. This concept is expanded by Van den Berg [49], [50], introducing the notions of Velocity Obstacles (VO) and Reciprocal Velocity Obstacles (RVO) and the notion of Optimal Reciprocal Collision Avoidance (ORCA).
In the everyday exercise of controlling their locomotion, human beings rely on the visual information obtained from the perception of the environment to achieve collision-free navigation. Cognitive science allows extracting relatively succinct information from perception to reach a safe locomotion, e.g., using the distance of obstructions in candidate lines of sight, pedestrians apply simple heuristics to adapt their walking speeds and directions.
When observed, the individuals in a crowd seem to adopt an “automatic behaviour” that can be interpreted as the result of a learning process based on trial and error [32], which has been simulated with evolutionary algorithms [51]. For example, pedestrians have a preferred side of walking since an asymmetrical avoidance behaviour turns out to be profitable [25, 32, 39]. Claim that the formation of a behavioural convention can be described by means of evolutionary game theory. Based on quantitative measurements studies have shown that the behaviour in conflict situations can be described by a superposition of forces [52, 53]. In this sense, Lewin [54] proposes a mathematical model based on the idea that behavioural changes are guided by social fields or social forces [39, 55].
2.4 Humanitarian Logistics
Humanitarian logistics specializes in organizing supplies during natural disasters or complex emergencies to affected areas or people. During these events technology is a key factor to achieve better results. For instance, by implementing up-to-date information and tracking systems, and using humanitarian logistics software, it is possible to provide real-time supply-chain information so that humanitarian organizations can enhance decision making, increasing the quickness of the relief operations and achieving better coordination of the relief effort. Existing humanitarian logistics systems are operations research based decision support systems (ORDSS) for crowd management, which employ a range of tools from operations research, analytics, and crowd dynamics [56]. At its core, such systems implement a scheduling tool and a real-time video tracking system. The video tracking system measures infrastructure utilization, and an integrated series of mixed-integer programs and quadratic programs balance capacity utilization by considering preferred stoning times and infrastructure capacities. The ORDSS provides solutions that enable uncongested and smooth pilgrim flows, for example, and extensive real-time reporting.
2.5 Discussion
Our analysis of existing work, as shown in this Section, enumerates multidisciplinary approaches and results. Addressing realistic simulation of human stampedes calls for a strategic combination of such results adding dimensions that have not yet been considered. Harvesting real data from social phenomena and modelling them as done by Helbing, adding the urbanistic dimension which provides constraints to the modelling of crowd behaviour. Real data has demonstrated to be essential for understanding collective human behaviour, modelling it and then doing prediction and prevention for avoiding catastrophe.
Our study shows that, once the collective behaviour has been modelled it is interesting to have experimental environments with accurate simulations that can support prevention under controlled conditions. Accurate simulations ensure that both prevention and decision making strategies can be eventually useful in real conditions. When accuracy is expected, it is not only modelling the behaviour which is crucial but also reproducing similar conditions by tuning variables. Visualization in this context plays an important role since it can help to reproduce the studied social phenomena, in our case stampedes.
Unlike existing contributions, in this research we focus on sociocultural aspects identified in the last stampedes occurred in Mecca, and demonstrate their impact in a possible humanitarian catastrophe (e.g., in the holy places of Islam) simulation.
3 A Sociocultural Perspective for Simulating Human Stampedes
Figure 1 gives an overview of our approach for simulating stampedes taking into consideration sociocultural and anthropometric perspective.

The principle of our approach is to develop a multi-agent system for simulating the behaviour of a dynamic crowd consisting of multicultural individuals evolving in an urban space. In this context:
– An urban space is a spatio-temporal region modelling an “urban” configuration consisting of a geometric area with signals exists designed for dynamic pedestrians’ flows of specific densities moving with respect to predefined trajectories. Spaces configurations and characteristics are designed considering an anthropometric model.
– The anthropometric model describes the physical characteristics of people that will visit that urban space.
– The organization of the space, the signals and amenities serving to control the crowd in normal and abnormal situations consider sociocultural aspects.
These aspects are included in the behaviour model associated to the agents of our system that will behave depending on a social behaviour implemented by a mathematical model with associated rules and constraints representing anthropometric and sociocultural models to make the behaviour of agents as realistic as possible. The objective being to simulated a dynamic pilgrim crowd as close as possible to reality.
3.1 Anthropometric and Sociocultural Model
There is variability between the body dimensions of different people, because of their age, gender and ethnicity. This variability makes it necessary to measure the population of people who will use the facilities to host a dynamic crowd for example in a pilgrimage. The objective is to design the spatial area and the trajectory considering the range of measures of each person belonging to the crowd. For this, measures should be expressed for a specific configuration of pilgrims according to their size and phenotypic values associated with standard deviation and percentiles of that population. The phenotypic values and anthropometric measures are given by existing models that we adopt (Table 1).
Table 1 Anthropometric measurements considered in our model
| Variable | Measurement Unit | Variables | Measurement Unit |
|---|---|---|---|
| Age | Years | Height | Centimeters |
| Weight | Kilograms | Body Mass Index (BMI) | (kg/m2) |
| Total Arm Length | Centimeters | Upper Arm Length | Centimeters |
| Lower Arm Length | Centimeters | Wrist circumference | Centimeters |
| Upper Arm Circumference | Centimeters | Upper Arm Circumference (contracted) | Centimeters |
| Chest Circumference | Centimeters | Chest Circumference (contracted) | Centimeters |
| Hip Circumference | Centimeters | Thigh Circumference | Centimeters |
| Calf Circumference | Centimeters | Hand Width | Centimeters |
| Shoulder Width | Millimeters | Hip Width | Millimeters |
| Bi-Humerus Diameter | Millimeters | Bi-femur Diameter | Millimeters |
| Wrist Diameter | Millimeters | Body Density (BD) | (gm/cc) |
| Percentage Body Fat | % | Total Body Fat (TBF) | Kilograms |
| Lean Body Mass (LBM) | Kilograms | Grip Strength (Right Hand) | Kilograms |
| Grip Strength (Left Hand) | Kilograms |
Another important aspect to consider particularly for logistics and organization reasons, both in normal and abnormal situations, are sociocultural aspects. For example, in one of the human stampedes in Mecca, two leading forces were identified by analysing videos. Iranians whose average height often exceed 1.89 and greater muscle mass, and Malians with similar anthropometry but with different languages and sociocultural references. Analysts observed the lack of information in different languages, but also a sociocultural aspect of group formation when walking particularly Iranians and parishioners from Africa.
This behaviour is not present in the Saudi Arabian society used to evolve in that environment. It is important to see how different groups react to visual signs, since in some cultures visual warnings are not used, and inexperienced travellers, both adults and children, can get confused and be unable to follow instructions for proper evacuation. Therefore, in our model we considered sociocultural aspects of the individuals participating in crowds. Since we are interested in simulating dynamic crowds in pilgrimages with years of tradition, we assume that we know: (i) the average distribution of nationalities attending the pilgrimages; (ii) the average distribution of men, women and children; (iii) the ethnographic and crowd tracking studies, as well as the cultural aspects that can have impact on the behaviour of the crowd in the presence of an abnormal event (e.g., a stampede).
The sociocultural aspects that we considered in our model are: (i) collective behaviour in public spaces (civility, awareness of traffic signs, respectfulness of traffic signs), (ii) automatic behaviour in dynamic crowds that follow a specific direction (whether people tend to form lines, lineage to the right/left) and (iii) the vital space (the minimum and maximum separation space between two people). For individuals’ social behaviour in the presence of an abnormal event, we adopt the assumptions of existing work discussed in Section 2, saying that crushing and pushing depends on the urban facilities and of a kind of irrational behaviour of the crowd that depends on the global vision or knowledge that people can have of the space. This knowledge can create or not confidence and reduce the degree of panic.
We designed our agent system taking into consideration the anthropometric characteristics and sociocultural knowledge that guides the behaviour of the agents when they evolve in the virtual space. We thereby obtain a realistic simulation of the dynamic crowd. Indeed, avatars representing agents in the crowd have anthropometric characteristics considered in our model. Their interaction with the environment and with other agents is guided by the associated sociocultural constraints. Section 4 shows how these attributes are interpreted into concrete measurements implemented by agents used for simulating a concrete dynamic crowd.
Figure 2 shows the general architecture of an agent that composes the multi-agent system that simulates a dynamic crowd in our approach. An agent is a complex autonomic intelligent system that implements an event-reaction cycle guided by the internal knowledge it computes thanks to the data it receives and processes. The data are produced:

– Continuously: the events happening in the environment through the Perception module.
– In batch: concerning the general plan of the space where the agent will move. These data include the objects in the space, the urban facilities, and they are store in the World model base of the Knowledge module.
The agent processes these data guided by the behaviour rules coded the Behaviour module. The agent plans goals and executes actions that will have impact on the environment.
The distributed knowledge is used by the multi-agent system that generates a collective behaviour. This behaviour is implemented in the simulation of a dynamic crowd evolving in a collective event. The agents and environment of our approach have a projection in a virtual 3D world that visualizes their individual and collective behaviour.
4 Experimentation
Our experiment is related with a religious event in a Muslim world with people from diverse societies, heterogeneous sociocultural characteristics (e.g., different nationalities and having different understanding of the visual announcements written in Arab) and anthropometry.
We chose Menge1, a cross-platform, extensible, modular framework for simulating pedestrian movement in a crowd, including social behaviours modelled by Helbing, Reynolds, ORCA some of them briefly presented in Section 2. As said in the discussion of Section 2 we used these results which have been recognized to be representative of crowd behaviour in urban spaces and therefore Menge seemed a well-adapted platform.
Menge’s architecture is inspired by an implicit decomposition of the problem of simulating crowds into four components: religious masses, mass concerts, shipwreck and floods. Different combinations of sub problem solutions yield crowd simulators with likewise varying properties. Menge creates abstractions for those sub problems and provides a plug-in architecture so that a novel simulator can be dynamically configured by connecting built-in and bespoke implementations of solutions to the various sub problems.
4.1 Use Case: the Hajj
The Hajj, the annual Muslim pilgrimage to Makkah in Saudi Arabia, is one of the largest pedestrian events in the world. It takes place from the 8th to the 13th day of Dhu al-Hijjah, the 12th and last month of the Islamic (lunar) calendar. Each year, up to four million pilgrims approach the holy sites in the region of Makkah to perform their religious duty during many days. In 1950, fewer than 100,000 pilgrims performed the Hajj; in 2005, the number of pilgrims performing it exceeded two million for the first time. Until 2006, several crowd-related disasters led to thousands of casualties. Thus, the Ministry of Municipal and Rural Affairs of the Kingdom of Saudi Arabia (MOMRA) launched projects to prevent future crowd-related accidents.
4.2 Experiment Design
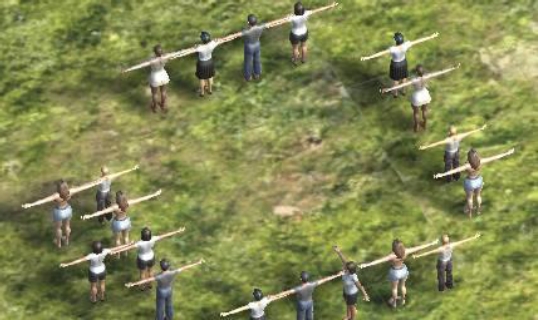
To simplify the simulation problem, in the Design of the Experiment (DOE) we consider that the crowd attending the Hajj is composed of groups belonging to four kind of Muslim societies: Iranians, Muslim Africans, Muslims Asians no Arabs and Arabs. To obtain an accurate model and social behaviour of the crowd our system maintains data about representative individuals in each group and data related to the cultural aspects. The latter is done to distribute in an optimal way for each zone of the mosque associated to a group a specific social behaviour. We propose a realistic model using the Unity engine to visualize the diversity of individuals of different kinds of social groups (see Figure 3). Note that Figure 3 underlines the relationship of space occupation of the different avatars depending on their associated anthropomorphic model. Some are must robust than others, taller, slimmer and so on.
The main experiment consisted in evaluating individuals from group of parishioners, and performing a simulation on 200 replicas for 100 instances of individuals. This allowed the generation of the best selection of every social group and its possible location in the representation of the DOE (cf. figures 4 and 5). The location of each group is obtained by comparing the different cultural and social similarities of each group, and evaluating the proposed multiple matching model.
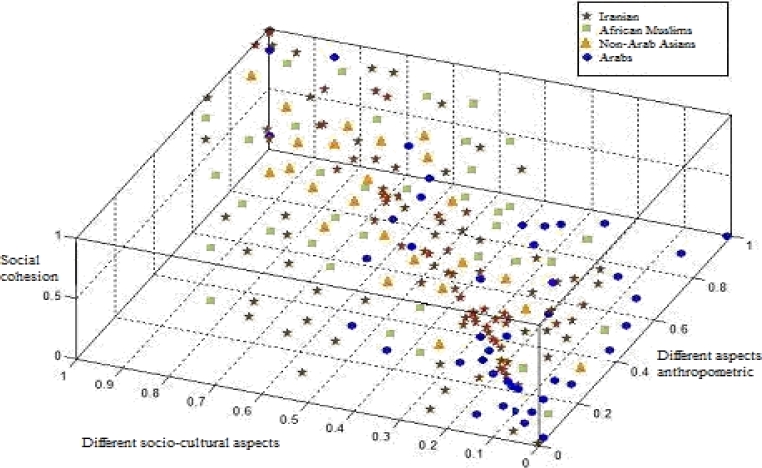
Fig. 4 Spatial representation of sociocultural behaviour categories of the four types of participants in the religious Hajj event.
We defined a weight vector for tuning the fitness function used for simulating people in the crowd:
Wi = [0.6, 0.7, 0.8, 0.5, 0.6, 0.4, 0.9, 0.5, 0.4].
It represents the importance of the attributes associated with a good parishioner (cf. table 3): a) emotional control, b) social cohesion, c) intelligence, d) mental agility, e) inner strength, f) resistance (stoicism), g) social leadership, h) slew rate, i) responsiveness. For defining these values we used the social behaviour models proposed by Bogardo2 that have been used in problems with similar characteristics.
Table 3 Orthogonal matrix for characterizing the Hajj population
| a | b | c | d | e | f | g | h | i |
|---|---|---|---|---|---|---|---|---|
| 0 | 1 | 2 | 2 | 3 | 3 | 4 | 5 | 1 |
| 0 | 1 | 2 | 2 | 3 | 4 | 5 | 5 | 1 |
| 1 | 1 | 3 | 2 | 4 | 4 | 2 | 1 | 2 |
| 1 | 1 | 3 | 2 | 5 | 3 | 2 | 1 | 2 |
Each attribute is represented by a discrete value between 0 to 5, where 0 represents the null value and 5 the highest value of the attribute. Besides each attribute is pondered by preference/importance specified by the application context. For instance, for a given analysis, it might be interesting to observe the behaviour of the crowd focussing on responsiveness.
The DOE selects the colour of each group based on the similarity of two racial groups according to these attributes. Similarity is determined as follows. Given two racial groups the following fitness function determines their similarity:
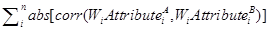
– Wi= vector of weights that represent the importance ponder of attribute i.
– A, B = represent the compared groups.
– Attributei = vector of the attribute values from each group.
While the correlation value decreases, the similarity between racial groups is stronger.
A threshold of .05 is established, if the correlation value is less than the threshold, we assume that there is no relationship between the groups.
The design of the experiment consists in an orthogonal array test, with the interactions between the variables: emotional control, ability to fight, intelligence, agility, force, resistance, social leadership, and speed. These variables featuring each possible response of individual behavior. Table 3 shows some possible scenarios resulting from the combination of the values of the attributes and specific sociocultural to represent a problem in a religious place (meaningful representation to participate in the Hajj).
Each column represents a feature (i.e., a. emotional control, b. social cohesion, c. intelligence, d. mental agility, e. inner strength, f. resistance (stoicism), g. social leadership, h. slew rate, i. responsiveness). Each row represents a racial group considered in our experiment (recall that we consider 4 racial groups as shown in Figure 4).
4.3 Simulation Results
The results allow us to analyse the effect of the variables in the colour selection of all possible combinations of values reported in Table 3. The colour code corresponds to the one discussed in the previous Section: Iranians in green, Arabs in Cyan, Blue and Pink respectively Indonesians and Malaysians, Africans in red.
Figure 4 shows the distribution of agents generated for each group considering their social cohesion, anthropometric and sociocultural characteristics (axis of the 3D space represented in the Figure). We can obtain the speed of walking by measuring the time required to reach a percentage (e.g. 40%) of the desired velocity, starting from rest. This speed is typically in the range of 17 km per hour but it depends on the pedestrian’s current state of fitness and stress, fatigue, drunkenness, inability, group binding, footwear, weight, height, desire to reach a goal, climate, signals, noise, etc. In this case, we use the following equation:
 ,
(1)
,
(1)
where:
E: age,
K: represents the degree of care required depending on an agent characteristics. It is given by K= α+b 2 where a denotes expected behaviour of the agent given by the degree of disorientation based on the weather; and b denotes the actual behaviour of the agent i.e., its degree of fatigue,
J: denotes an attribute of an agent (i.e. models an agent behaviour), i: agent, t: time,
n: number of social attributes per agent,
λ: inability to find an exit,
C: number of relatives.
The Figure 6 shows that we generated a representative population (agents) that we can use to simulate their behaviour during the Hajj event using the characteristics of the space in which they evolve. We can also estimate the speed at which they evolve in the space.

Since we simulated the behaviour of pilgrims during the Hajj circuit they perform in the Masjid al-Haram mosque, we represented a schematic yet realistic distribution plan of the mosque. To understand the distribution, we first explain the way the ritual of the pilgrims is organized in the mosque. The ritual of Tawaf that they perform includes: (1) Walking seven times counter clockwise around the Kaaba. During this circuit a pilgrim “stops” in front of the Black Stone or at least reduces her pace to point it. A pilgrim performs three rounds in a hurried pace and four in a leisure pace. Tawaf is now also performed on the first floor and roof of the mosque because of the large crowds. (2) Then, a pilgrim does two Rakaat prayers at the Place of Abraham a site near the Kaaba inside the mosque. Because of large crowds during the days of Hajj, they may instead pray anywhere in the mosque. (3) After prayer, pilgrims drink water from the Zamzam well, made available in coolers throughout the Mosque. (4) Finally, a pilgrim runs or walks seven times between the hills of Safa and Marwah, located near the Kaaba.
The place is entirely enclosed by the mosque, and can be accessed via air-conditioned tunnels.
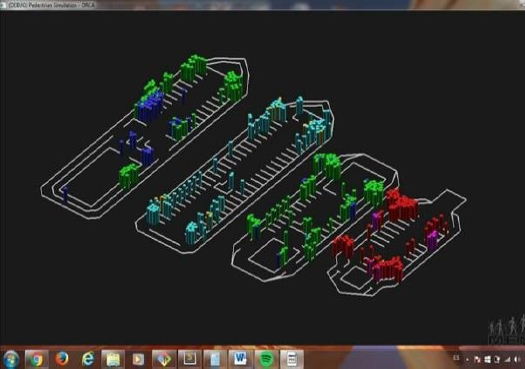
Figure 5 shows the plan of the mosque (different levels) and zones in which the ritual is performed.
The size of the boxes represents the density in each group (the number of individuals per square meter). In our simulation, this is represented by the height of the boxes. Note that in our DOE a high density represents the situation in which 6 individuals share 1 square metre. Depending on the phase of the ritual the groups are performing, some zones of the mosque are more crowded than others.
As shown in Figure 5 we could simulate the groups participating in the Hajj in a realistic manner concerning: (i) the number of individuals in the crowd, (ii) the distribution of their anthropometric (coded in the colour of the box according to the colour code explained above) and sociocultural characteristics used to compute density which is visible in the size of the boxes in Figure 5. Note that depending on the group they belong to, pilgrims pray in different sections of the mosque. For example, Arabs in cyan are grouped together in the second level; Iranians are grouped in the first and third levels; and Indonesians, Malaysians and Africans mostly share the fourth level.
Then, it was important to model the dynamic aspect of the pilgrimage based on the predefined ritual performed through the spaces and tunnels of the mosque. In our current DOE we simulated a simplified version of the itinerary because for the time being we wanted the asses that our simulation could exhibit the “risky” places (e.g., tight tunnels and entrances).
Figure 6 shows the simulation results of the crowd trying to cross the different zones of the mosque. We show results of the first level which is occupied by Iranians (green points) and Indonesians (blue points). In the top of Figure 6 Iranians are in a kind of initial state and Indonesians are already moving in the surrounding tunnel and occupying the main “patio”.
In a second moment, in the middle figure, the Iranian crowd starts to organize itself to gain one of the two exits and reach the tunnel. Since the flow has a direction in fact they can only use the right-side exit. The middle and bottom of the Figure 6 sequence show how they organize to reach and go through the exit. First they go to the centre of the space then they gather themselves together in some point of the room while others approach the exit and start walking through the tunnel. At the same time, Indonesians (blue points) start moving towards the only exit in the right side of the square. Some gather themselves in the inner tunnel around the “patio” and the others in start going through the main tunnel.
We used this kind of sequences in our simulation to understand the collective behaviour of different groups. We were particularly interested in the way they behaved when they faced “delicate” facilities, for example tight entrances, or halls, tunnels or other important points where people tend to stop and the flow stalls. These critical aspects can help to determine the situations and possible humanitarian logistics problems to face in emergency situations and particularly avoid stampedes and crushes in a group that is larger than a million Muslim pilgrims.
Figure 7 shows the result of the simulation we conducted to measure the speed in which agents simulating pilgrims could run across the tunnels of the mosque. We decided to choose the last part of the itinerary where pilgrims must go through the tunnels. To give a simple example, Figure 7 illustrates the case of Indonesian pilgrims. The objective of this simulation was to identify places where there could be potential crushes or stampedes.

Note that the complex urban distribution of the mosque and the itinerary encouraging people to walk at different paces, and looking for spaces to accomplish all the phases of the ritual, creates potentially risky zones. People doing different phases of the ritual might find themselves going in opposite directions in tight tunnels.
Other might want to access specific points without considering the density of the crowd and cause problems. Not respecting (or understanding) instructions, directions and signs can be fatal in such a complex layout. For the time being our work does not address specific recommendations, since this concerns our future work. As discussed in Section 2 other groups like Helbing’s have addressed the recommendation dimension with general urban rules based on the behaviour models they came up with. Still simulations in 3D environments that model both the behaviour of each agent including her sociocultural and anthropomorphic features and the dynamic aspect to the behaviour are open issues.
5 Conclusions and Future Work
This paper uses an agent based approach for modelling and simulating dynamic human crowds but it introduces the use of specific anthropometric and sociocultural aspects that have an impact on individual and group behaviour. Different to existing models that focus on the flow dynamics of individuals in specific spaces and therefore provide a partial abstraction of individuals, our approach includes anthropometric and sociocultural aspects because: (i) we aim to address human logistics in which modelling both the urban space and the individuals of the crowds is important to predict and prevent catastrophes; (ii) we use virtual worlds to visualize the simulations of dynamic crowds in public spaces. To make virtual worlds realistic in big and fine grain it is important to reproduce avatar (i.e., agent) diversity considering both their physical characteristics and their behaviour. The challenge is to reproduce realistic behaviours of the individuals interacting among each other and evolving in the space, but also of the social groups identified within the dynamic crowd and the dynamic crowd considered as an indivisible entity.
The relevance of this research is that it derives a behavioural model of the dynamics of the crowds from empirical observation so this simulation will help to prevent crisis scenarios. Using and supporting simulations and visualization by efficient and ad-hoc data management makes it possible to address real time dynamic crowd observation and organization.
Decision making can consider the state of the dynamic crowd, the way it occupies space and the way individuals form or leave groups. With new technology, it might be possible to configure and reconfigure urban spaces dynamically to prevent disasters and to help people to behave safely in collective events. These issues are part of our future work. Our future research will also seek to further identify the critical behaviour of an individual depending on the group she belongs to and its characteristics. We also want to determine how to prevent the death of people through proper and efficient decision making processes using optimal humanitarian logistics.

