


 nueva página del texto (beta)
 Inglés (pdf)
 Artículo en XML
 Referencias del artículo
 Enviar artículo por email
 Citado por SciELO
  Similares en
SciELO
Similares en
SciELO 
 Permalink
1. Introduction
Water resources management and planning around the world have become a challenging task due to uncertainties in the impacts of climate change on regions suffering from water scarcity (Aeschbach-Hertig and Gleeson, 2012; Molina-Navarro et al., 2016). In arid and semiarid zones that face high interannual rainfall variability and freshwater scarcity, which are commonly associated with extreme events such as floods and droughts, sustainable water use becomes critical. Climate change can be caused by many natural and anthropogenic processes (NRC, 2010). Human influence on the climate system has been proven to be dominated by recent anthropogenic emissions of greenhouse gases which have peaked at their highest levels in the last 800 ky (Core Writing Team IPCC, 2014). Several studies have focused on the potential impacts of climate change on water resources (Herrera-Pantoja and Hiscock, 2015; Molina-Navarro et al., 2016), including groundwater resources (Candela et al., 2012; Lemieux et al., 2015; Samper et al., 2015).
The watershed Cuenca Independencia is situated in northern Guanajuato State with an area of 6992 km2. Groundwater scarcity has been created by over-extraction to meet the increasing demands from agricultural irrigation (CEAG, 2014). Since the 1970s, more than 1000 wells have been drilled within the Cuenca Independencia and the annual groundwater extraction volume now expanded by as much as 4 times of that at the end of 20th century (Navarro De León, 2006), resulting in water table drawdown at annual rates of 1-3 m during the last 20 years (CEAG, 2014). The semi-arid climate is dominated by strongly seasonal rainfall between May and October with mostly afternoon thunderstorms with annual precipitation of about 600 mm (Mahlknecht et al., 2004). With the impact of El Niño-Southern Oscillation (ENSO), the recorded variability in extreme precipitation events, including both heavy rainfall and droughts, was connected to both ENSO (Ropelewski and Halpert, 1986) and the Atlantic Multidecadal Oscillation (AMO) (Curtis, 2008; Barrett and Esquivel, 2013).
In Mexico’s Central Highland, declining rain-fall, increasing temperature, decreasing lake levels and rising population have been the norm during the past decades (Orozco-Ramírez and Astier, 2017). Annual maximum temperature trends have been investigated, and it has a significant increase in most of the ten Mexican watersheds, including Laja and Lerma-Salamanca (Mateos et al., 2016). The daily temperature range exhibits an increasing trend, implying an increase in temperature extremes. Land-use and land-cover changes could be the main drivers of climate change in Mexico’s Central Highland (Mateos et al., 2016). However, although land use change may influence the hydrological regime in a more identifiable way, in some sub-basins, the future climate change will tend to affect the hydrological regimes much more prominently than land use changes (Zhang et al., 2016). According to the report of IPCC (2014), the average surface temperature and precipitation were predicted to increase 3 - 4 °C and decrease approximately 10 mm, respectively, during the future period of 2081 - 2100 compared to the current period. Projected climate change scenarios predict that increasing temperature and declining annual precipitation would result in a reduction of up to 9 % in groundwater recharge and runoff by the end of this century in Queretaro, a neighboring state of Guanajuato, with likely more severe and frequent dry and wet events (Herrera-Pantoja and Hiscock, 2015). In the north part of the Lerma-Chapala basin (mainly located in the north of Guanajuato State), surface runoff was predicted to decrease by up to 29 % and is likely to have more frequent droughts by the end of the century (Acosta and Martínez, 2014).
The Soil and Water Assessment Tool (SWAT) model is one of the most widely used semi-distributed hydrological models and has been successfully applied to simulate seasonal water and pollutant exports from watersheds in mountains, plains, and coastal areas of the USA and other countries around the world, across a range of spatial scales (Nie et al., 2012; Heo et al., 2015; Maier and Dietrich, 2016; Marek et al., 2016). Some sub-basins in Mexico have been studied, such as the upper San Pedro watershed (Nie et al., 2012), Guadalupe River basin (Molina-Navarro et al., 2016), lake Chapala (Bautista-Avalos et al., 2014), southwestern Mexico City (Jujnovsky et al., 2012), and even in the Cuenca Independencia (Torres-Benites et al., 2005). However, the last study presented the annual simulation with SWAT for the Cuenca Independencia and didn’t report detailed information about the seasonal nor spatial distribution of water resources in this area. For a detailed hydrogeological and reactive transport model, we need detailed spatial and temporal distribution of recharge to the aquifer of the area. Therefore, more work is needed to evaluate the water budgets in shorter time intervals and assess the effects of potential future climate change on water resources in the Cuenca Independencia. Furthermore, analyzing future water resources is fundamental for the successful administration of water supplies.
2. Methods and materials
2.1. Study area
The Cuenca Independencia is located in the central Mexico Highlands with a drainage area of 6992 km2 based on the digital elevation model (DEM) provided by National Institute of Statistics and Geography (Instituto Nacional de Estadística y Geografía, INEGI, Mexico, 2019). Terrain elevation ranges from 1808 to 2990 m.a.s.l. (meters above sea level) with an average value of 2120 m.a.s.l. This basin includes several main municipalities such as San Miguel de Allende, Dolores Hidalgo, San Felipe, San Diego de la Unión, San Luis de la Paz, Dr. Mora, and San José Iturbide (Figure 1).
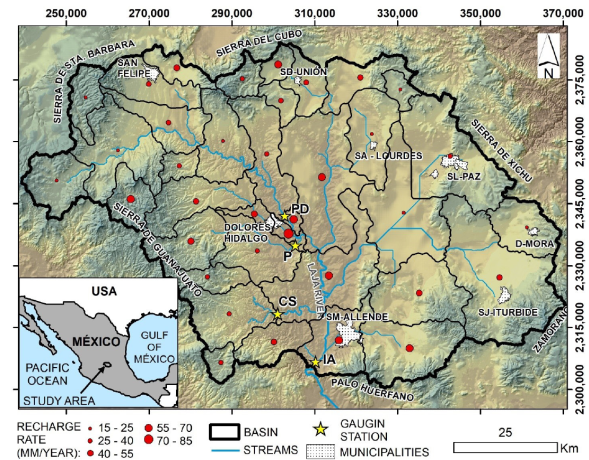
Figure 1 Study area in central-north Guanajuato State and mean annual recharge rates for sub-basins. PD: Puente Dolores, CS: Cinco Señores, P: Pañuelitas, IA: Ignacio Allende.
Overall, the climate of the Cuenca Independencia is semiarid and the rainfall is not evenly distributed over time nor space. Typically, three climate regimes predominate in this research area: (1) in the south and southwest of the Sierra de Guanajuato a warm climate prevails with high mean annual precipitation of approximately 800 mm near the mountainous areas; (2) the Sierra de Guanajuato (west of the basin) and Sierra de San José Iturbide (east of the basin) are sub-humid; and (3) in the lower parts of the north and east of Cuenca Independencia the climate is dry. Summertime precipitation is largely generated through interactions between the varied topography and atmospheric circulation cells associated with the North American Monsoon: humid air coming from the Pacific Ocean, as well as the irregular passage of tropical cyclone remnants (Douglas et al., 1993). The annual mean temperature is 16 °C, ranging from 9 to 25 °C. Potential evapotranspiration was estimated to be more than 1500 mm/y (Navarro De León et al., 2005; Barrett and Esquivel Longoria, 2013).
The study area is an intermountain sedimentary basin with complex geology (Aranda-Gómez et al., 2003), filled by Paleogene and Neogene to Quaternary sediments covered by phaeozems and vertisols, while the mountain areas are composed of Paleogene and Neogene felsic volcanic rocks or Cretaceous and Jurassic rocks. The recent alluvial deposits occupy a great superficial extension and they constitute the cover of vegetal soil in all the valleys with reducing thickness. The Laja River, originating in the sierras of Guanajuato and San Felipe, is the main stream in the basin. It flows SE towards the San Miguel de Allende reservoir, passing through Dolores Hidalgo as well as San Miguel de Allende. The main stem is 100 km in length while the branches are approximately 80 km in length. Two important tributaries also originate from the east Guanajuato sierra towards the east and flow to the dams built at the outlets before flowing into the Laja River. The sediments of the Laja River are constituted by granules with small sizes, indicating high permeability of the Laja River, which has been verified by a field Vertical Electrical Sampling test (Li et al., 2016).
2.2 Description of swat model
The Soil and Water Assessment Tool (SWAT) model is a continuous, long-term, physically based semi-distributed model, and it is developed to evaluate the impacts of climate and land management on hydrological processes, sediment loading, and pollution transport in watersheds (Arnold et al., 1998). In the SWAT model, a watershed is divided into sub-basins, which are further partitioned into a series of hydrological response units (HRUs). HRUs are uniform units that share unique combinations of soil and land use. Hydrological components, sediment yield, and nutrient cycles are simulated for each HRU and then aggregated for the sub-basins. The hydrological cycle simulated in SWAT is based on the water balance equation:
where, SW t and SW 0 are the final and initial soil water content on day i (mm H2O), t the time steps on day i, R day is the rainfall that reaches the soil surface on day i (mm), Q surf is the surface runoff on day i (mm), E a is the evapotranspiration on day i (mm), w seep is the interflow on day i (mm), and Q gw is the baseflow on day i (mm) (Neitsch et al., 2011). SWAT uses the Natural Resources Soil Conservation Service curve number (NRSCS-CN) and the Hargreaves method to estimate runoff and evapotranspiration respectively. The Hargreaves method was originally derived from eight years of cool season Alta fescue grass lysimeter data from Davis, California and the form used in SWAT was published in 1985 (Hargreaves and Samani, 1985):
where λ is the latent heat of vaporization (MJ/kg), E 0 is the potential evapotranspiration (mm/d), H 0 is the extraterrestrial radiation [MJ/(m2d)], T mx is the maximum air temperature for a given day (°C), T mn is the minimum air temperature for a given day (°C), and T av is the mean air temperature for a given day (°C).
2.3. Input data for SWAT
In this study, the ArcGIS interface for SWAT, ArcSWAT (version 2012), was used for catchment modeling. The DEM data were in a resolution of 15 × 15 m, shown in Figure 1. The soil map was downloaded from Harmonized World Soil Database version 1.2 with a resolution of 1 km (Fischer et al., 2008). Three kinds of soil were found in this study area, Haplic Phaeozems, Petric Calcisols (CLp) and Haplic Calcisols, where Haplic Phaeozems (53.4 %) and CLp (43.4 %) are the most abundant. Soil parameters were transformed from the FAO-90 into USDA standards and soil properties required by SWAT model were calculated using the software SPAW (2019) (Soil-Plant-Air-Water Field & Pond Hydrology, version 6.02.75, USDA, https://data.nal.usda.gov/dataset/soil-plant-atmosphere-water-field-pond-hydrology) with soil equations defined by Saxton and Rawls (2006). A land use coverage map was provided by Institute of Ecology of the State of Guanajuato (Instituto de Ecología del Estado de Guanajuato, 2014), with temporary agriculture, pasture, and irrigated agriculture occupying 26.15 %, 25.70 %, and 17.17 %, respectively. The slope was divided into 2 classes: 0 - 20 % and >20 %.
Daily meteorological data were obtained from National Meteorological Service (Servicio Meteorológico Nacional, SMN, 2019), Mexico with precipitation, T mx, and T mn. Hydrological gauging data from National Commission of Water (Comisión Nacional del agua, CONAGUA, 2018), with 2 stream-gauging stations-Puente Dolores and Cinco Señores-and 2 reservoir-storage monitoring stations-Pañuelitas and Ignacio Allende (shown in Figure 1)-were found with different periods. As to reservoirs, information was obtained from Seguí (2003) and CONAGUA (2015a, 2015b, 2015c). Due to the lack of sufficient data on reservoir operations, the reservoir data were set up with average annual release rates calculated automatically by the SWAT model. Dominant crops in this area are corn, wheat, beans, and alfalfa, which consumed around 90 % of the 412 hm3 ground-water annual volume in the 1970s according to a Ministry of Agriculture and Hydraulic Resources (Secretaría de Agricultura y Recursos Hidráulicos, SARH) report (CONAGUA, 2015a). Since it is hard to identify all the crops in the study area and alfalfa is the most common crop in the area, alfalfa is used as the irrigated crop to simulate the annual groundwater extraction for irrigation. Auto fertilization and auto irrigation were applied to this model. Irrigation water resources are directly from reservoirs nearby and wells with a water depth of around 100 m within its sub-basin. According to the rainfall pattern, there is less precipitation in the plains than in the mountainous. In the base model, the initial precipitation lapse rate (mean annual precipitation) was set to be 300 mm H2O/ km for the selected mountainous sub-basins in the west and 150 mm H2O/km in the east and the distribution in sub-basins is based on the statistical analysis of rainfall lapse rate and the gauged outlet.
To assess the likely impact of climate change on the Cuenca Independencia, daily data were downloaded from NASA Earth Exchange Global Daily Downscaled Projections (NEX-GDDP) dataset (2019), which is comprised of downscaled climate scenarios with spatial resolution of 0.25 degrees for the globe that are derived from the general circulation models (GCM) runs conducted using Coupled Model Intercomparison Project Phase 5 (CMIP5) and with two greenhouse gas emissions scenarios known as Representative Concentration Pathway (RCP), i.e. RCP 4.5 and RCP 8.5. Seven GCMs, listed in Table 1, were selected with downscaled projections for RCP 4.5 and RCP 8.5 from the 21 models and scenarios as to their representative characters. Precipitation, T mx, and T mn series in daily intervals have been extracted and processed for three 30-year periods: 1970-1999, 2030-2059, and 2070-2099, representing the historical baseline scenario, the midcentury scenario, and the end-of-this-century scenario, respectively. For the missing precipitation in the period of 2096-2099 for Geophysical Fluid Dynamics Laboratory - Climate Model Phase 3 (GFDL-CM3) in scenario RCP 4.5, the simulation period was replaced by 2070-2095 covering 26 years.
Table 1 Coupled Model Intercomparison Project Phase 5 (CMIP5) models and the performed centers.
| Model | Center | Country |
|---|---|---|
| BCC-CSM1.1 | Beijing Climate Center | China |
| CanESM2 | Canadian Centre for Climate Modelling and Analysis | Canada |
| CCSM4 | National Center for Atmospheric Research | USA |
| CNRM-CM5 | Centre National de Recherches Météorologiques, Centre Européen de Recherche et de Formation Avancée en Calcul Scientifique | France |
| CSIRO-MK3.6.0 | Commonwealth Scientific and Industrial Research Organization/Queensland Climate Change Centre of Excellence | Australia |
| GFDL-CM3 | Geophysical Fluid Dynamics Laboratory | USA |
| MRI-CGCM3 | Meteorological Research Institute | Japan |
2.4. Model setup, calibration, validation, and sensitivity analysis
The geographic information system interface- ArcSWAT 2012-was used to set the parameters in the Cuenca Independencia model. The area was delineated into 36 sub-basins with manually defined outlets, and further delineated into 791 HRUs. Parameters of SWAT models were varied at different spatial levels: HRUs, sub-basins, and basin. Since sub-catchments may have different basin characteristics, assigning the same basin parameter values to the whole basin may limit the calibration process. To allow each sub-catchment to have its specific basin parameter values to avoid calibration-process limiting, sub-basins were calibrated individually. Calibration and uncertainty analyses were performed by SWAT Calibration and Uncertainty Programs (SWAT‐CUP) Version 5.5.6 (EAWAG, 2015) with the assembled module semi-automated Sequential Uncertainty Fitting (SUFI2, 2019) algorithm. SUFI2 uses a global search procedure through Latin Hypercube sampling And it estimated optimal parameter ranges and global sensitivity analyses for simulating the outputs for consecutive iterations. SUFI2 varies the model parameters with a predetermined range until the model output best matches the observed data. This approach has the advantage of fewer model runs to achieve a satisfactory solution compared to other uncertainty analysis techniques, which makes it an attractive method, as the direct measurement of model parameters describing physical systems is often time-consuming, expensive, and potentially error ridden (Ficklin et al., 2013). The SUFI2 method provided more reasonable and balanced predictive results than the other two methods (GLUE and ParaSol) assembled in the SWAT-CUP module (Wu and Chen, 2015).
Model performance can also be evaluated by different statistical criteria to compare simulated and measured data. The coefficient of determination (R 2) and Nash-Sutcliffe Efficiency (NSE) objective functions are the two most commonly reported approaches in the literature (e.g.Moriasi et al., 2007; Arnold et al., 2012;). R 2 indicates the strength of the linear relationship between the observed and simulated values, ranging from 0 to 1 with 1 indicating a perfect match. NSE is a normalized statistic that determines the relative magnitude of the residual variance (“noise”) compared to the measured data variance (“information”) (Nash and Sutcliffe, 1970). NSE indicates how well the plot of observed versus simulated data fits the 1:1 line. It ranges between -∞ and 1, with NSE = 1 being the optimal value. The model performance is considered satisfactory when R 2 and NSE are greater than 0.5 for streamflow (Moriasi et al., 2007). Percent bias (PBIAS), underestimating the average tendency of the calibrated data to be larger or smaller than the observed data, is used as an indicator of model performance (Gupta et al., 1999). The optimal value is zero for accurate model prediction, where low absolute values indicate better simulations. At monthly time steps, a PBIAS less than 25 % for stream flow after calibration is considered satisfactory (Moriasi et al., 2007). General information about assessment criteria is listed in Table 2 (Moriasi et al., 2007; Rocha et al., 2015). And the statistical results of the calibrated model are listed in Table 3.
Table 2 General performance ratings for statistical methods. NSE: Nash-Sutcliffe Efficiency; PBIAS: percent bias; R2: coefficient of determination.
| Performance rating | NSE | PBIAS % | R 2 |
|---|---|---|---|
| Very good | >0.75 | < ±10 | >0.75 |
| Good | 0.65 ~ 0.75 | ±10 ~ ±15 | 0.65 ~ 0.75 |
| Satisfactory | 0.50 ~ 0.65 | ±15 ~ ±25 | 0.50 ~ 0.65 |
| Unsatisfactory | ≤ 0.50 | ≥ ±25 | ≤ 0.50 |
Table 3 Calibration and validation statistics at the outputs of Cuenca Independencia. NSE: Nash-Sutcliffe Efficiency; PBIAS: percent bias; R2: coefficient of determination.
| Outlet | Simulation Period | NSE | R2 | PBIAS% |
|---|---|---|---|---|
| Puente Dolores | Calibration for 1975-1993 | 0.69 | 0.72 | -7.8 |
| Validation for 2000-2011 | 0.65 | 0.66 | -18.6 | |
| Pañuelitas | Calibration for 1963-1975 | 0.84 | 0.84 | -3.8 |
| Validation for 1980-1990 | 0.73 | 0.74 | -16.2 | |
| Cinco Señores | Calibration for 1963-1985 | 0.8 | 0.81 | -2.5 |
| Validation for 1986-1993 | 0.78 | 0.78 | -9.1 | |
| Ignacio Allende | Calibration for 1969-1990 | 0.88 | 0.89 | -19.4 |
| Validation for 1991-1999 | 0.78 | 0.82 | -20.9 |
A sensitivity analysis for the 15 hydrological parameters listed in Table 4, was performed following the whole calibration period for 1000 simulations using the global sensitivity analysis by SWAT-CUP. Parameter sensitivities are determined by calculating the t-stat and the p-value. In this analysis, the larger the absolute value of t-stat and the smaller the p-value, the more sensitive the parameter.
Table 4 List of parameters used for model calibration and sensitivity analysis by Sequential Uncertainty Fitting (SUFI2) in SWAT Calibration and Uncertainty Programs (SWAT-CUP).
| No. | Parameter | Min_value | Max_value | Fitted value | t-stat | p-value |
|---|---|---|---|---|---|---|
| 1 | Curve number for moisture condition Ⅱ, R__CN2.mgt | -0.5 | 0 | -0.43 ~ -0.03 | 5.25 | 0 |
| 2 | Soil available water capacity, R__SOL_AWC(..).sol | -0.5 | 0.5 | -0.05 ~ 0.46 | 3.17 | 0 |
| 3 | Saturated hydraulic conductivity for soil layers, R__SOL_K(..).sol | -0.5 | 0.5 | -0.31 ~ 0.40 | 3.57 | 0 |
| 4 | Depth from soil surface to bottom of layer, R__SOL_Z(..).sol | -0.5 | 0.5 | -0.46 ~ 0.15 | 2.34 | 0.02 |
| 5 | Manning’s n value for the main channel, R__CH_N2.rte | -0.2 | 1 | -0.16 ~ 0.97 | -0.12 | 0.91 |
| 6 | Effective hydraulic conductivity in main channel, V__CH_K2.rte | 0 | 30 | 6.23 ~ 15.71 | -1.45 | 0.15 |
| 7 | Baseflow alpha factor, V__ALPHA_BF.gw | 0.2 | 0.95 | 0.2 ~ 0.79 | -0.06 | 0.95 |
| 8 | Ground water delay time, V__GW_DELAY.gw | 2 | 60 | 4~27 | 0.14 | 0.89 |
| 9 | Threshold water depth in the shallow aquifer for return flow, V__GWQMN.gw | 200 | 2000 | 360 ~ 802 | 2.62 | 0.01 |
| 10 | Groundwater ‘revap’ coefficient, V__GW_REVAP.gw | 0.02 | 0.2 | 0.02 ~ 0.18 | -1.67 | 0.1 |
| 11 | Deep aquifer percolation coefficient, R__RCHRG_DP.gw | -0.5 | 0.5 | -0.44 ~ 0.05 | -0.14 | 0.89 |
| 12 | Threshold depth of Water in the shallow aquifer for ‘revap’ or percolation to the deep aquifer to occur, V__REVAPMN.gw | 100 | 2000 | 243 ~ 1629 | -0.36 | 0.72 |
| 13 | Soil evaporation compensation factor, R__ESCO.hru | -0.5 | 0.5 | -0.49 ~ 0.26 | -1 | 0.32 |
| 14 | Plant uptake compensation factor, R__EPCO.hru | -0.3 | 0 | -0.26 ~ -0.17 | -0.54 | 0.59 |
| 15 | Precipitation lapse rate, R__PLAPS.sub | -0.5 | 0.5 | -0.12 ~ 0.15 | -0.56 | 0.58 |
*: R_ represents the existing parameter value is multiplied by (1 + a given value) while V_ means the parameter is replaced by a given value.
3. Results and discussion
3.1. Calibration and sensitivity analysis
A warm-up period of 2 years was executed for the model prior simulation. During model calibration, hydrological parameters were varied within referenced ranges to match the simulated and observed streamflows (Shrestha et al., 2016; Maliehe and Mulungu, 2017). The comparison between the best simulated and observed monthly streamflows for different periods of calibration and validation for these hydrologic stations is shown in Figure 2, and the statistical results are listed in Table 3. Generally, a good match can be seen between the simulated and observed values according to the reference criteria (Table 2). The calibrated parameter values are listed in Table 4.
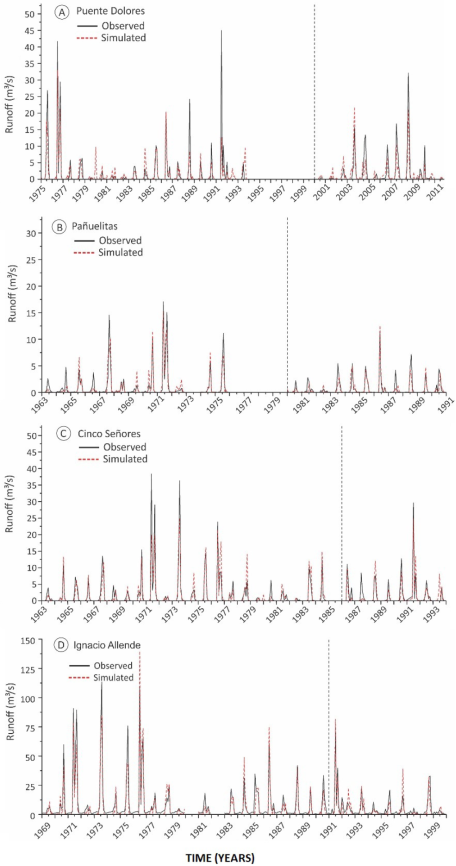
Figure 2 Comparison of monthly precipitation (Left) and average temperature (Right) between measured data and models for the period of 1970-1999. GCMs: general circulation models.
For the calibration of the northern part of the Cuenca Independencia, the evaluation of the SWAT model for monthly time steps is good. For the calibration period, the monthly NSE, R 2, and PBIAS at the outlet of Puente Dolores were 0.69, 0.72, and −7.80 %, respectively. For the validation period, the values were 0.65, 0.66, and −18.6 %, respectively. Very good level reproductions are obtained in the sub-catchment Cinco Señores, where the NSE values are greater than 0.75 for the calibration and validation periods. Furthermore, the PBIAS values are very good. In the neighboring sub-catchment, Pañuelitas, the match of the model is in very good level (Table 2) for NSE, R 2, and PBIAS for the calibration period, while the performance degrades in the validation period, especially PBIAS. After the calibration of the western and northern parts of the Cuenca Independencia, the eastern and southern parts were calibrated as a whole by the controlling outlet at Ignacio Allende. Very good results (Table 3) of NSE and R 2 were obtained for calibration and validation periods, but PBIAS criteria were only acceptable at a level of around −20.00 %.
As seen from the outlets at Cinco Señores and Ignacio Allende, the SWAT model performed better in the southern part of the Cuenca Independencia where topographic differences are smaller. Besides, the discrete blanks in precipitation series could lead to the inaccurate estimation of runoff by SWAT. Methods are needed to fill the blanks by interpolation between annual statistics obtained from neighboring weather stations. Precipitation in rainy seasons tends to come from afternoon thunderstorms. SWAT has difficulty modeling the effects of these high intensity precipitation events that are limited in duration and area. In spite of this shortcoming, SWAT produced reasonably accurate runoff estimations for the Cuenca Independencia.
A total of 15 potentially influential parameters were selected for optimization and sensitivity analyses (Table 4). They are mostly related to surface runoff and baseflow (Arnold et al., 2000, 2012). Natural Resources Soil Conservation Service Curve Number (CN2) is well known to be an extremely sensitive parameter. Other parameters showing high sensitivity were saturated hydraulic conductivity for soil layers (SOL_K), soil available water capacity (SOL_AWC), the threshold water depth in the shallow aquifer for return flow (GWQMN), and the depth from soil surface to bottom of layer (SOL_Z), which were followed by the groundwater “revap” coefficient (GW_REVAP). The SOL_K, despite being a soil parameter, has a connection with groundwater since it is an indicator for water moving through the soil layers, which will eventually reach the shallow aquifer below. The high sensitivity of SOL_K and GWQMN reveals that the ground-water system may play a vital role in the hydrology of the Cuenca Independencia with seasonal climate and Quaternary aquifers. The p-value of SOL_AWC, SOL_Z and the soil evaporation compensation factor (ESCO), which goes along with the importance of evaporation, indicates that evapotranspiration plays an important role in this semi-arid area as well. A similar sensitivity analysis of results has been found in other semi-arid catchments (Mosbahi et al., 2015; Solaymani and Gosain, 2015; Molina-Navarro et al., 2016). The initial and calibrated values of the adjusted parameters are given in Table 4. The baseflow alpha factor (ALPHA_BF) varies from 0.20 to 0.79 in the Cuenca Independencia, indicating that the response to recharge is spatially uneven. According to the theoretical documentation of SWAT (Neitsch et al., 2011), ALPHA_BF values vary from 0.1 to 0.3 for land with slow response to recharge, and up to 0.9 ~ 1.0 for lands with a rapid response. Briefly, the ALPHA_BF has an intermediate value in the northern part of the basin, and a low value in the catchment of Pañuelitas, while in the south and east parts of the Cuenca Independencia it has higher and similar values. This corresponds to the alluvial aquifers in this area. CH_K2 is set with the default value of 0 in the model, which is recommended to be increased in semi-arid areas in Mexico for water loss from stream beds (Nie et al., 2012; Molina-Navarro et al., 2016). The calibrated CH_K2 ranges from 6.23 to 15.71 mm/h, which corresponds to the gravel and sand bedded Laja River with good connection to the alluvial aquifer below (Li et al., 2016). CN2 was reduced in the whole basin, with a reduction of less than 10% in the north area and around 43 % in the south. The GWQMN reducing from the north to the south means that it is easier for groundwater to flow back to reach the southern zone.
3.2. Historical water budgets
After the calibration, the SWAT model was used to simulate the water pathways in the Cuenca Independencia for a 40-year historical period of 1970-2009 with updated parameters. The annual results of water pathways, as well as the average temperature, have been listed in Table 5. Precipitation is the main water source for the whole area with an average accumulated value of 495.1 ± 88.0 mm/y in this semi-arid area. The automatically extracted groundwater by the SWAT model supplements water input to satisfy the irrigation demand by commercial crops. Of this total volume of water that falls on the ground (rainfall and irrigation water from groundwater), about 5.8 % forms runoff and 6.8 % recharges the deep aquifer.
Table 5 Mean annual statistics of SWAT outputs for the period 1970-2009. ETM: Average temperature; PET: Potential Evapotranspiration; ET: Evapotranspiration; GW: Groundwater.
| Precipitation mm | ETM ⁰C | PET mm | ET mm | Runoff mm | Recharge mm | Extraction mm |
|---|---|---|---|---|---|---|
| 495.1 | 17.2 | 1670 | 471.3 | 33.38 | 39.08 | 81.76 |
The annual potential evapotranspiration (PET) is estimated to be 1670 mm/y, which is higher than the 1280 mm/y calculated by the Blaney-Criddle method (Blaney, 1959). Limitations in water availability cause the Evapotranspiration (ET) to have a much lower value. Therefore, the actual ET is estimated at 473.10 mm/y, which is higher than the Coutagne method (449.00 mm/y), but lower than the Turc’s method (518.00 mm/y) (Mahlknecht et al., 2004).
Annual surface runoff is about 33.38 mm/y, which is similar to a previous study by CEASG (1999) with the same US NRSCS runoff curve numbers. The annual deep aquifer recharge rate fluctuates with the annual precipitation with a mean value of 39.08 mm/y in this study, which is 3.36 mm/y or 7.9 % lower than the CONAGUA reports as listed in Table 6 (about 296.80 hm3/y, i.e., 42.44 mm/y). The recharge rate is higher in the western mountainous areas where the orographic effect causes more rain to fall (Figure 1). In the central plain zone and southern-eastern part, the high recharge rate could be attributed to agricultural irrigation activities where the main irrigating croplands are located. Besides, the high permeability of CLp soil would accelerate the water moving towards the alluvial shallow aquifer after rainfall events. As reported in a chloride mass balance study by Mahlknecht et al. (2004), the recharge rate peaks in the western and southern mountainous areas with values over 100.00 mm/y while in the northern part it’s less than 50.00 mm/y. In this study, the distribution of the recharge rate has a similar tendency as Mahlknecht et al. (2004) found, but our SWAT model suggests that higher recharge rates can be found in the central alluvial plain.
Table 6 Statistical variations of groundwater resources in the Cuenca Independencia in 2014 (hm3/y). CONAGUA: National Commission of Water of Mexico.
| Aquifer | Recharge | Allowed extraction | Extracted | Reference |
|---|---|---|---|---|
| Alta del Río Laja | 139.7 | 199 | 412 | (CONAGUA, 2015a) |
| Laguna Seca-Dr. Mora | 128.5 | 153.8 | 398 | (CONAGUA, 2015b) |
| San Miguel de Allende | 28.6 | 30.6 | 22.1 | (CONAGUA, 2015c) |
| Total | 296.8 | 383.4 | 832.1 |
The annual extracted groundwater predicted by the SWAT model was on average 81.46 mm, which corresponds to 571.72 hm3/y. Although the actual groundwater extraction was estimated to be less than 300.00 hm3/y in the 1970s, in 1992 the estimated extracted volume of groundwater was 520.53 hm3. CONAGUA (2015b) estimated a total of 487.8 hm3 for agricultural irrigation. The SWAT model over-estimated this by 6.7 %. The permitted groundwater extraction volume is approximately 383.4 hm3/y but the estimated case is about 832.10 hm3/y in 2014 (see Table 6). In consideration of the 90 % extracted groundwater consumed by agricultural irrigation, the current study underestimated groundwater extraction in this region by 23.8 %.
3.3. Meteorological projections
Projected average monthly precipitation and mean temperature for the historical baseline (1970-1999) of seven GCMs is shown in Figure 3. The GCMs projected similar annual trends to the observed meteorological data but varied between months. A decrease in simulated precipitation was generated in the dry season, from November to April; and more computed rainfall was recorded during the hot rainy season, generally. The variation between different GCM projections demonstrated that climate predictions were not uniform in the direction and magnitude of changes for both future study periods (2030-2059 and 2070-2099) (see in Figure 4). The seven GCMs individually predicted similar precipitation variation tendencies, compared with their historical baselines, for the periods 2030- 2059 and 2070-2099 under the RCP 4.5 emission scenario. Meanwhile, less rainfall is expected to occur by the end of this century when compared with the middle period of this century. Generally, the mean annual precipitation would increase by 3.6 % and 0.6 % for the periods 2030-2059 and 2070-2099, respectively, separately under the condition of the RCP 4.5 emission scenario. Under the RCP 8.5 emission scenario, precipitation was projected to increase by 3.8 % and 3.4 % individually for the future periods 2030-2059 and 2070-2099, respectively, when compared to the historical baseline. Monthly precipitation is expected to increase significantly in May, June, September, and October, and slightly in August and November, while declining in January and July for all these different emission scenarios and periods. Unlike the fluctuating projection for precipitation, the mean temperature was projected to increase in all the conditions by these seven GCMs. The mean annual temperature tends to increase by 1.8 and 2.6 °C for the periods of 2030-2059 and 2070-2099, respectively, under RCP 4.5 emission scenario, while by 2.2 and 4.7 °C under RCP 8.5 emission scenario, separately.
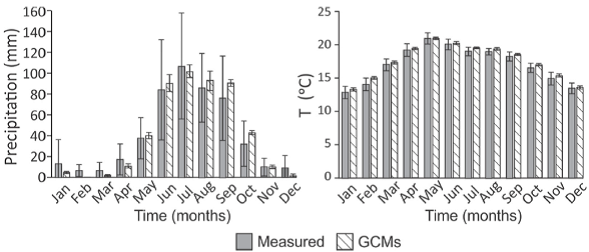
Figure 3 Comparison of monthly precipitation (Left) and average temperature (Right) between measured data and models for the period of 1970-1999. GCMs: general circulation models.

Figure 4 Average annual changes in precipitation (two of the above) and mean temperature (two of the below) from baseline for (2030-2059) (two of the left) and (2070-2099) (two of the right). RCP: Representative Concentration Pathway; BCC-CSM1.1: Beijing Climate Center Climate System Model, Version 1.1; CCSM4: Community Climate System Model Version 4; CSIRO-MK3.6.0: Commonwealth Scientific and Industrial Research Organisation Global Climate Model Mk 3.6.0; MRI-CGCM3: Meteorological Research Institute Community Climate System Model, version 3; CanESM2: Canadian Centre Earth System Model version 2; CNRM-CM5: French National Center for Meteorological Research Climate Model version 5; GFDL-CM3: Geophysical Fluid Dynamics Laboratory Climate Model version 3.
3.4. Hydrologic response to climate change
Notably the future projected precipitation varies with different emission scenarios, which is important for the water resources pathways in the Cuenca Independencia. Figure 5 illustrates the predicted relative changes of water budgets by SWAT for future climate change.
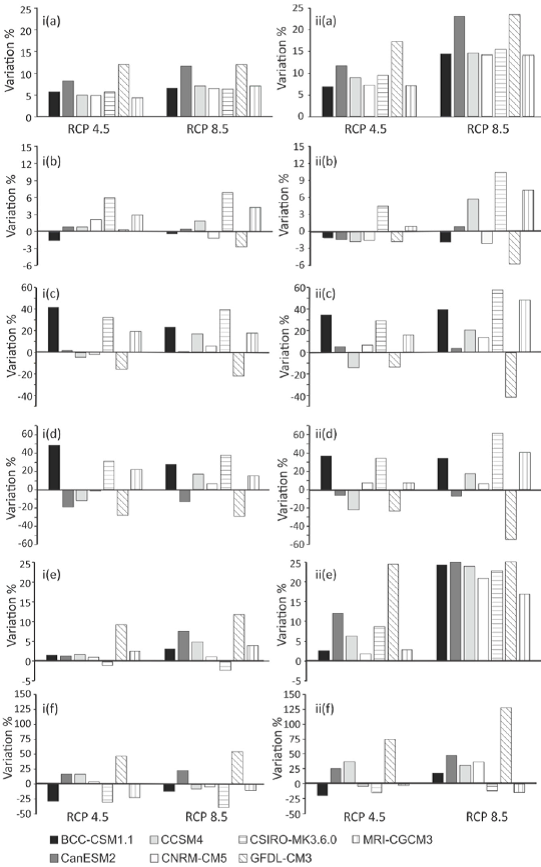
Figure 5 Average annual variations % from baseline in (a) PET, (b) ET, (c) surface runoff, (d) recharge, (e) groundwater extraction, and (f) aquifer deficit from baseline for (i) (2030-2059), and (ii) (2070-2099) in RCP 4.5 and RCP 8.5 climate change scenarios given by seven general circulation models (GCM) (see Figure 4 for the definition).
Average monthly PET showed increasing trends for all months under projections of climate change (shown in Figure 5(a)), especially for the RCP 8.5 emission scenario when compared to the baseline scenario. It is estimated that annual PET is increasing for all conditions, which can be attributed to the projected increasing temperature as shown previously. On average, annual PET would increase by 6.7 % and 9.9 % for the periods of 2030-2059 and 2070-2099, respectively, under the RCP 4.5 emission scenarios, while by 8.3% and 17.1%, respectively, under the condition of RCP 8.5 emission scenario. Real ET is not always increasing as the PET, but estimated to decrease in some GCMs’ projections. In the case of the BCC-CSM 1.1 model, ET is estimated to be reduced under all conditions. ET tends to stay consistent with the variations of precipitation, which can be seen from the CSIRO-MK 3.6.0 and MRI-CGCM3 predictions. Under the condition of the RCP 4.5 emission scenario, ET tends to increase from 2030 to 2059 and to decrease from 2017 to 2099 for most models. While under the condition of the RCP 8.5 emission scenario, the estimated ET of all the GCMs has a similar tendency in both periods, either to increase or to decline. Besides, the tendency is more noticeable between 2070 and 2099. Statistically, real ET tends to increase by 1.6 % and 1.3 % between 2030 and 2059 under the emission scenarios of RCP 4.5 and RCP 8.5, respectively. There will be a slight reduction of ET (−0.4 %) between 2070 and 2099 under the RCP 4.5 emission scenario and an increment of 2.1 % will occur under the emission scenario of RCP 8.5. The reason is that, in the RCP 4.5 emission scenario, there is less CO2 emission in the period 2079-2099.
As generated from precipitation, surface runoff has a similar tendency of precipitation events in most GCMs such as BCC-CSM 1.1, CCSM4, CSIRO-MK 3.6.0, GFDL-CM3, and MRI-CGCM 3. The variations of surface runoff are proportionally higher in these models when compared with the corresponding variations of precipitation for a shorter but more intense rainfall pattern. In general, surface runoff is estimated to increase by 10.5 % and 9.2 % in the mid-century and at the end of this century, respectively, under the RCP 4.5 emission scenario. A higher increase of surface runoff is predicted under the RCP 8.5 emission scenario with values of 11.8 % and 20.2 % for those two periods, respectively. Deep aquifer recharge has similar variations to runoff. As predicted by BCC-CSM 1.1, CSIRO-MK 3.6.0, and MRI-CGCM 3, the recharge will increase by 7.3 % - 61.5 % under conditions of future climate change, while it is simulated with a reduction of 6.3 % - 54.5 % by CanESM 2 and GFDL-CM3. The average mean annual recharge is simulated to increase by 6.0 % and 4.8 % in the periods of 2030 - 2059 and 2070 - 2099, respectively, under the RCP 4.5 emission scenario, while increasing by higher variations of 8.9 % and 14.1 % in the same periods, respectively, under the RCP 8.5 emission scenario.
However, significant increasing of groundwater demands for agricultural irrigation is predicted by these GCMs except for the conditions of CSIRO-MK 3.6.0 in the mid-century, which projected 14.5 % and 17.3 % increments of precipitation under emission scenarios of RCP 4.5 and RCP 8.5, respectively, but just 6 % increasing of PET. By the end of this century, there will be sharp growing demands of groundwater extraction under the current agricultural management framework, especially under the condition of the RCP 8.5 emission scenario. Overall, mean annual groundwater extraction, compared with the base-line, has been predicted to increase by 2.3 % and 4.3 % in the periods of 2030-2059 and 2070- 2099 under emission scenarios of RCP 4.5, and 8.4 %, and 24.2 % in the two period under RCP 8.5, respectively. By examining the gaps between the annual groundwater extraction and deep aquifer recharge (i.e., aquifer deficit), there is no chance for the recovery of the overexploited deep aquifer under the current status of water resources management. Responding to the potential future climate change, the drawdown in the deep aquifer is accelerating at the end of this century.
4. Conclusions
In this manuscript, a SWAT model was developed for the Cuenca Independencia from the northern-central of the Mexico Highland, Guanajuato State, where 36 sub-basins were calibrated individually with two reservoir storage files and calibrated with the aid of SUFI-2 algorithm assembled in SWAT-CUP. Good to very-good results were obtained during both the calibration and the validation periods, while the PBIAS was not at the level of the former indicators but with satisfactory to very-good results. CN2, SOL_K, SOL_AWC, GWQMN, and SOL_Z were found to be five sensitive parameters in descending order in the Cuenca Independencia model. After calibration and sensitivity analysis, the 40 years between 1970 and 2009 has been simulated by SWAT with updated parameters.
Potential climate change conditions were examined under RCP 4.5 and RCP 8.5 emission scenarios for the mid-century (2030-2059) and the end of this century (2070-2099) by seven GCMs under CMIP5. The results vary a lot because the seven GCMs are built by different investigation groups in several countries. They use different equations and consider different weights for the basic hydrologic and human activity factors. Each model has its reason partially, so the mean values of the seven GCMs are considered useful to understand the possible effect of climate change on the aquifer in the future.
Analyzing the results, we conclude that BCC-CSM 1.1 and CSIRO-MK 3.6.0 are very optimistic to consider ET or groundwater extraction decreasing in the future, separately, while GFDL-CM 3 is very pessimistic considering groundwater extraction. That’s a human effect, increasing rapidly in the future. CO2 emission has a high weight in models CCSM 4 and CNRM-CM 5, especially in the former, for parts of the variation results are changing from positive to negative or vice versa between RCP 4.5 and RCP 8.5.
It has been projected that the Cuenca Independencia may experience higher precipitation and temperature under all emission scenarios for both periods, compared to the baseline condition (1970-1999). PET was estimated to increase continuously while ET is to increase at lower rates. Both mean annual surface runoff and deep aquifer recharge was simulated to increase more rapidly under the condition of scenario RCP 8.5 than that of RCP 4.5. Under emission scenario RCP 4.5, the increasing rates of surface runoff and deep aquifer recharge will slow down at the end of this century when compared to the mid-century rates. However, the estimated increasing demands of groundwater exploitation for agricultural irrigation would neutralize the water seeping into the groundwater system, making it hopeless for aquifer recovery through natural processes under the current water resources management frame-work. Thus, more work and practice are needed to understand the hydrologic dynamics towards sustainable management of water resources in this semi-arid area in response to the overexploitation and potential impacts induced by climate change.

