


 nueva página del texto (beta)
 Inglés (pdf)
 Artículo en XML
 Referencias del artículo
 Enviar artículo por email
 Citado por SciELO
  Similares en
SciELO
Similares en
SciELO 
 Permalink
1. Introduction
Lakes are important sentinels and integrators of the effects of climate and environmental change (Schindler, 2009), and lacustrine sediments are natural archives of these past changes. Stratigraphic analysis of biological and non-biological indicators in lacustrine sediment cores provides information on direct and indirect climate-lake interactions in the past (Fritz, 1996).
Most lakes in the northern Neotropics originated during the early Holocene, ~10000 years ago, when temperature and precipitation increased. A few water bodies, however, are much older and were shown to have consistently held water during the late Pleistocene, e.g. Lake Chalco in central Mexico (~500000 years) (Brown et al., 2012) and Lake Petén Itzá in northern Guatemala (~400000 years) (Kutterolf et al., 2016). Recovery of such long sedimentary sequences requires specialized equipment and personnel, which are generally expensive (Dean, 2010).
Therefore, basin surveys need to be conducted prior to drilling operations for a careful planning and an efficient use of the drilling budget, even for smaller scale projects (Cohen, 2003). Essential data comprises but is not limited to sediment thickness and composition, depth to bedrock and possible heterogeneities within the lake sediments (Last and Smol, 2001). Ideally, these parameters are available on the lake-basin scale to allow a well-founded selection of the drilling site. However, even smaller-scale information on the subsurface conditions in the vicinity of the selected site can aid drilling operations. If no data is available from collocated boreholes, geophysical methods are an efficient alternative to gain information on the subsurface (e.g. Telford et al., 1990). A great advantage of most geophysical exploration methods is that they are non-invasive, relatively low-cost and able to quickly provide quantitative results.
While a wide range of applied geophysical methods exists for near-surface studies, seismic reflection methods are most widely used to assist the planning and execution of drilling projects for paleolimnological studies (e.g. Scholz, 2001). Due to the typically large contrast between the mechanical properties, i.e. seismic velocities and the bulk density, of the relatively soft lake sediments and the underlying hard bedrock, seismic reflection methods are particularly well-suited to map the depth of this lithological interface and the thickness of lake sediments. However, under certain circumstances, possibilities to carry out (active) seismic surveys might be limited or the quality of the seismic data might not be sufficient for the project’s purpose (e.g. Lozano-García et al., 2017). Amongst other, limiting factors can be (1) insufficient contrasts among the seismic velocities of geologic materials, (2) the presence of gas-charged lake-floor sediments that act as a strong reflector and mask underlying sediments (e.g. Davy, 1992) or (3) sources of natural and/or cultural noise in the study area. Particularly in densely populated urban areas, where e.g. ground traffic and industrial facilities might represent important sources of noise, the execution of seismic surveys might be challenging (e.g. Liberty, 2011). Furthermore, the use of explosives or large seismic sources, which are often used for land-seismic surveys might be restricted in urban areas and/or natural conservation zones often encountered in the vicinity of lakes.
In some cases, geoelectrical (e.g. Binley and Kemna, 2005) and electromagnetic (e.g. Kaufman et al., 2014) methods can be a suitable alternative to seismic surveys, gain complementary information, or reduce the uncertainty in the interpretation of seismic results. In order to make these techniques available to the broader community of paleolimnological researchers, in this paper we briefly introduce some of the most commonly used geoelectrical and electromagnetic methods. In particular, we present the basic relations between the electrical resistivity and the key petrophysical parameters of geologic materials. The electrical resistivity (i.e. the inverse of the electric conductivity) is the physical quantity retrieved from all three methods discussed in this paper, namely, Electrical Resistivity Tomography (ERT), Transient Electromagnetic (TEM) soundings, and Magnetotelluric (MT) soundings.
In order to evaluate the possibilities and limitations of these geophysical methods applied to paleolimnological studies we present two case histories from the Basin of Mexico. This research was in collaboration with scientists from the Institutes of Geology and Geophysics from the Universidad Nacional Autónoma de México (UNAM) as well as international cooperation partners. The first example presents the results of an ERT survey at the former Lake Xochimilco, with a maximum exploration depth of 100 m that was carried out prior to retrieving a 47 m sediment core. The second example presents the results of TEM and MT soundings from the vicinity of the International Continental Drilling Program (ICDP) site at the ancient Lake Chalco (Brown et al., 2012). Both study sites have a particular geological context, where lake sediments are in contact with different volcanic materials, such as basalt layers and thick pyroclastic deposits. These materials, which are typical for the Basin of Mexico, are characterized by sufficiently contrasting electric properties, which facilitates the success of this type of geophysical exploration. Furthermore, the availability of stratigraphic data from the collocated drilling at both sites allowed us to evaluate and discuss the potential of the applied geophysical methods.
2. Material and method
2.1. Electrical resistivity of geological media
Sediments and sedimentary rocks are composed of solid mineral grains of different size and the pore space between the grains, which is occupied by varying fractions of air and water. Except for rarer metallic minerals, most rock-forming minerals are poor electrical conductors and do not contribute significantly to the electrical conductivity of these media (e.g. Telford et al., 1990). Instead, the electric current is carried by ions dissolved in the pore water (electrolytic conduction) and even a thin film of water at the mineral surface of an interconnected pore network can increase the electrical conductivity by orders of magnitude. Consequently, in (partially) water saturated media the electric conductivity is directly proportional to the electrical conductivity of the pore water and increases with the porosity of the material (volume fraction of free pore space) and the water saturation. However, this empirical relationship, also known as “Archie’s law” (Archie, 1942), only holds for clay-free sediments. Generally, clay minerals have high cation exchange capacities leading to the build-up of electrical double layers at the water-mineral interface (e.g. Waxman and Smits, 1968). The resulting high excess ion concentration accumulated at the interface further increases the electrical conductivity of clay-bearing sediments. The connectivity between pores is typically low in metamorphic and igneous rock such as basalt but also decreases in sedimentary rocks with the degree of compaction and cementation of the sediments (e.g. Telford et al., 1990). Therefore, the electrical resistivity of hard rock is typically much higher than that of unconsolidated sediments and is only decreased by weathering and/or fracturing, which allow pore water to re-connect and carry electrical current.
In the application of geophysical methods for the characterization of sedimentary basins, the electrical resistivity will act as a “proxy” for those petrophysical properties it largely depends on, i.e. porosity, clay content, cementation/compaction, water saturation, and pore-water conductivity. While the first three properties are directly linked to lithology, and thus the measured resistivity offers an indirect access to stratigraphic information, varying water saturation and water conductivity can occasionally dominate the electrical response of the subsurface materials and mask lithological contacts.
2.2. Electrical resistivity tomography (ERT)
For geoelectrical measurements two electrodes are firmly attached to the surface in order to inject an electric current into the ground, while another pair of electrodes is used to measure the resulting voltage (Figure 1). The measured voltage varies with the geometrical configuration of the four electrodes but also depends on the electrical resistivity of the subsurface. From the voltage to current ratio and considering the geometric configuration of the electrodes, an apparent resistivity of the measurement can be calculated. For a homogeneous subsurface, this apparent resistivity is equal to the homogeneous electrical resistivity. However, in most cases, the electrical resistivity varies in the vertical and/or horizontal direction. In order to assess vertical resistivity variations, the distances between the electrodes can be increased stepwise, which allows the electrical current to penetrate increasingly larger depths. To determine lateral contacts only, the four-point measurement must be repeated at different positions along a profile maintaining fixed distances between the electrodes. For a tomographic measurement these two approaches are combined and typically hundreds of four-point measurements with varying electrode apertures are collected at different positions along the line (e.g. Binley and Kemna, 2005). Modern tomographic measurement systems automatically control hundreds of electrodes and measure thousands of four-point configurations. Depending on the survey objective, different geometric arrays are commonly used. Figure 1 illustrates three typically deployed electrode configurations known as dipole-dipole, Wenner, and pole-dipole array, employed in the first case study of this work. For the interpretation of the tomographic measurement, apparent resistivities need to be “inverted”. This task is realized by inversion algorithms, which adjust an approximate block model of electrical resistivities that reproduces the measured apparent resistivities within a certain margin of error. The results of this processing are 2D-sections of the electrical resistivity beneath the profile, which represent the spatial variation of the electrical resistivity in the subsurface.

Figure 1 a) Schematic representation of a geoelectrical four-point measurement; a direct current I is injected through a pair of electrodes and the resulting voltage V is measured between two other electrodes. The flow paths of the electrical current in the subsurface depend on the electrical resistivities ρ1, ρ2 of the stratigraphic units. b) Common electrode configurations: Wenner (top), dipole-dipole (centre), and pole-dipole (bottom) array.
2.3. Transient electromagnetic (TEM) soundings
Transient electromagnetic (TEM) soundings, also known as time-domain electromagnetic soundings, can be carried out in many different ways (e.g. Telford et al., 1990). For the most commonly applied TEM soundings an electric current is injected into a horizontal loop consisting of a simple cable extended on the terrain (Figure 2). The current carrying loop acts as a magnetic coil, which generates a primary magnetic field that extends into the subsurface. Then the transmitter current is abruptly interrupted causing the decay of the magnetic field, which by means of electromagnetic (EM) induction causes eddy currents to flow in the subsurface. Within milliseconds, the induced current system diffuses into the subsurface moving downwards and extending itself laterally. The temporal variation of this current system in turn generates a secondary magnetic field, the evolution of which can be measured at the surface. Typically, a smaller receiver coil does this, but it can also be realized with the transmitter loop itself (single-loop TEM), which reduces the effort in the field.
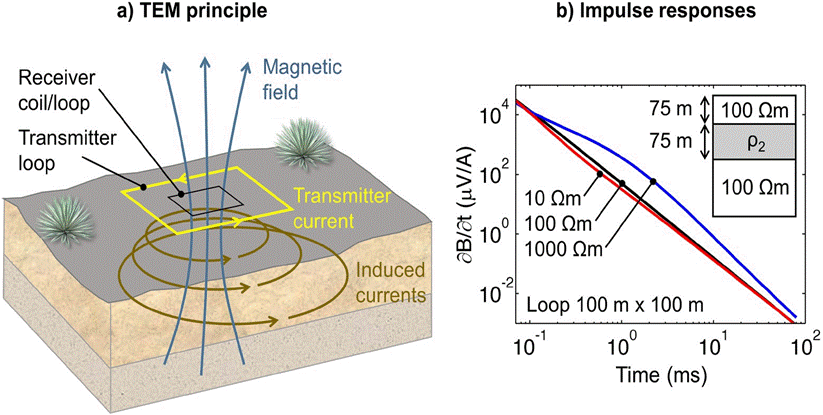
Figure 2 a) Schematic representation of an in-loop TEM sounding: A direct current is injected into the transmitter loop. After current shut-off, eddy currents are induced that diffuse into the subsurface. The receiver coil or loop placed in the centre of the transmitter loop detects the transient voltage induced by the decaying secondary magnetic field. b) Impulse responses (time derivative of the secondary magnetic field) for three different layered-earth models. The resistivities of the first and the last layer are fixed to 100 Ωm, the resistivity of the second layer ρ2 is 10 Ωm (red curve), 100 Ωm (black curve), and 1000 Ωm (blue curve).
Figure 2 shows the variation of the time derivative of the secondary magnetic field, also known as impulse response, for different simple layered-earth models. As the magnitude and the temporal evolution of the secondary magnetic field depend on the subsurface resistivity, TEM sounding data can be used to reconstruct the geometric distribution of stratigraphic units with different electrical properties. Similar to ERT measurements, the field data must be inverted in order to obtain resistivity models representing the subsurface materials.
Because the depth of the current system increases with time, but at the same time the signal strength decreases, the investigation depth of TEM soundings is largely determined by the effective signalto-noise (S/N) ratio of the measurement. The effective S/N ratio can either be increased by stacking (averaging) repeated measurements or by increasing the transmitter dipole moment, which is the product of injected current times loop area. Consequently, large loops (up to 500 m x 500 m square loops) are generally used for deep soundings and small loops (a few decimetres to meters) for shallow investigations. As a rule of thumb, the investigation depth of a TEM sounding is about 2-3 times the loop diameter.
2.4. Magnetotelluric soundings (MT)
Like the TEM method, the magnetotelluric (MT) method is based on the EM induction of electric currents in the subsurface. However, instead of using an active source, the MT method makes use of EM waves originating from ionospheric and magnetospheric currents, electrical storms and long-wave radio transmitters. The temporal variations of the magnetic components of these waves induce electrical currents in the subsurface, which in turn generate secondary magnetic fields. For MT soundings, the superposition of both primary and secondary magnetic field, as well as primary and secondary electric field, are measured at the surface. Figure 3 illustrates the setup of a typical MT station, including two electric dipoles that measure the two horizontal components of the electric field (Ex and Ey), as well as three magnetic induction coils for the measurement of the two horizontal (Hx and Hy) and the vertical (Hz) component of the magnetic field.

Figure 3 Schematic representation of the field setup for a MT sounding. Non-polarizing electrodes (yellowish cylinders) are used to measure the two electric field components Ex and Ey. Broadband magnetic induction coils (blue cylinders) measure the two horizontal components Hx and Hy of the magnetic field as well as its vertical component Hz. The acquisition unit collects the time-series data of all five electromagnetic field components.
The ratio of the electric to the perpendicular magnetic field is then used to compute the apparent resistivity. Together with the phase, which quantifies the temporal delay between the electric and magnetic component of the EM wave, the apparent resistivity describes the measured impedance at the MT sounding site. The penetration depth of an EM wave in a conducting medium (the subsurface) depends on the oscillation frequency of the wave. In order to relate the measured time-series of the magnetic and electric fields (Hx(t), Ey(t), etc.) to the resistivity variation in the subsurface, they are decomposed into the different frequency components of the incident EM wave. Again with the help of inverse modelling, the variations of the MT impedance (apparent resistivity and phase) with frequency are then used to reconstruct the variation of the electrical resistivity with depth. For a more comprehensive introduction to the ERT method and some recent developments, we refer to Telford et al. (1990) and Binley and Kemna (2005), respectively. The MT method and the TEM method are discussed in detail in Telford et al. (1990), and Kaufman et al. (2014). Christiansen et al. (2009) give a shorter but still comprehensive introduction to the TEM method.
3. Case studies in the Basin of Mexico
The Basin of Mexico (19°00’-20°00’N; 98°00’- 99°30’ W; 2200 m.a.s.l.) is an inter-montane basin of the Trans-Mexican Volcanic Belt. It is a continental arc formed since the Neogene, which continues to be active today (e.g. Gómez-Tuena et al., 2005; Ferrari et al., 2012). The formation of the Sierra Chichinautzin Volcanic Field since 1.2 Ma led to a hydrologic blockage in its southern part (e.g. Martin del Pozzo, 1982; Arce et al., 2013).
Subsequently, a lacustrine system developed and sediments were deposited with thicknesses of up to ~500 m in several parts of the basin (Arce et al., 2013), which preserve continuous records of the environmental history covering probably the last ~300000-500000 years (Herrera-Hernández, 2011; Brown et al., 2012). Due to continuous volcanic activity in the basin and its surroundings, lacustrine sediments are interbedded with proximal and distal fall explosive deposits (Ortega-Guerrero and Newton, 1998).
3.1. Case I: Shallow exploration at lake Xochimilco
3.1.1. Background
The sub-basin of Xochimilco (19°13’ N, 99°08’ W) occupies the south-western extreme of the Basin of Mexico. It has a total area of 480 km2, while the last persisting remnants of the lake are limited to the chinampas area of 16 km2. Based on records available from a number of water wells lined up along the Canal de Chalco avenue (Figure 4), a general stratigraphic sequence with four main geological units can be reconstructed (CONAGUA, n.d.). The uppermost 20 to 100 m correspond to (1) lacustrine sediments from the Quaternary, underlain by 200 to 400 m of (2) Quaternary alluvial deposits, 200-300 m of (3) lacustrine deposits from the lower Pliocene and ~400 m of (4) alluvial and volcanic deposits from the Pliocene (Ruvalcaba, 2009; and references therein). Although this sequence promises a rich sedimentary record, in comparison to other parts of the Basin of Mexico, the Xochimilco sediments have not yet received much attention for paleolimnological research.
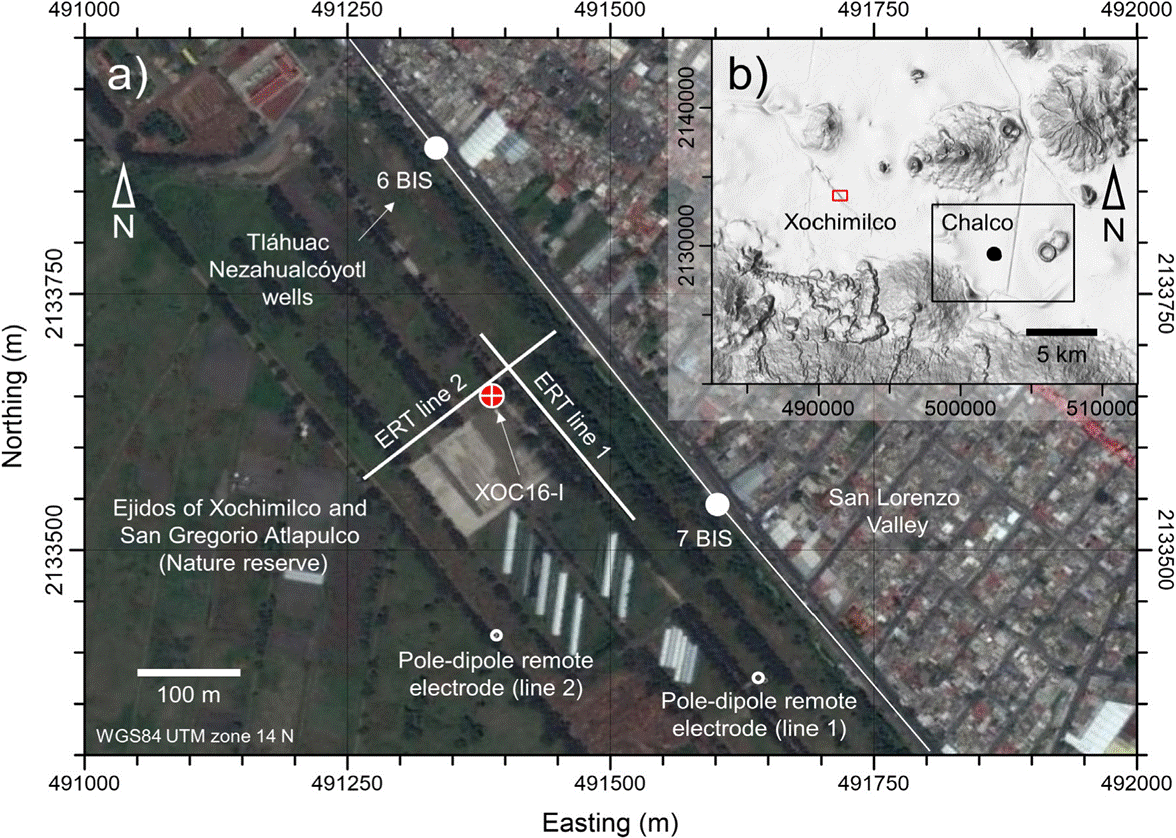
Figure 4 a) Layout of the geoelectrical survey, the drilling site of XOC16-1 (red circle), and the Tláhuac-Nezahualcóyotl water wells in the plain of Lake Xochimilco (white solid circles). b) Localization of the study area (red rectangle) in the south-eastern part of the Basin of Mexico (image data: Google and DigitalGlobe, 2016a, shaded relieve: INEGI, 2016).
In order to investigate the record of environmental changes preserved in the Xochimilco sediments and compare it with the fluctuations recognized in Chalco, one 47 m long core was planned to be collected. An earlier attempt to extract sediments at a location 2 km southeast of the study site using a light coring system (Usinger corer) had to be abandoned, as the corer got stuck in a strongly consolidated layer of volcanic ashes encountered at a depth of about 1 m. Furthermore, the stratigraphic section of water well 6 BIS (see Figure 4) in immediate proximity to the study site includes a 2 m layer of basalt and volcanic ashes and water well 9 (~1 km southeast of the study site) reports a thick layer of volcanic ashes covering the first 20 m (CONAGUA, n.d.). To obtain preliminary information on the characteristics (presence, depth and thickness) of these consolidated materials at the drilling site, the coring campaign was preceded by a local geoelectrical survey.
3.1.2. Geoelectrical survey and drilling
The first ERT profile was collected along line 1 (Figure 4) prior to the drilling campaign in May 2016. Due to more favourable surface conditions, the final drilling site was located about 25 m southwest of this ERT profile. In order to provide further information about subsurface heterogeneities and improve the interpretation, a second survey was conducted in June 2016 along line 2 (Figure 4), which is perpendicular to line 1 and closer to the actual drilling site (< 10 m).
For both profiles, 48 stainless steel electrodes were pushed into the ground with a regular spacing of 5 m between the electrodes, resulting in total profile lengths of 235 m. The measurements were carried out using a Syscal Pro Switch 48 device (Iris Instruments), which allows for an automatic collection of tomographic data sets. The profiles were measured applying dipole-dipole, Wenner and pole-dipole configurations. For the pole-dipole measurements, the first electrodes were relocated at 200 m distance from the profiles (see Figure 4) to serve as remote (or ‘infinite’) poles. The length of the profiles and the selection of different geometrical configurations aimed at a maximum depth of investigation of approximately 70 m. Data inversion was carried out using the software RES2DINV (Loke and Barker, 1995), which is based on a smoothness-constrained least-squares algorithm. Outliers in the data were defined as those measurements with anomalously low (ρɑ < 1 Ωm) or high (ρɑ > 30 Ωm) apparent resistivities. Using this criterion, 45 % of the 992 dipole-dipole readings, 8% of the 360 Wenner readings, and 8% of the 1226 pole-dipole readings were removed from the data prior to the inversion.
The drilling was contracted to tgc Geotecnia S.A. de C.V., which used a drive-sampling technique to retrieve an undisturbed 4 inch sediment core down to a maximum depth of 47 m below the ground surface (in the following called ‘XOC16-I’). Within the layer of indurated volcanic ash, which was encountered between ~1.5 m and ~14.5 m, sediment samples were recovered by percussion drilling. Samples of the uppermost ~1.5 m of top soil and lacustrine sediments, which could not be obtained with the drive sampler, were later collected from a shallow trench. The laboratory analysis of the sediment core and samples is still in progress and to date a preliminary stratigraphic description is available.
3.1.3. Results and interpretation
While the inverted resistivity models of all measured configurations (i.e. dipole-dipole, Wenner and pole-dipole) contained practically identical information in the shallow parts of both sections, their maximum depths of investigation varied largely (dipole-dipole: 20 m, Wenner: 40 m, pole-dipole: 70 m). As mentioned above, the depth of investigation mainly depends on the geometrical characteristics of the electrode configurations, but can decrease significantly in highly conductive materials (as the case of saturated fine-grained lacustrine sediments). Therefore, the inverted resistivity models of the two ERT lines shown in Figures 5 and 6 stem from pole-dipole measurements only.

Figure 5 Left: Inverted electrical resistivity models for pole-dipole measurements on ERT line 2. Black solid circles at the surface indicate electrode positions. Right: Preliminary stratigraphy of Lake Xochimilco Core XOC16-I.

Figure 6 3D-visualization of the inverted electrical resistivity models for pole-dipole measurements on both ERT lines and the relative location of Lake Xochimilco Core XOC16-I. Vertical exaggeration 1x
All presented models consistently show three main geoelectrical units forming - with few exceptions - laterally continuous layers. The first unit extends from the surface to depths between 5 and 10 m and is characterized by relatively large resistivities between 3 and 20 Ωm (warm colours). The second unit is easily distinguished from the first one by its much lower resistivities of 1 to 3 Ωm (cold colours). A third unit with slightly increased resistivities between 3 and 10 Ωm occupies the lowest part of the geoelectrical sections and can be found from depths between 30 m (north-western part of line 1) and 45 m (line 2). In the south-eastern part of line 1, this more resistive unit cannot be distinguished clearly from the intermediate conductive layer.
The preliminary stratigraphic column of core XOC16-I (Figure 6) offers a straight-forward interpretation of the differentiation into three geoelectrical units. The uppermost ~1.5 m of top soil, clayey and silty material, which would be expected to have low resistivities, are too thin to be resolved using an electrode spacing of 5 m. The layer of consolidated coarse- to medium-grained volcanic ash, which extends from 1.5 m to 14.5 m, roughly correlates with the extensions of the shallow resistive unit (> 10 Ωm). Beneath the ash layer, the stratigraphy is quite homogenous and corresponds to lacustrine sediments with textures varying between clay and silt that explain the low resistivity values at these intermediate depths (< 3 Ωm). The increase of the content of fine to medium sand in the lacustrine sediments and the sand encountered on the last 2.5 m of the core can explain the increase of the electrical resistivity at depth. The increase of the resistivity below the maximum depth of the drilling at 47 m, might indicate a continued increase of the fractions of coarser material in the sediments. This hypothesis can further be supported by the presence of alluvial and volcanic deposits (silt, sand, gravel and volcanic ashes) encountered between 40 and 70 m in the nearby water well 6 BIS (CONAGUA, n.d.).
Inconsistencies observed in the resistivity imaging results (e.g. regarding the deep resistive unit) and the difficulties to accurately delineate the contact between the indurated volcanic ash and the lacustrine sediments at ~14 m might be attributed to 3D effects in the acquisition and modelling of 2D resistivity models. Furthermore, the drilling is located at about 10 m from line 2 and the shape of the shallow resistive layer - particularly between 150 and 180 m along the profile direction - indicates a large spatial variability of the thickness of this layer in the immediate surroundings of XOC16-I.
Although the presented interpretation of the electrical units might still be improved, imaging results such as those presented in Figure 5 and Figure 6 reveal the possibility to gain valuable information on lithological contacts prior to the drilling. In particular, the electrical results (1) suggested that drilling through the thick ash layer was warranted in order to reach the deeper lacustrine sediment layers, the presence of which was clear from the high conductivities observed in the geoelectrical section and (2) aid the planning of future drilling campaigns taking into consideration the deep resistive layer likely associated with alluvial and volcanic sediments.
3.2. Case II: Deep exploration at lake Chalco
3.2.1. Background
In comparison to the sub-basin of Xochimilco, for which only scarce information on the shallow sedimentary fill is available, the sub-basin of Chalco (19° 15’ N, 98° 58’ W) has been studied extensively during the last decades. Basin-scale geophysical data is available from a series of studies summarized by Campos-Enríquez et al. (1997). In particular, from gravimetric data analysed by these authors and the stratigraphic record from the deep (3 km) well drilled by PEMEX in Tulyehualco (Pérez-Cruz, 1988), a depth to the volcanic basement of 300 to 500 m can be inferred for the central part of the sub-basin of Chalco. High-resolution stratigraphic records and age models of the uppermost 122 m of sedimentary fill are available from earlier paleolimnological drillings (e.g. Herrera-Hernández, 2011; Lozano-García et al., 2015; Ortega-Guerrero et al., 2015). Based on this information, an age of at least ~300000-500000 years of Lake Chalco’s sediments can be estimated (Herrera-Hernández, 2011; Brown et al., 2012), which makes the latter a unique record of climate and environmental history.
Based on MT sounding results from the northern part of the lacustrine plane and the stratigraphic records of the Santa Catarina-Mixquic water wells (see Figure 7), Chouteau et al. (1994) established a general geological section across the Chalco sub-basin. Based on this section, the thickness of the lacustrine sediment cover reaches its maximum thickness of ~200 m at the southern end of the line of wells indicating a suitable location for paleolimnological drilling. According to Chouteau et al. (1994), these lacustrine sediments are underlain by ~150 m of granular volcanic material and another ~150 m of fractured volcanic rocks (basalt); solid (unfractured) volcanic rock is inferred to underlie the entire sequence at a depth of ~500 m. Although this model has later been adapted by a number of other studies (e.g. Krivochieva and Chouteau, 2003), it is important to recall that the stratigraphic records of the Santa Catarina-Mixquic water wells are limited to the upper 400 m and most of the available geophysical data (i.e. vertical electrical soundings, seismic refraction) also does not cover larger depths with the gravity data being the only exception (Campos-Enríquez et al., 1997 and references therein).

Figure 7 a) Map of the study area at Lake Chalco. Red symbols mark the locations of the geophysical TEM (square) and MT (triangle) sounding sites, the scientific drillings CHA08-II through CHA08-VI and the MexiDrill site. b) Localization of the study area (red rectangle) in the southernmost part of the Basin of Mexico (image data: Google and DigitalGlobe, 2016b, shaded relieve: INEGI, 2016).
In consequence, Brown et al. (2012) state a possible insufficiency of the existing geophysical data for the selection of a suitable site for a planned 500 m drilling to recover the sedimentary record of the sub-basin of Chalco (Lozano-García et al., 2017). In order to fill this gap, a recent seismic survey (Vergara-Huerta, 2015) used the horizontal-to-vertical (H/V) ambient-noise method to provide a new estimate of the depth to bedrock in the surroundings of the later drilling site. However, the results of this study indicate a much smaller thickness of approximately 100-150 m of lacustrine sediments. Because combined MT and TEM surveys helped to constrain the geometry of the geological units down to at least 800 m (Chouteau et al., 1994; Krivochieva and Chouteau, 2003), one MT and several TEM soundings were measured shortly before the start of the MexiDrill campaign in April 2016 (Lozano-García et al., 2017) to provide additional geophysical information.
3.2.2. Electromagnetic soundings
It is worth mentioning that the MexiDrill site coincides with the southern end of the line of Santa Catarina-Mixquic wells (Figure 7), where it is located on a small artificial-fill platform in the new Lake Chalco and in a few meters from the medium-voltage power line that supplies the wells. In order to provide enough space to extend the loops for the TEM sounding and reduce electromagnetic noise and coupling in both TEM and MT data, the sounding sites were located roughly 700 m west of the drilling site (Figure 7).
At the TEM site (Figure 7), two single-loop soundings were collected using 150 m x 150 m and 300 m x 300 m square loops, respectively. The Monex GeoScope TerraTEM system was used for both soundings. Transmitted currents were ~6 A (150 m x 150 m loop) and ~1.5 A (300 m x 300 m loop) in both cases yielding a magnetic moment of ~135000 Am2. Transient data was measured in the time range from 0.1 to 100 ms after current switch off using 43 logarithmically spaced time windows. All data were acquired with an internal notch filter activated that suppresses the effect of power-line noise (60 Hz). For each sounding 250 individual transients were recorded and averaged. The good data quality observed for all measured times (see apparent resistivity in Figure 8) did not require any outlier removal or further processing. Individual inverse modelling of both soundings was done using the software WinGLink (Geosystem). This software does a one-dimensional inversion of the measured transient data in terms of a smooth resistivity model (Constable et al., 1987). Based on the inflections of the smooth model a simple layered-earth model can then be adjusted in a second step. Figure 8 illustrates the smooth (black solid line) and the layered-earth (red dashed line) model adjusted to the measured apparent resistivity curve (black circles) of the 300 m x 300 m sounding.
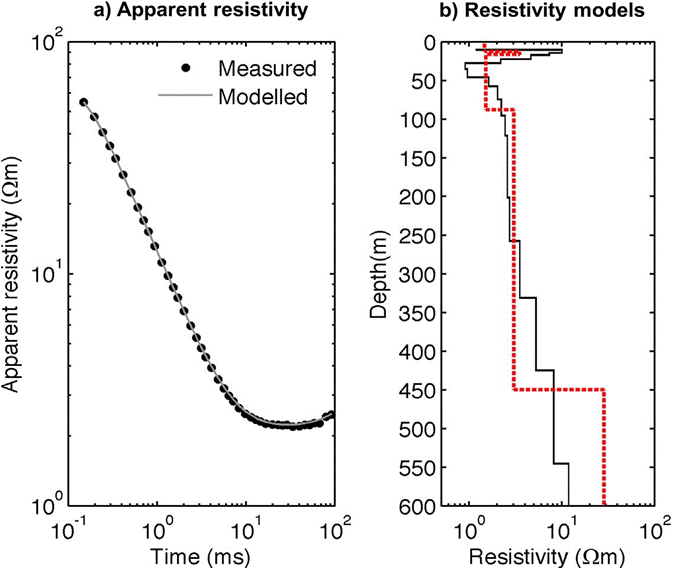
Figure 8 TEM sounding measured with a 300 m x 300 m loop. a) Measured (black circles) and calculated (grey line) apparent resistivity as a function of time. b) Inverted smooth (black solid line) and layered-earth (red dashed line) electrical resistivity models.
The MT sounding data was acquired using a Metronix ADU-07e system. Horizontal electric fields (Ex, Ey) were measured along two perpendicular 40 m long dipoles using non-polarizing lead-lead chloride (Pb-PbCl) electrodes. Two perpendicular horizontal components of the magnetic field (Hx, Hy, parallel to the electric dipoles) as well as its vertical component (Hz) were measured with Metronix MFS-06e low-noise broadband induction coils. Data were acquired in five frequency bands: 32768 Hz (acquisition time 1 min), 16834 Hz (2 min), 8192 Hz (5 min), 4096 Hz (15 min), and 128 Hz (4 hours). However, due to a poor data quality in the high-frequencies, only data of the three low-frequency bands (8192, 4096, and 128 Hz) was used for processing.
For the correction of a possible static shift introduced by shallow resistivity anomalies (e.g. Pellerin and Hohmann, 1990), a small 25 m x 25 m single-loop TEM sounding was collected at the MT site using a TEM-FAST 48 system (AEMR). Injected current was 1 A yielding a magnetic moment of 625 Am2. Transient data were acquired from ~0.006 to 13 ms. Other than for the static-shift correction, this TEM sounding was processed and interpreted in a similar manner as the other TEM data, because due to the instrument’s characteristics the TEM-FAST data usually yields a better resolution of shallow resistivity variations. The recorded MT time-series are processed using the robust algorithms implemented in the software ProcMT (Friedrichs, 2016) in order to estimate scalar apparent resistivities and phases as a function of frequency (Figure 9). This apparent MT impedance data is then modelled using the smoothness-constraint inversion algorithm included in the MT module of the WinGLink software (Geosystem). As in the case of TEM modelling, subsequently the resulting smooth resistivity model is used to adjust a simple layered-earth model. The software also allows correction of the static shift in the apparent impedance data based on the collocated 25 m x 25 m TEM sounding. Due to polarization of the measured data observed at long periods (low frequencies), data from periods > 1.4 s were excluded prior to inversion. Figure 9 illustrates the smooth (black solid line) and the layered-earth (red dashed line) model adjusted to the measured apparent resistivity and phases (black squares) of the MT sounding.

3.2.3. Results and interpretation
The upper 122 m of the electric resistivity models obtained from the TEM soundings using 25 and 150 m loops are presented in Figure 10. Both soundings consistently show the presence of three electrostratigraphic main units; (1) a shallow unit with resistivities of up to 5 Ωm that extends from the surface down to depths between 5 and 15 m, (2) a highly conductive unit with resistivities between 1 and 2 Ωm, the lower limit of which is located around 90 m, and (3) a more resistive unit (15-30 Ωm) at the bottom. Although the nominal investigation depth of the 150 m loop soundings was larger (~300 m), no significant resistivity contrasts were observed at greater depths.

Figure 10 Left and centre: Upper 122 m of the electrical resistivity models obtained from TEM soundings with a) 25 m x 25 m loop and b) 50 m x 50 m loop. Smooth models (black solid lines) and layered-earth models (dashed red lines) are illustrated. Right:Simplified stratigraphic record reconstructed from cores CHA08-II through CHA08-VI (modified from Herrera-Hernández, 2011).
The inferred resistivity variations can be attributed to lithological changes observed along the 122 m long stratigraphic master section (Figure 10) reconstructed from cores CHA08-II through CHA08-VI (Herrera-Hernández, 2011; Ortega-Guerrero et al., 2015) retrieved earlier at a nearby site (Figure 7). The relatively high resistivities of the shallow unit seem to be related to numerous strata of volcanic ash interbedded with lacustrine sediments. The presence of these volcaniclastic deposits decreases significantly below 5 m, which coincides with the decrease of resistivity observed in the high-resolution sounding (TEM-FAST, 25 m loop). Consequently, the low resistivities of the second unit could be related to the fine-grained lacustrine sediments, which are rarely interrupted by volcaniclastic deposits down to a depth of 90 m. Resistivities in this unit might additionally be reduced by saline pore-water (e.g. Chouteau et al., 1994; Campos-Enríquez et al., 1997). The increase of resistivity around 90 m again coincides with an increase of the frequency of interbedded volcaniclastic deposits. Interestingly, at the same depth and below, lacustrine and volcaniclastic sediments also show a significant increase in the content of diatom oozes and intercalated layers of micritic calcite mud (Herrera-Hernández, 2011).
The electrical resistivity models inverted from the 300 m loop TEM sounding and the MT sounding are presented in Figure 11. Due to the size of the loop in the case of the TEM sounding and the elimination of the high-frequency bands from the MT data, the shallow resistive unit is not resolved by either of these two soundings. The bottom of the conductive unit (U2), however, correlates with a resistivity increase between 90 m (TEM) and 120 m (MT) observed in the layered-earth models. At greater depths, the smooth models of both soundings show a continuously increasing resistivity to 30 Ωm (TEM) and 20 Ωm (MT) down to the maximum displayed depth of 600 m. The boundaries of the layered-earth models at ~450 m (TEM) and ~215 m (MT) are somewhat arbitrary and not well defined. The inconsistency among TEM and MT at depth is most probably related to the effect of cultural noise from sources located in the nearby urban areas (e.g. Szarka, 1988).
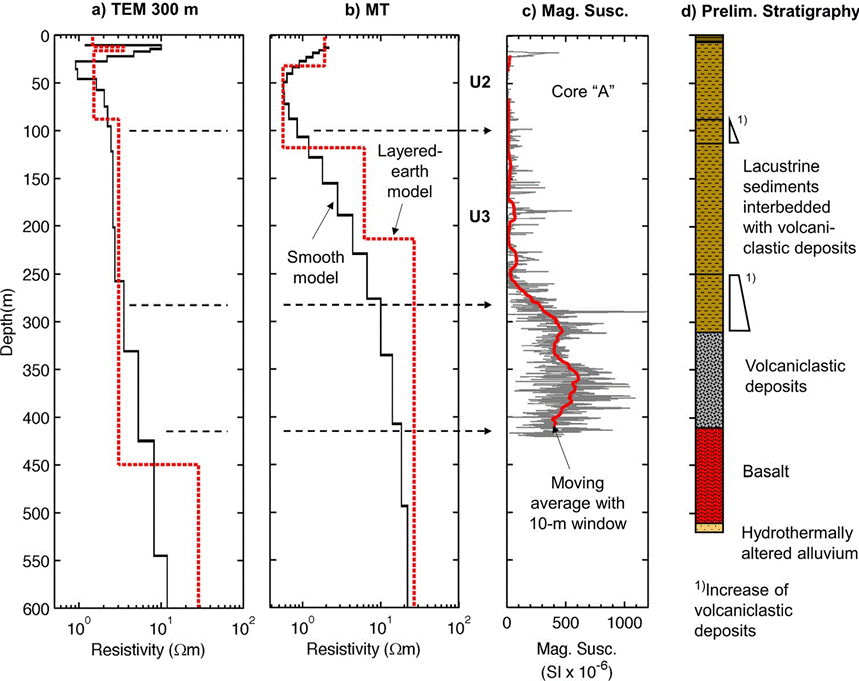
Figure 11 Inverted resistivity models obtained from a) the TEM sounding with 300 m x 300 m loop and b) the MT sounding. Smooth models (black solid lines) and layered-earth models (dashed red lines) are illustrated. c) Magnetic susceptibility scan (thin grey line) of MexiDrill core “A” (Lozano-García et al., 2017), moving average with 10 m window width (thick red line) and d) preliminary stratigraphy of the MexiDrill drilling.
Along with the resistivity models, Figure 11 shows the preliminary magnetic susceptibility scan of core “A” and the main lithological contacts observed during drilling operations (Lozano-García et al., 2017). Besides a peak at approximately 20 m depth, the magnetic susceptibility shows low values from the surface down to 90-100 m reflecting the low amount of volcaniclastic deposits within the lacustrine sediments. Between 100 and 250 m depth, we observe a large number of isolated susceptibility peaks indicating an increased presence of interbedded volcaniclastic deposits. Between 250 and 300 m the magnetic susceptibility increases significantly, marking the transition from lacustrine sediments to practically pure volcaniclastic deposits below ~300 m. Susceptibility data of core “A” was only measured down to ~410 m, where the top of a thick sequence of basalt flows was encountered. Basalts are present down to a depth of at least ~512 m, were the deepest of the four MexiDrill cores (520 m) detected hydrothermally altered alluvial sediments.
The comparison of the resistivity models with the magnetic susceptibility data supports our interpretation of the resistivity increase around 90-100 m correlated with the accumulation of volcaniclastic deposits. The continued increase with depth of this less-conductive material within the lacustrine sediments can also explain the smooth variation of the resistivity at greater depths. Unfortunately, the gradual character of this increase masks the top of the pure volcaniclastic deposits below ~300 m, which is not resolved by our resistivity soundings. Neither do the soundings detect the limit between volcaniclastic material and basalt at ~410 m.
Despite of the limited contrast of the resistivity models at depth (> 400 m), the continuous increase of electric resistivities below 400 m depth strongly indicates that no significant layers of lacustrine conductive sediments could be expected at greater depths. This information provided by TEM and MT sounding results, together with an analysis of available geological data, led to the decision to terminate the first two drill cores slightly below the upper limit of the basalt layer. Only after having retrieved enough lacustrine sediments, the last of the three deep drill cores was continued beyond 400 m depth. Although the last 100 m of basaltic rock and rubble do not explicitly contribute to paleolimnological research, their analysis will be valuable for a deeper understanding of the geological evolution of the sub-basin of Chalco.
4. Discussion and Conclusions
In both presented case studies, a good correlation between electrical resistivity models and stratigraphic sequences from collocated drill cores was observed. In the case of Lake Xochimilco, two ERT sections permitted to infer the presence of lacustrine sediments below a thick unit of indurated volcanic ash (~14 m), improving the outcome of the drilling campaign. As the investigation depth required for the planning of the collection of a ~50 m sediment core was limited to < 100 m, the ERT method was well suited to gain a spatially continuous image of the subsurface conditions. For deeper explorations, however, the required length of the electrode array makes this method less efficient than TEM or MT soundings.
In the case of Lake Chalco, the resistivity variation obtained from TEM and MT soundings clearly indicated a partitioning of the sediment fill into different units. However, the limited individual thicknesses of the alternating deposits of lacustrine sediments and volcaniclastic material were too small to be resolved at depths of tens to hundreds of meters and in particular the gradual increase of the fraction of volcaniclastic deposits with depth hampered the reconstruction of an exact sediment thickness. While the resistivity models reflected this transition very well, the gradual increase masked the actual layer boundaries, which could have been difficult to interpret without additional data from complementary geophysical data or drill cores available. Nevertheless, it should be noted that the mentioned complexity of the studied geological sequence puts a challenge on most geophysical exploration methods. In this study, the main contribution of the electromagnetic soundings was the important conclusion that no significant lacustrine sediment layers were to be expected at depths > 400 m as indicated by the continued increase of electric resistivities.
For less complex environments, where (pure) lacustrine sediments are in direct contact with a consolidated and low-permeability basement, we can infer that resistivity models would be suited to map this contact. Colombero et al. (2014), for instance, used ERT surveys to reconstruct the geological evolution of a glacial lake in Italy and Hautot et al. (2006) used MT soundings to infer the structure of a Mesozoic basin beneath Lake Tana in Ethiopia. The latter can also serve as an interesting example for an EM survey that combines the 1D models of more than one MT sounding to reconstruct a basin-scale geological section.
Besides the increased resistivity contrast with bedrock material, the generally high conductivity of fine-grained lacustrine sediments also favours another respect. Although conductive environments typically reduce the expected investigation depth of electromagnetic exploration, they also reduce the influence of cultural noise (e.g. from power lines, etc.) and make TEM and MT studies feasible even in or close to urban areas (e.g. Krivochieva et al., 2003).
In this study, we strictly present results from terrestrial measurements. However, as paleolimnological research is certainly not limited to (near) desiccated lake basins, it is important to clarify that all three methods presented can also be applied on existing lakes. We refer to Colombero et al. (2014) for an interesting application of ERT on a glacial lake in Italy, Mollidor et al. (2013) for a TEM survey on a crater lake in Germany, and Bastani et al. (2015) for a boat-towed radio-frequency MT survey on Lake Mälaren in Sweden.

