


Servicios Personalizados
Revista
Articulo
 Inglés (pdf)
 Artículo en XML
 Referencias del artículo
 Enviar artículo por email
Indicadores
-
 Citado por SciELO
 -
 Accesos
Links relacionados
-
 Similares en
SciELO
Similares en
SciELO
Compartir

 Permalink
Boletín de la Sociedad Geológica Mexicana
versión impresa ISSN 1405-3322
Bol. Soc. Geol. Mex vol.66 no.1 Ciudad de México abr. 2014
Artículos
Detrended correspondence analysis: A useful tool to quantify ecological changes from fossil data sets
Análisis de correspondencia sin tendencia: una herramienta útil para cuantificar cambios ecológicos a partir de conjuntos de datos de fósiles
Alexander Correa-Metrio1,*, Yanus Dechnik2, Socorro Lozano-García1, Margarita Caballero3
1 Instituto de Geología, Universidad Nacional Autónoma de México, Ciudad Universitaria, 04510 México, D.F. *acorrea@geologia.unam.mx
2 Facultad de Ciencias, Universidad Nacional Autónoma de México, Ciudad Universitaria, 04510 México, D.F.
3 Instituto de Geofísica, Universidad Nacional Autónoma de México, Ciudad Universitaria, 04510 México, D.F.
Manuscript received: January 24, 2013.
Corrected manuscript received: March 27, 2013.
Manuscript accepted: September 20, 2013.
Abstract
Fossil assemblages reflect the parental communities that produced them, and are in turn associated with specific environmental conditions. Thus, climatic and environmental changes are associated with changes in both the biotic communities and the fossil assemblages they produce. As a consequence, the environmental reconstruction of the past relies on the interpretation of multivariate fossil sequences that are commonly analyzed through dimensional rescaling techniques. Detrended correspondence analysis (DCA) has proven as an excellent technique to summarize ecological changes through time with the advantage of few prior assumptions and results that can be directly interpreted in terms of ecological turnover. In this paper we elaborate on a brief description of the technique and the interpretation of results, using a worked example on pollen and diatom data sets from Lago Verde (Los Tuxtlas, Mexico). With this worked example, we highlight the three basic ways in which DCA can provide useful approaches for a clear and relatively easy interpretation of the fossil data: i) identification of the ecological space through the a priori interpretation of species ordination; ii) localization of time slices within the ecological space defined by species, and quantification of the ecological turnover among samples; and iii) calculation of ecological distances as a means for putting individual samples into the historical context provided by the time frame in question.
Keywords: Ecological distance, ecological turnover, ecological baseline, pollen, diatoms, detrended correspondence analysis (DCA).
Resumen
Los arreglos de fósiles coetáneos reflejan las comunidades parentales que los produjeron, las cuales están asociadas a su vez con condiciones ambientales particulares. Por lo tanto, los cambios climáticos y ambientales están inherentemente asociados con cambios en las comunidades bióticas y en los arreglos fósiles que ellas producen. Así, la reconstrucción de los ambientes del pasado se basa en la interpretación de secuencias fósiles multivariadas que son comúnmente analizadas a través de técnicas de reescalamiento multidimensional. Se ha demostrado que el análisis de correspondencia sin tendencia (DCA, por sus siglas en inglés) es una excelente técnica para resumir cambios ecológicos a través del tiempo. La técnica requiere el cumplimiento de pocos supuestos y sus resultados pueden ser intepretados de manera directa en términos de recambio ecológico. En este artículo, se elabora una descripción breve de la técnica y la interpretación de sus resultados, presentando un ejemplo de su aplicación usando datos de polen y diatomeas derivados de una secuencia sedimentaria de Lago Verde (Los Tuxtlas, México). Mediante el uso de este ejemplo, se resaltan los tres mecanismos básicos por los cuales el DCA ayuda de una manera relativamente fácil y clara en la interpretación de las secuencias fósiles: i) la identificación del espacio ecológico a través de una interpretación a priori de la ordenación de las especies; ii) la localización de momentos en el tiempo dentro del espacio ecológico definido por las especies, y la cuantificación de la distancia ecológica entre muestras; y iii) el cálculo de distancias ecológicas como medio para poner muestras individuales en el contexto histórico ofrecido por la secuencia sedimentaria bajo estudio.
Palabras clave: Distancia ecológica, recambio ecológico, línea base ecológica, polen, diatomeas, análisis de correspondencia sin tendencia.
1. Introduction
Communities respond to climate and other environmental drivers through a variety of mechanisms. Community-level compositional and structural changes emerge from the individualistic response of species to endogenic and exogenic drivers (Bush, 2003). Endogenically, populations can respond to compensatory mechanisms, random changes in demographic rates, and genetic restructurations derived from their own structural history (Frost et al., 1995; Adler et al., 2007). Exogenic drivers are mostly associated with environmental changes that are an intrinsic part of the history of the planet. Climate and geomorphology change at diverse time and geographic scales, generating environmental conditions that are in turn associated with responses of the biotic communities (Delcourt and Delcourt, 1991). In addition, interactions with populations of other species generate compensatory mechanisms but at community level in this case (Frost et al., 1995). All these processes are responsible for short and long-term changes in community configuration, and each one of them gains differential importance depending on the context in which they take place (Delcourt and Delcourt, 1991; Frost et al., 1995). Thus, when the composition and structure of the community is studied at a particular moment in time, many of these factors, as well as their relative importance, can be inferred. The study of the fossil record facilitates the reconstruction of communities through time from a historical to millennial-scale perspective (Birks and Birks, 1980; Delcourt and Delcourt, 1991; Delcourt et al., 1983). Within the Quaternary, microfossil arrangements are the most common type of fossil remains, mostly corresponding to lacustrine and marine sedimentary sequences that allow the reconstruction of forests as well as fresh and salt water communities (Birks and Birks, 1980; Delcourt and Delcourt, 1991; Birks, 2003).
Pollen and spores accumulate along with sediments in depositional environments. Consequently, sedimentary sequences in lake bottoms, oceans, bogs, etc. contain a signal that provides insight into the dynamics of the vegetation through time (Birks and Birks, 1980). However, the signal provided by pollen and spores is far from perfect, mostly because of representativity problems derived from pre-and post-depositional factors that obscure the relationships between taxon abundance in the fossil spectrum and parent species. Pollination syndrome and pollen dispersal are the main pre-depositional factors that keep the pollen-vegetation relationship from being one-to-one (Birks and Gordon, 1985; Bush, 1995). Whereas species pollinated by wind usually produce large amounts of pollen to guarantee reproductive success, insect-pollinated species allocate more energy to produce rewards for pollinators (Birks and Gordon, 1985). Subsequently, pollen is submitted to differential preservation and degradation processes, causing further preservation bias. However, it has been demonstrated for diverse locations in the world that although imperfect, pollen spectra are feasible tools to identify vegetation patterns associated with biogeographic and environmental gradients at micro to macro scales, mostly depending on the particular environmental settings (Bush, 1991, 1995; Rodgers and Horn, 1996; Bonnefille et al., 1999; Correa-Metrio et al., 2011a; Urrego et al., 2011). Thus, pollen and spore signals offer proxies for vegetation diversity and reflect latitudinal, altitudinal, and other gradients associated with community composition and structure.
Sedimentary sequences also contain the signal of aquatic organisms, such as diatoms, associated with characteristics of the water column. The composition of the diatom community is affected by the conditions of the water where they live (Fritz et al., 1991; Wetzel and Likens, 2000). Even though they are part of a broader algal community, their siliceous body facilitates their preservation in the microfossil assemblages, aiding in the understanding of the water level, trophic status, and water chemistry dynamics through time. Furthermore, given that their life cycle occurs in the water and their remains are directly deposited in the sediment, the diatom signal is not confounded by transport and representativity processes (Battarbee et al., 2001). Within the trophic gradient, diatoms are less dominant towards the euthrophic end of the spectrum, with species composition revealing subtle variations in trophy within this part of the gradient (Wetzel and Likens, 2000; Battarbee et al., 2001). Even though diatom communities show altitudinal and latitudinal variability, they reflect changes in limnological factors associated with climatic gradients rather than broad biogeographic patterns (Fritz et al., 1991; Battarbee et al., 2001). Thus, unlike vegetation, diatoms indicate conditions that are more associated to processes specific to local conditions than to broad climatic patterns. Broadly speaking, diatoms in the fossil record reflect trophic and luminous dynamics of the lakes, which are not necessarily associated with regional environmental conditions. However, there is an inherent relationship between lake trophic levels and geologic materials and weathering rates, which are in turn closely associated with climate.
Conclusively, pollen and diatom records complement each other (e.g. Lozano-Garcia et al., 2007), providing information that leads to environmental reconstructions at scales that range from local to regional. Both proxies indirectly reflect biotic communities that should be governed by ecological principles. The ecological space (sensu niches) corresponds to the hypervolume defined by all environmental variables that modulate the composition and structure of biological communities (Delcourt and Delcourt, 1991; Bush, 2003; Williams and Jackson, 2007). Thus, as environmental conditions change, fossil assemblages reaccomodate and define a space that encompasses all the environmental conditions experienced through the time contained in the sedimentary sequence. In such way, it is possible to use such space to measure the ecological changes in terms of distances among species or samples (Hill and Gauch, 1980; Gauch, 1982).
1.1. Multivariate analyses of fossil data sets
When a fossil data set is available, multivariate techniques offer the possibility of interpreting simpler summaries of the data to reconstruct the environmental stages reflected by the fossil proxies (Birks and Gordon, 1985; Legendre and Legendre, 1998; Orlóci et al., 2006). Although the interpretation of the environmental signal contained in fossil pollen and diatom sequences can be based on individual taxon changes, multivariate approaches are more robust and allow the estimation of the breadth of ecological variability (Orlóci et al., 2006; Urrego et al., 2009; Correa-Metrio et al., 2011a). Quantitative interpretations require extensive surveys to fully understand the relationships between microfossil and specific environmental conditions (Birks and Gordon, 1985; Birks, 2003). These studies lead to the calibration of the fossil signals in terms of the variables of interest, allowing a priori interpretations of the results derived from the analysis of fossil sequences (e.g. Correa-Metrio et al., 2011a, 2012a). Nevertheless, these data sets are rarely available, calling for the need of using multidimensional rescaling, a series of techniques that offers patterns of ecological and environmental change derived from a posteriori interpretations (Legendre and Legendre, 1998; Correa-Metrio et al., 2010).
Principalcomponents analysis (PCA) and correspondence analysis (CA) are multidimensional-rescaling techniques that have been routinely applied in paleoecological studies (Birks and Gordon, 1985; Birks, 1986). However, the violation of assumptions (mainly the lack of linear response of species to environmental gradients) lead to unbalanced ordinations that in turn cause strong biases in the identification of environmental gradients and the interpretation of results (Hill and Gauch, 1980; Gauch, 1982). Alternatively, multidimensional scaling (mds) and detrended correspondence analysis (DCA) are techniques that are relatively easy to interpret (Hill and Gauch, 1980; Legendre and Legendre, 1998). DCA is of special interest as it provides ordinations in spaces that are defined in known units of standard deviation, being directly interpreted in terms of ecological turnover (Hill and Gauch, 1980; Gauch, 1982). DCA has yielded good results for pollen analysis, allowing interpretation of results that go beyond the temporal, ecological and environmental trends (e.g. Urrego et al., 2009; Correa-Metrio et al., 2012b; Restrepo et al., 2012;). Because of this essential reason, our paper focuses on the description of some technicalities of the method, along with the development of a worked example using pollen and diatoms from Lago Verde (see Caballero et al., 2006; Ortega et al., 2006; Lozano-Garcia et al., 2007).
1.2. Detrended corespondence analysis: beyond the ghost of linearity
Detrended correpondence analysis (DCA) improves multidimensional-rescaling ordinations by reducing the arch effect produced by other ordination techniques (Hill and Gauch, 1980; Gauch, 1982). Once the ordination has been produced, the axes are rescaled to decompress the extremes of the gradient that resulted compressed because of the aforementioned arch effect. However, this decompression of the axes through the division of the ordination into segments causes distortion of the variance, impeding the interpretation of eigenvalues as variance fractions (Gauch, 1982). In this case, eigenvalues have to be interpreted as reflecting the relative importance of the axes because the detrending procedure corrupts the variance and prevents percentual interpretations such as those of PCA (Legendre and Legendre, 1998).
DCA rescaling is achieved by equalizing the average dispersion within samples, taking their standard deviation to one. Thus, the average species abundance profile has a length of one, with the resulting units of the ordination being standard deviations of ecological turnover (SD) (Hill and Gauch, 1980; Gauch, 1982). Consequently, and in an analogous fashion to the normal distribution (Zar, 1999), species should appear, rise and go locally extinct within 4 SD, causing a complete ecological turnover (Gauch, 1982). A t distribution with degrees of freedom of number of samples minus number of taxa would offer a more precise indication of species turnover. Unfortunately, number of taxa in tropical environments is rarely exceeded by number of samples, causing difficulties to define a positive sensible number for degrees of freedom (Correa-Metrio et al., 2010). When degrees of freedom are sensible, species turnover would be equal to the area under the t curve enclosed within the limits defined by the ecological distance centered in zero.
DCA produces scores for both species and samples (Hill and Gauch, 1980). Species scores indicate the relative position of taxa in the reduced space with respect to the way they vary through time. The meaning of DCA axes is then inferred evaluating the relative position of species in terms of what is known of their distribution in modern environmental gradients (prior knowledge). This exercise is purely qualitative and, like in any ordination technique, its main goal is to define the environmental meaning of the axes, and thus define the ecological space outlined by the ordination axes (Legendre and Legendre, 1998). Subsequently, the space defined by species is used to ordinate samples. Consequently when axis scores are plotted stratigraphically, it is possible to infer how the defined environmental variables changed through time.
Another advantage of DCA is the fact that the axes have SD as units, making feasible the direct interpretation of distance among samples in terms of ecological turnover. Once the samples have been ordinated into the reduced space, it is possible to calculate the Euclidean distance among them and derive their ecological dissimilarity (Orlóci et al., 2006; Urrego et al., 2009). If Euclidean distance is calculated between contiguous samples, it is possible to identify periods of relative ecological and environmental stability. This perspective can be complemented by calculating rates of ecological change (RoC), which consist in dividing Euclidean distances among contiguous samples by the time elapsed between them (Urrego et al., 2009). This estimate provides an approximation to the velocity at which species turnover takes place. Additionally, it is possible to calculate distance from all samples to a single moment in time, providing an indication of when conditions were similar to those of the reference sample (Restrepo et al., 2012).
2. A worked example from Lago Verde
2.1. Lago Verde data set
The data set from Lago Verde offers a good opportunity to exemplify the concepts and techniques that have been expressed in the introduction. Lago Verde is a shallow (4.5 m deep) maar-lake located in the northern slopes of San Martín Volcano, Veracruz, Mexico (18°3'43''N 20°52'W, 100 masl) (Lozano-Garcia et al., 2010). Three parallel sediment cores were retrieved from the central part of the lake using a piston corer. Sediments have been extensively analyzed for pollen, diatoms and geochemistry, and results have been published elsewhere (Caballero et al., 2006; Ortega et al., 2006; Lozano-Garcia et al., 2007, 2010; Ruiz-Fernández et al., 2007).. Here we use the pollen and diatoms records of Lago Verde (Caballero et al., 2006; Lozano-Garcia et al., 2007) to derive ecological changes through two DCA analyses performed independently on each data set. We present data for the last 2100 years with CE and BCE refering to "common era" and "before common era", respectively. All data processing was performed using R (R Development Core Team, 2009), especially packages "vegan" (Oksanen et al., 2009) and "paleoMAS" (Correa-Metrio et al., 2011b).
2.2. Lago Verde detrended corresponde analysis: Pollen and diatoms
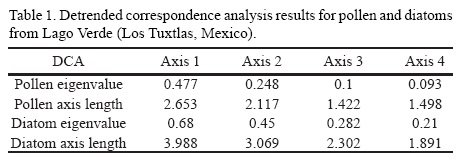
DCAs on pollen and diatoms produced results that were consistent with the nature of the processes and conditions that each proxy reflects. Given their short life cycle and the annual succession process that restructures algal populations, diatom communities rapidly change responding to alterations of the environment (Battarbee et al., 2001). On the other hand, vegetation response to environmental changes is much slower, with the extreme case of trees that can live for centuries, and therefore delay the response of the vegetation to environmental changes (Hartshorn, 1978). In fact, from the pollen record of the Yucatan Peninsula, it has been estimated that vegetation of the area lags environmental changes by ~100 years (Hillesheim et al., 2005). In Lago Verde, diatoms reached a maximum axis length of almost 4 SD (a complete species turnover), whereas pollen maximum was attained at 2.6 SD (Table 1). This clearly exemplifies the higher capacity of the algal community to respond to environmental drivers through species turnover promoted by very short life cycles (Battarbee et al., 2001; Wetzel and Likens, 2000).
The ecological space as defined by species arrangement in the reduced biplot suggests that axes have environmentally-associated distributions along axes 1 and 2 (for species environmental associations see Lozano-Garcia and Martínez, 1990; Lozano-Garcia et al., 2007, 2010). For pollen, taxa associated with open forest (e.g. Amarantahceae, Ambrosia, Asteraceae, Poaceae) attained high DCA axis 1 scores (Figure 1). However, taxa that are characteristic of forested areas at different successional stages (e.g. Alchornea, Fabaceae, Cecropia, Lonchocarpus, Moraceae) obtained low and almost always negative DCA axis 1 scores (Figure 1). Additionally, taxa that are distributed in the higher elevations of the region (Alnus, Pinus, and Quercus; Rzedowski, 2006) were ordinated at the positive end of axis 1, probably reflecting higher dominance of these taxa during times of open vegetation caused by wind transport of pollen grains. This provides additional evidence of this axis representing vegetation cover going from closed canopies to open vegetation from the negative to the positive extremes of the axis. Regarding axis 2, there is a successional gradient evidenced by secondary forest and pioneer species (Cecropia, Piper, Trema) ordinated in the lower part of the axis, and primary forest species (e.g. Celtis, Lonchocarpus, Moraceae) attaining positive scores (Figure 1).
In terms of diatoms, the ecological space seems to be clearly divided too, providing further evidence of the utility of DCA for interpreting ecological and environmental signals from lacustrine sedimentary sequences (see Caballero et al., 2006, for species environmental associations). According to species distribution, diatom-DCA axis 1 reflected water column depth (Figure 1). Diatom species associated with deep waters (e.g. genus Aulacoseria and Synedra delicatissima) were ordinated on the negative part of DCA axis 1, whereas shallow-water species (e.g. Gomphonema, Navicula mutica, Hantzschia amphioxys) were ordinated over the positive side of the same axis. Diatom-DCA axis 2 in turn seemed to be associated with trophic level (Figure 1), with meso-eutrophic species (Aulacoseria spp.) obtaining negative scores. Species that have wide ecological tolerances but that generally prefer lower trophic level waters (e.g. small Fragilaria sensu lato) or that have an ecological advantage when nutrients become limiting (e.g. Cyclotellaspp.) obtained positive DCA axis 2 scores.
Given the clear association of DCA axes with the ecological space reflected by both pollen and diatoms, it is possible to stratigraphically draw axes scores to provide a simplified picture of environmental changes through time. For Lago Verde, axis 1 of both pollen and diatom DCA portraits a broad picture of the environmental history of the area (Figure 2). A clear-cut distinction in the conditions of the area was marked by the contrasting scores before and after the period between 850 and 900 CE. Whereas before this period DCA suggests the dominance of rather open vegetation and low lake levels, after it and until ~1900 CE the area was characterized by closed canopy forests and relatively deep water columns. According to previous interpretations of the pollen and diatom signal (Lozano-Garcia et al., 2007, 2010), the Maya Drought (Hodell et al., 1995, 2001) marked an inflection point regarding the environmental conditions of the area.
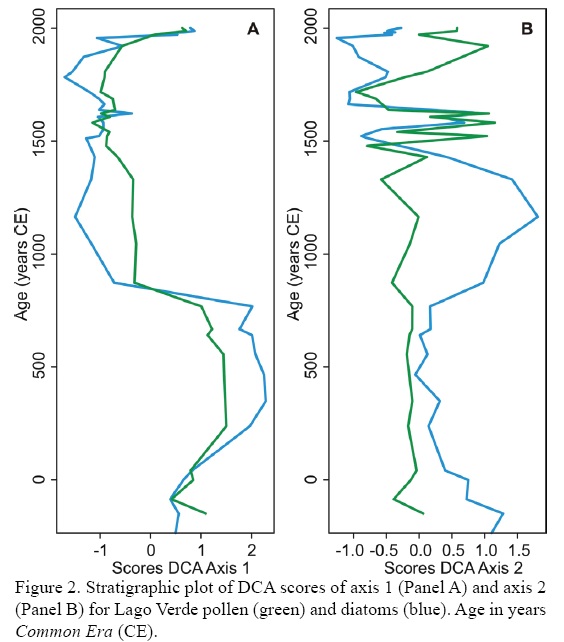
Apparently, before 800 CE the territory was heavily occupied by people, who maintained a regime of heavy disturbances over the forest (Lozano-Garcia et al., 2007). Human abandonment of the area has been reported as taking place between 750 and 900 CE (Santley and Arnold III, 1996), coinciding with the inflection point of DCA axis 1 for both proxies. After human abandonment, the disturbance regime probably returned to the natural cycle, allowing the recovery of the forest which acquired a more closed character. These dynamics seem to have been clearly captured by the pollen-DCA axis 1, which suggests a transition from relatively open vegetation before the inflection point to more closed canopies towards the present. Diatom-DCA axis 1 followed a pattern that resembled that of pollen-based analysis, showing low and high lake stands before and after the Maya drought, respectively. Low hydric regulation of the basin is likely to have occurred under conditions of low vegetation cover, leading to the dominance of the diatom spectrum by species associated with shallow environments. Conversely, after the Maya drought, vegetation recovery probably helped to regulate lake levels, maintaining relatively high stands throughout the year. It is remarkable that from 1900 CE to present, DCA axis 1 scores of both proxies surged back, probably reflecting modern human recolonization.
Even though a possible scenario for the interpretation of axis 2 for both proxies was envisaged, its variability through time does not seem as straightforward as that of axis 1. Pollen-DCA axis 2 suggests the dominance of rather pioneer and secondary forests throughout most of the record, except for two short periods (between 1500 and 1650 CE, and 1800 and present). High pollen accumulation rates were evident at Lago Verde between 1400 and 1850 CE, and because human abandonment occurred 600 years earlier, this change is most likely associated with climate changes (Lozano-Garcia et al., 2007). This period coincided with the Little Ice Age (LIA) and was characterized by a warmer and wetter climate that resulted in higher ecosystem productivity. The peak of high pollen-DCA axis 2 scores between 1500 and 1650 was nested within this period, suggesting that even though productivity increased as climate changed, compositional change towards more mature forests lagged climate. Accordingly, that lag was of ~100 years, a magnitude that has also been reported for other locations of the Yucatan Peninsula (Hillesheim et al., 2005).
Diatom-DCA axis 2 evidenced a change in the trophic level of the lake with positive scores dominating before 50 CE, and the period between 800 and 1400 CE. According to our prior interpretation of diatom-axis 2, these periods would be associated with rather eutrophic conditions, whereas the rest of the time would have been dominated by mesotrophy. This interpretation seems at odds with the expectation of a higher lake trophy during times of high human impact, and less trophy during times of vegetation recovery (Caballero et al., 2006). However, it is remarkable that the scores follow a pattern of changes that reflected the most important climatic events of the last 1500 years, these being the Medieval Warm Period and the Little Ice Age (Mann et al., 2009). It is highly likely that other factors apart from lake trophy confounded the signal of this axis, but what is clear is the rapidity at which diatom respond to climatic changes at short and long term. Another possibility is that higher temperatures during the Medieval Warm Period in the northern Hemisphere (Mann et al., 2009) promoted higher lake trophy through an acceleration of nutrient cycles in warmer waters.
2.3. Ecological change and baselines in water and forests
Ecological change and its associated rates clearly depicted a history that is consistent with the interpretation of the DCA scores. In terms of total ecological change between samples, diatoms and pollen seem to tell the same story, although diatom-based distances are larger than those calculated based on pollen (Figure 3a). This result can be easily explained by the higher motility of the diatom community and their faster tracking of climate. In both communities, the most important ecological changes took place at the inception of the periods of relatively homogeneous conditions that have been identified for the area. The most important change occurred ~850 CE when, according to our interpretations and previously published results, human abandonment of the area took place. Ecological changes of ~1.5 and ~3 SD for pollen and diatoms, respectively, indicated the inception of a period dominated by communities with a species turnover of more than 50 % and almost 100 % for pollen and diatoms, respectively. The inception of the LIA marked the beginning of an environmental instability period that extended from ~1500 to ~1700 CE, with the return of relatively stable conditions being marked by low ecological distances. These 200 years probably represent the amount of time necessary for biotic communities to accommodate and stabilize with new colder and wetter conditions that characterized the LIA. The last part of the record was marked by high ecological change, which was probably promoted by 20th-century to modern human disturbances associated with recolonization of the area.
In terms of the velocity at which ecological change took place, differences among periods of high ecological turnover were remarkable (Figure 3). The three periods that were characterized by high ecological change of the water community showed velocities that seemed inversely proportional to the extent of the unstable period. Whereas the period that marked the highest community turnover was characterized by relatively low velocity of ecological change, the last century showed an all-time high velocity and the LIA nested rates were in the middle (Figure 3). A similar pattern was shown by pollen-derived change velocities, although RoC for the last century and LIA showed similar values. Interestingly, pollen-derived ecological change seem to reflect the two cold pulses that occurred during the LIA (Figure 3b), suggesting that each of those coolings played a significant role at promoting ecological changes in the region. Overall, whereas communities composition and structure are probably modeled by the total amount of ecological turnover, extinction risks and the importance of sudden changes are better understood by examining the rates at which it happens. Thus, both approaches provide important hints regarding climatic and ecological history.
Distance of the most recent sample of both pollen and diatoms (age 2001 CE) to the fossil assemblages suggests that the forest and the aquatic community that occupy the area today are relatively novel. In other words, the ecological space defined by the history reflected in pollen and diatom fossil assemblages suggest that modern communities were not present in the area during the last 2100 years, at least with the same composition and structure they have today. The most dissimilar time for both proxies took place between human abandonment at ~800 CE and 1970 CE, when distances over 1 SD were reflected by both proxies (Figure 3). Human abandonment was probably the most important event that took place in the area in the recent past, and it led to communities that according to the DCA-based distances had compositions that differed at least 50 % from modern. Pervasive human influence is likely the cause of the ecosystems before 800 CE of being more alike to modern ones than those from between 800 and 1970 CE. The trend between 1970 and 2001 CE probably reflects the conjunction of 20th century human recolonization with the unprecedented warming that has taken place during the last 40 years (Burrows et al., 2011).
3. Conclusions
Dimensional rescaling through DCA provides a useful means to derive the ecological space reflected by fossil sequences of biotic proxies. Once the ecological space is defined by the arrangement of the species, it is relatively easy to infer ecological changes through time and derive metrics for the relative species turnover of communities. Our worked example from Lago Verde offers an illustration of inferred changes and their associated rates converge with interpretations of the record that have been previously published. Even though DCA is a relatively easy and practical tool to understand the environmental and ecological processes evidenced in fossil records, it still has to be supported by taxon-level interpretations. Ideally, DCA results should also be accompanied by physical proxies to fully understand the relationships between environmental and ecological changes. Overall, the use of DCA allows the definition of three important aspects of paleoecological and paleoclimatic studies: i) the quantitative definition of the ecological and climatic envelopes defined by community dynamics reflected in the pollen proxies at the time scale of study; ii) the quantification of changes through time and the speed at which those changes take place; and iii) the construction of a context for communities from a given moment in time (e.g. modern communities) in terms of all the possible assemblages revealed by the available fossil information. The application of the techniques here exemplified is not unique to pollen and diatoms, but to any fossil data set composed of proxies that have the ability to reflect changes at community level.
Acknowledgements
We are grateful to L. Calvillo-Canadell and S. Cevallos-Ferriz for inviting us to be part of this special issue, to D. Hernández for editorial services, and to A. González for field assistance. The comments of H.I. Martínez Carera and an anonymous reviewer strengthened the manuscript. Financial support from DGAPA grant number IA101912 and CONACYT 167621.
References
Adler, P.B., HilleRisLambers, J., Levine, M., 2007, A niche for neutrality: Ecology Letters, 10, 95-104. [ Links ]
Battarbee, R.W., Jones, V.J., Flower, R.J., Cameron, N.G., Bennion, H., Carvalho, L., Juggins, S., 2001, Diatoms, in Smol, J.P., Birks, H.J.B., Last, W.M. (eds.), Tracking Environmental Change Using Lake Sediments, Volume 3:Terrestrial, Algal, and Siliceous Indicators: Dordrecht, The Netherlands, Kluwer Academic Publishers, 155-202. [ Links ]
Birks, H.J.B., 1986, Numerical zonation, comparison and correlation of Quarternary pollen-stratigraphical data, in Berglund, B.E. (ed.), Handbook of Holocene Palaeoecology and Palaeohydrology: Chichester, U.K., Wiley & Sons, 743-774. [ Links ]
Birks, H.J.B., 2003, Quantitative palaeoenvironmental reconstructions from Holocene biological data, in Mackay, A., Battarbee, R., Birks, J., Oldfield, F. (eds.), Global Change in the Holocene: London, Arnold, 107-123. [ Links ]
Birks, H.J.B., Birks, H.H., 1980, Quaternary Palaeoecology: Baltimore, University Park Press, 289 p. [ Links ]
Birks, H.J.B., Gordon, A.D., 1985, Numerical Methods in Quaternary Pollen Analysis: London, Academic Press, 289 p. [ Links ]
Bonnefille, R., Anupama, K., Barboni, D., Pascal, J., Prasad, S., Sutra, J.P., 1999, Modern pollen spectra from tropical South India and Sri Lanka: Altitudinal distribution: Journal of Biogeography, 26, 1255-1280. [ Links ]
Burrows, M.T., Schoeman, D.S., Buckley, L.B., Moore, P., Poloczanska, E.S., Brander, K.M., Brown, C., Bruno, J.F., Duarte, C.M., Halpern, B.S., Holding, J., Kappel, C.V., Kiessling, W., O'Connor, M.I., Pandolfi, J.M., Parmesan, C., Schwing, F.B., Sydeman, W.J., Richardson, A.J., 2011,The pace of shifting climate in marine and terrestrial ecosystems: Science, 334, 652-655. [ Links ]
Bush, M.B., 1991, Modern pollen-rain data from South and Central America: A test of the feasibility of fine resolution lowland tropical palynology: The Holocene, 1, 162-167. [ Links ]
Bush, M.B., 1995, Neotropical plant reproductive strategies and fossil pollen representation: American Naturalist, 145, 594-609. [ Links ]
Bush, M.B., 2003, Ecology of a Changing Planet, 3rd edition: Upper Saddle River, New Jersey, Prentice Hall, 477 p. [ Links ]
Caballero, M., Vásquez, G., Lozano-Garcia, S., Rodríguez, A., Sosa-Najera, S., Ruiz-Fernández, A.C., Ortega, B., 2006, Present limnological conditions and recent (ca. 340 yr) palaeolimnology of a tropical lake in the Sierra de Los Tuxtlas, eastern Mexico: Journal of Paleolimnology, 35, 83-97. [ Links ]
Correa-Metrio, A., Cabrera, K.R., Bush, M.B., 2010, Quantifying ecological change through Discriminant Analysis: a paleoecological example from the Peruvian Amazon: Journal of Vegetation Science, 21, 695-704. [ Links ]
Correa-Metrio, A., Bush, M.B., Pérez, L., Schwalb, A., Cabrera, K.R., 2011a, Pollen distribution along climatic and biogeographic gradients in northern Central America: The Holocene, 21, 681-692. [ Links ]
Correa-Metrio, A., Urrego, D.H., Cabrera, K.R., Bush, M.B., 2011b, paleoMAS: Paleoecological Analysis, R package version 2.0-1 ed.: Vienna, The R Project for Statistical Computing, available at <http://CRAN.R-project.org/package=paleoMAS> [ Links ].
Correa-Metrio, A., Bush, M.B., Cabrera, K.R., Sully, S., Brenner, M., Hodell, D.A., Escobar, J., Guilderson, T., 2012a, Rapid climate change and no-analog vegetation in lowland Central America during the last 86000 years: Quaternary Science Reviews, 38, 63-75. [ Links ]
Correa-Metrio, A., Bush, M.B., Hodell, D.A., Brenner, M., Escobar, J., Guilderson, T., 2012b, The influence of abrupt climate change on the ice-age vegetation of the Central American lowlands: Journal of Biogeography, 39, 497-509. [ Links ]
Delcourt, H.R., Delcourt, P.A., 1991, Quaternary Ecology: A Paleoecological Perspective: Cornwall, UK, Chapman & Hall, 242 p. [ Links ]
Delcourt, H.R., Delcourt, P.A., Webb, T., 1983, Dynamic plant ecology: The spectrum of vegetational change in space and time: Quaternary Science Reviews, 1, 153-175. [ Links ]
Fritz, S.C., Juggins, S., Battarbee, R.W., Engstrom, D.R., 1991, Reconstruction of past changes in salinity and climate using a diatom-based transfer function: Nature 352, 706-708. [ Links ]
Frost, T.M., Carpenter, S.R., Ives, A.R., Kratz, T.K., 1995, Species compensation and complementarity in ecosystem function, in Jones, C.G., Lawton, J.H. (eds.), Linking Species and Ecosystems: New York, Chapman and Hall, 224-239. [ Links ]
Gauch, H.G., Jr., 1982, Multivariate Analysis in Community Ecology: Cambridge, UK., Cambridge University Press, 298 p. [ Links ]
Hartshorn, G.S., 1978, Tree falls and tropical forest dynamics, in Tomlinson, P.B., Zimmerman, M.H. (eds.), Tropical Trees as Living Systems: Cambridge, U.K., Cambridge University Press, 617-638. [ Links ]
Hill, M.O., Gauch, H.G., 1980, Detrended correspondence analysis: an improved ordination technique, Vegetatio, 42, 47-58. [ Links ]
Hillesheim, M.B., Hodell, D.A., Leyden, B.W., Brenner, M., Curtis, J.H., Anselmetti, F.S., Ariztegui, D., Buck, D.G., Guilderson, T.P., Rosenmeier, M.F., Schnurrenberger, D.W., 2005, Climate change in lowland Central America during the late deglacial and early Holocene: Journal of Quaternary Science, 20, 363-376. [ Links ]
Hodell , D.A., Curtis, J.H., Brenner, M., 1995, Possible role of climate in the collapse of ancient Maya civilization: Nature, 357, 391-394. [ Links ]
Hodell, D.A., Brenner, M., Curtis, J.H., Guilderson, T., 2001, Solar forcing of drought frequency in the Maya lowlands: Science, 292, 1367-1370. [ Links ]
Legendre, P., Legendre, L., 1998, Numerical Ecology: Oxford, U.K., Elsevier Scientific, 853 p. [ Links ]
Lozano-Garcia, M.S., Martínez, H.E., 1990, Palinología de la estación de bología tropical los Tuxtlas: especies arbóreas: Mexico City, Instituto de Biología, Universidad Nacional Autónoma de México, [ Links ] .
Lozano-Garcia, M.S., Caballero-Miranda, M., Ortega-Guerrero, B., Rodríguez, A., Sosa-Najera, M.S., 2007, Tracing the effects of the Little Ice Age in the tropical lowlands of eastern Mesoamerica: Proceedings of the National Academy of Sciences, 104, 16200-16203. [ Links ]
Lozano-Garcia, S., Caballero-Miranda, M., Ortega-Guerrero, B., Sosa-Najera, M.S., Rodríguez, A., Schaaf, P., 2010, Late Holocene palaeoecology of Lago Verde: evidence of human impact and climate change in the northern limit of the neotropics during the late formative and classic periods: Vegetation History and Archaeobotany, 19, 177-190. [ Links ]
Mann, M.E., Zhang, Z., Rutherford, S., Bradley, R.S., Hughes, M.K., Shindell, D., Ammann, C., Faluvegi, G., Ni, F., 2009, Global signatures and dynamical origins of the Little Ice Age and Medieval Climate Anomaly: Science, 326, 1256-1260. [ Links ]
Oksanen, J., Blanchet, G., Kindt, R., Legendre, P., O'Hara, B., Simpson, G.L., Solymos, P., Stevens, M.H.H., Wagner, H., 2009, vegan: Community Ecology Package, 1.17-3: Vienna, The R Project for Statistical Computing, available at <http://CRAN.R-project.org/package=vegan> [ Links ].
Orlóci, L., Pillar, V.D., Anand, M., 2006, Multiscale analysis of palynological records: New possibilities: Community Ecology, 7, 53-67. [ Links ]
Ortega, B., Caballero, M., Lozano, S., Vilaclara, G., Rodríguez, A., 2006, Rock magnetic and geochemical proxies for iron mineral diagenesis in a tropical lake: Lago Verde, Los Tuxtlas, East-Central Mexico: Earth and Planetary Science Letters, 250, 444-458. [ Links ]
R Development Core Team, 2009, R: A language and environment for statistical computing, 2.10: Vienna, R Foundation for Statistical Computing, available at <http://www.R-project.org> [ Links ].
Restrepo, A., Colinvaux, P., Bush, M.B., Correa-Metrio, A., Conroy, J.L., Gardener, M.R., Jaramillo, P., Steinitz-Kannan, M., Overpeck, J.T., 2012, Impacts of climate variability and human colonization on the vegetation of the Galapagos Islands: Ecology, 93, 1853-1866. [ Links ]
Rodgers, J.C., Horn, S.P., 1996, Modern pollen spectra from Costa Rica: Palaeogeography, Palaeoclimatology, Palaeoecology, 124, 53-71. [ Links ]
Ruiz-Fernández, C., Hillaire-Marcel, C., Páez-Osuna, F., Ghaleb, B., Caballero, M., 2007, 210Pb chronology and trace metal geochemistry at Los Tuxtlas, Mexico, as evidenced by a sedimentary record from the Lago Verde crater lake: Quaternary Research, 67, 181-192. [ Links ]
Rzedowski, J., 2006, Vegetación de México, 1ra. Edición digital: Mexico City, Comisión Nacional para el Conocimiento y Uso de la Biodiversidad, 504 pp. [ Links ]
Santley, R.S., Arnold III, P.J., 1996, Prehispanic settlement patterns in the Tuxtla Mountains, Southern Veracruz, Mexico: Journal of Field Archaeology, 23, 225-249. [ Links ]
Urrego, D.H., Bush, M.B., Silman, M.R., Correa-Metrio, A., Ledru, M.-P., Mayle, F.E., Paduano, G., Valencia, B.G., 2009, Millennialscale ecological changes in tropical South America since the Last Glacial Maximum, in Vimeux, F., Sylvestre, F., Khodri, M. (eds.), Past Climate Variability from the Last Glacial Maximum to the Holocene in South America and Surrounding Regions: New York, Springer-Verlag, 283-300. [ Links ]
Urrego, D.H., Silman, M.R., Correa-Metrio, A., Bush, M.B., 2011, Pollen-vegetation relationships along steep climatic gradients in western Amazonia: Journal of Vegetation Science, 22, 795-806. [ Links ]
Wetzel, R.G., Likens, G.E., 2000, Limnological Analysis, 3rd edition: Stuttgart, Springer, 429 p. [ Links ]
Williams, J.W., Jackson, S.T., 2007, Novel climates, no-analog communities, and ecological surprises: Frontiers in Ecology and the Environment, 5, 475-482. [ Links ]
Zar, J.H., 1999, Biostatistical Analysis, 4th ed. Upper Saddle River, New Jersey, Prentice-Hall, 663 p. [ Links ]

