


Serviços Personalizados
Journal
Artigo
 Inglês (pdf)
 Artigo em XML
 Referências do artigo
 Enviar este artigo por email
Indicadores
-
 Citado por SciELO
 -
 Acessos
Links relacionados
-
 Similares em
SciELO
Similares em
SciELO
Compartilhar

 Permalink
Boletín de la Sociedad Geológica Mexicana
versão impressa ISSN 1405-3322
Bol. Soc. Geol. Mex vol.65 no.2 Ciudad de México Ago. 2013
Artículos regulares
Use of electrical resistivity tomography in the study of soil pollution caused by hydrocarbons: Case study in Puebla (Mexico)
Uso de tomografía de resistividad eléctrica en el estudio de suelos contaminados por hidrocarburos: caso de estudio en Puebla (México)
Manuel Arrubarrena-Moreno1, Claudia Arango-Galván1,*
1 Depto. de Geomagnetismo y Exploración, Instituto de Geofísica, Universidad Nacional Autónoma de México, 04510, México, D.F. *claudiar@geofisica.unam.mx
Manuscript received: June 3, 2011.
Corrected manuscript received: May 15, 2012.
Manuscript accepted: June 11, 2012.
Abstract
The use of electrical resistivity tomography in the study of soils contaminated by hydrocarbons has had a substantial impact since it gives valuable information on the spatial distribution of pollutants in the subsoil. This methodology was applied to characterize an area contaminated by middle fraction hydrocarbons located at the east of the city of Puebla (central México) in order to probe its effectiveness. Additionally, chemical sampling was conducted in order to identify contaminated areas. Concentrations were determined in five samples in the zone based on the Official Mexican Standard NOM-138-SEMARNAT-SS-2003 (SEMARNAT, 2005).
The geophysical survey consisted of six profiles of 20 m length, using a dipole-dipole array with a separation of four m between profiles and 50 cm of electrode spacing. Later, the geoelectrical models were computed using an inversion scheme in order to determine the resistivity distribution and its relationship with possible contamination.
Results obtained from chemical sampling depicted that the contaminated area was between 0 and 1.3 m depth; three of the five analyzed samples showed a concentration above the allowed standard limit. Comparison between chemical and geophysical data allow us to assess the sensitivity of the physical property to the presence of the contaminant, and it was possible to visualize that electrical resistivity varies depending on volume and residence time of the hydrocarbon in the ground. Finally, comparison between geoelectrical models and hydrocarbon isoconcentrations showed a relationship between low resistivity of the northern portion of the study area and the highest concentration of hydrocarbon detected in the same zone.
Keywords: soil pollution, hydrocarbon pollution, electrical resistivity tomography, geoelectrical model.
Resumen
El uso de la tomografía de resistividad eléctrica en el estudio de suelos contaminados por hidrocarburos ha tenido un impacto sustancial dado que proporciona información valiosa acerca de la distribución espacial del contaminante en el subsuelo. Esta metodología fue aplicada para caracterizar un área contaminada por hidrocarburos de fracción media al oriente de la ciudad de Puebla (Centro de México) para probar su efectividad. Además, se realizó un muestreo químico para identificar las áreas contaminadas. Las concentraciones fueron determinadas de acuerdo con la Norma Oficial Mexicana NOM-138-SEMARNAT-SS-2003 (SEMARNAT, 2005) a partir de la toma de cinco muestras.
El estudio geofísico consistió en seis perfiles de 20 m de longitud, con arreglo dipolo-dipolo, con una separación entre perfiles de 4 m y una separación entre electrodos de 50 cm. Posteriormente, los modelos geoeléctricos fueron obtenidos a través de un proceso de inversión para determinar la distribución de resistividad y su relación con la posible contaminación.
Los resultados obtenidos del muestreo químico señalan que el área contaminada se encuentra entre 0 y 1.3 m de profundidad; tres de las cinco muestras analizadas mostraron un límite superior al permitido por la norma. La comparación entre los datos químicos y geofísicos nos ha permitido evaluar la sensibilidad de la propiedad física a la presencia del contaminante, y también se ha detectado que la resistividad eléctrica varía dependiendo del volumen y del tiempo de residencia del hidrocarburo en el subsuelo.
Finalmente, la comparación entre los modelos geoeléctricos y el mapa de isoconcentraciones de hidrocarburo muestra una correspondencia entre los valores de resistividad baja localizados al norte del área de estudio y la concentración más alta de hidrocarburo localizado en la misma zona.
Palabras clave: contaminación de suelo, contaminación por hidrocarburos, tomografía de resistividad eléctrica, modelo geoeléctrico.
1. Introduction
Soil contamination by hydrocarbons has been a serious problem for the environment for many years. In order to conduct an adequate remediation, the characterization of the contaminated zone should be performed by different techniques, usually direct methods, such as physical analysis (i.e. odor, color, and texture) and chemical analysis (i.e. pollutant concentration).
In recent years, geophysical techniques have become useful in the characterization of contaminated soils by hydrocarbons. One of the most perturbed properties in the presence of hydrocarbons is the electrical resistivity of the ground materials. Some authors have mapped this property in order to establish a relationship between the variation of the property and the concentration, distribution and evolution of the contaminants (e.g. Atekwana et al., 2000; Slater et al., 2000; Godio and Naldi, 2003; Shevnin et al., 2003, 2005, 2006; Sogade et al., 2006).
In particular, application of Electrical Resistivity Tomography (ERT) in the characterization of hydrocarbons has increased recently (e.g. Newmark et al., 1999; Godio and Naldi, 2003; Shevnin et al., 2003, 2005; Batayneh, 2005). ERT is a practical technique because measurements can be taken simultaneously along the profile and it is possible to know the resistivity values in a fast way; also, the quantity of information is very useful to determine the characteristics of the subsoil and to locate the pollutant spatially. Therefore, the contribution of ERT to characterization is valuable since future direct sampling could be performed in the correct places, based on geoelectrical models, and will not depend on subjective criteria.
However, an important aspect in studies using ERT as a mapping tool of soils contaminated by hydrocarbons is how it can establish the relationship between the resistivity value and the presence of hydrocarbons. Sauck (1998) established that oil pollution could increase the conductivity as a result of the increment of salt content in pore water in mature contaminated sites. However, there are several parameters involved in this phenomenon (e.g. lithology, microbial activity, chemical interactions, water table depth). According to Atekwana et al. (2000), resistivity values can also be modified, not only by changes in pore water salinity, but also by changes in soil resistivity values. This variation in the resistivity values has also been confirmed by Godio and Naldi (2003), who established that it is a consequence of physical, chemical and biological changes, and it is manifested as a decrement in effective porosity of the water pore conductivity, producing an increment in the cation exchange capacity with the organic matter and a decrement in fluid conductivity as a consequence of the ion content.
Abdel Aal et al. (2004) emphasize that these resistivity variations in oil contaminated shallow zones are enhanced by biological activity. In addition, another important factor is time; when a hydrocarbon has been exposed to degradation conditions during a long period of time (several years), it shows lower resistivity values than the same hydrocarbon exposed for a shorter period of time (several months). On the other hand, De la Vega et al. (2003) used ERT to characterize a gasoline-contaminated zone in a range of 1 to 2 m depth. They reported that the polluted area showed high resistivity values and, although it was an old spill, the high values could have been given by the low rate of degradation, weather and presence of water.
Therefore, it is very important to consider not only the resistivity value during interpretation, but environmental conditions as well as residence time. Also, resistivity values of the hydrocarbons can be very variable, depending on the type of material in which they are contained and, as it was mentioned before, degradation stage. Hernández-Márquez and Rodríguez-Viluendas (2008) determined that it is possible to delimitate a zone showing a mature contamination using Vertical Electrical Surveys (VES) and ERT, however, the presence of other nearby anomalies (i.e. clayish sediments, water table, buried bodies) could interfere in the precise delineation of the contaminated zone.
2. Study area
The study zone is located at the east of the city of Puebla (México). Because of confidentiality issues, the precise location of the area cannot be given (Figure 1). The pollutant was discharged as a consequence of machinery maintenance. Therefore, many hydrocarbon spills are exposed on the surface. Some preliminary studies (i.e. smell tests, chemical sampling) allowed identifying some contaminated spots showing a concentration above the allowed standard limit. Thus, we used the ERT technique in order to assess the contaminated industrial zone and establish a relationship between electrical resistivity and the presence of pollutants.
2.1. Geological setting
The city of Puebla is located over laharic deposits, which flowed from volcanic structures of the Sierra Nevada (Siebe et al., 1996). These flows outcrop towards the east , until La Malinche volcano, and they change of direction southward until reaching the city of Puebla (Figure 2). These materials are not well-defined structures; they present different particle sizes and are unclassified, chaotically deposited or in irregular lenses. The volcanic materials show a variation in color, ranging from cream color to light gray, they are relatively consolidated (Flores-Márquez et al., 2006). In the study area the main units are volcanic products from these characteristics and alluvial deposits.
2.2. Hydrogeology
According to CONAGUA (2003), the Valley of Puebla aquifer occupies an area of 1300 km2 in the basin. This aquifer shows a predominant vertical system containing three hydrogeological horizons classified as superior, intermediate and deep units. The shallow aquifer is a Quaternary alluvial and volcanic sequence; this horizon also receives the subterranean recharge from the higher zones of the basin. Its thickness in the central zone is approximately 200 m and only a few meters near the borders. Its hydraulic permeability ranges from medium to high (Flores-Márquez et al., 2006).
At the bottom of this layer, lake deposits from the Pliocene can be found. This horizon shows very low permeability because of its high content of lutites. It also contains sandstones and continental limestones. This layer is identified as the limit with the medium aquifer, which is mainly constituted by a sequence of Miocene and Oligocene volcanic deposits. This layer has a higher permeability than the upper layer and receives subterranean recharge in the regional areas (Flores-Márquez, et al., 2006).
2.3. Soil type
According to INEGI (2009), the soil type in the study area is a Cambisol, which has at least one incipient shallow horizon. As it has been said, the study area is associated with laharic materials from volcanic structures, which means that very compacted sand-silt material is observed from the surface until 6 m depth in that zone, approximately.
3. Methodology
An integrated study of the polluted area was done to assess the level of contamination caused by hydrocarbons. This first approach was performed combining chemical and geoelectrical prospecting.
3.1. Chemical sampling
Preliminary studies included chemical sampling. Five samples were taken and processed following the suggested protocol by standard regulation (SEMARNAT, 2005). Unfortunately, this information was not provided prior to geophysical acquisition data. Nevertheless, the geoelectrical profiles were placed in an area close to geochemical sampling, in order to compare the information in a later stage. Results from chemical analysis of the five samples are shown in Table 1.
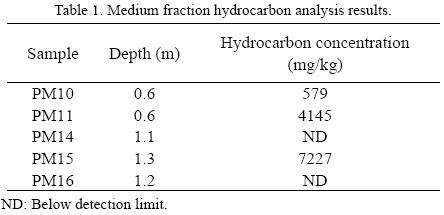
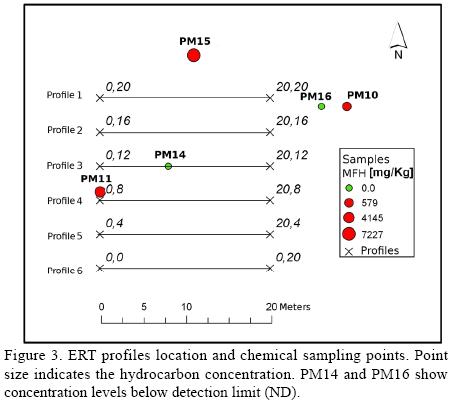
In Figure 3 the location of the chemical samples and the acquired profiles are shown. Sites PM14 and PM11 are close to profiles 3 and 4, respectively. According to Table 1, site PM14 did not show a concentration superior to the detection limit; site PM11 reported a hydrocarbon concentration of 4145 mg/kg at 0.6 m depth, which means that this site exceeds the allowed limit for agricultural and residential land (i.e. 1200 mg/kg) according to the current law (SEMARNAT, 2005). PM15 is located approximately 5 m to the north of profile 1. Chemical analysis indicates a concentration of 7227 mg/kg at 1.3 m depth, which represents a very high concentration, even exceeding the allowed threshold for industrial land of 5000 mg/kg (SEMARNAT, 2005).
3.2. Geoelectrical prospecting
The main goal of this study was to probe the applicability of the ERT in the characterization of contaminated soils by hydrocarbons. Electrical resistivity tomography is a geophysical technique that involves placing series of electrodes in a straight line (2D acquisition). Two electrodes inject direct electric current into the subsurface and two electrodes measure the electric potential between them. This procedure is repeated along the profile by moving the four electrodes. Investigation depth is given by separating the electrodes using different distances along the profile.
The technological development allows that ERT acquisition devices take the measurements automatically. When the electrical current is injected at the surface by the electrodes, its flow is affected by the electrical properties of the materials. Some authors have used the relationship between electrical resistivity and the subsurface properties, such as Meju (2002), who establishes that this relationship is influenced by lithology, texture, fluid presence or empty pore space. He also points out the presence of clays as a determinant factor for higher electrical conductivity values. In this case of study, electrical resistivity is modified in function of the content of fluid in the rock, and also depends on the type of fluid and degree of degradation.
3.2.1. Acquisition and processing data
A small grid of regular shape was designed in order to have a detailed control of geometry and acquisition. A dipole-dipole array was selected because its sensitivity is adequate to map vertical and horizontal electrical discontinuities; also, it has a low electromagnetic coupling between current and potential circuits. However, it is highly sensitive to noise, which could be a problem (Loke, 2010), but in this case it was insignificant because of the size of the prospected area and because we only measured thirteen levels in order to preserve a good signal strength. Six parallel profiles of 20 m length and separated by 4 m were set up. The approximate orientation was E-W, covering an area of 20 x 20 m. Electrode spacing was 0.5 m, with 41 electrodes per line. The contact resistance was checked before all measurements, and it was always below 2 KOhm. The equipment used for this acquisition was a Syscal Pro Switch (Iris Instruments, 2010). Data processing was implemented in RES2DINV software (Geotomo, 2006).
Geoelectrical models were obtained using a 2D inversion algorithm (Loke and Barker, 1996). This inversion scheme is based on a regularized least-squared optimization, and it shows a smooth variation of the resistivity distribution (Loke et al., 2003). The maximum depth reached by the geoelectrical sections was approximately 1.9 m. Geoelectrical models were exported to interpolation software Surfer (Golden Software Inc., 2011) to improve presentation. The used interpolation was based on a Kriging scheme, which is a geostatistical method that provides estimated values from some sampled points using a variogram model (Clark and Harper, 2000).
4. Results
Figure 4 shows six geoelectrical models computed from inversion along acquired profiles. Electrical resistivity distribution follows a similar pattern in most of them. A high resistivity shallow layer (more than 100 Ohm m) showing continuous lateral distribution is observed. Beneath this horizon a medium resistivity layer is found (around 40 Ohm•m). However, this pattern is slightly different in profile 1, located towards the north of the study area, where it is possible to observe that the high resistivity horizon is overlying a high conductivity zone (less than 4 Ohm•m) in the east part of the profile. In profiles 2, 3 and 4, a shallower horizon shows resistivity values between 100 and 2000 Ohm m, from the top until 1 m depth. At the bottom of this geoelectrical section, electrical resistivities decrease to 25 Ohm m. In the case of profiles 5 and 6, the top of the resistivity layer observed in the northern profiles is detected at 0.5 m depth. The shallow layer in this zone is a horizon showing medium resistivity values (around 40 Ohm m). Also, this feature is detected in profile 6, but it is almost imperceptible from fiducial 14 m to the east end of the profile.
5. Discussion
An isoconcentrations image combined with geoelectrical models was made in order to properly compare the available information (Figure 5). This image shows isoconcentrations in an interval from 0 to 1.3 m depth. As shown, site PM14 is below the detection limit and the resistivity values in that zone (Figure 4, profile 3) are higher than 100 Ohm•m. Nevertheless, this does not mean that hydrocarbon is absent in this zone; it is probably present in a lower concentration. In site PM11, a higher hydrocarbon concentration is reported (4145 mg/kg at 0.6 m depth). The nearest profile to this site (Figure 4, profile 4) shows resistivity values between 400 and 1000 Ohm m, but it is impossible to establish a relationship between hydrocarbon concentration and electrical resistivity distribution because the sampling site is located at the border of the line, which does not permit visualizing the continuity of the geoelectrical feature.
Profile 1 (Figure 5) is the closest to the most contaminated zone reported by site PM15. This profile shows a particular conductive feature (lower than 4 Ohm-m) from the middle of the profile to the east end. According to Atekwana et al. (2000), these low resistivity values could be related to the presence of mature hydrocarbon. However, as mentioned in Shevnin et al. (2006), this statement should be corroborated by proving that higher values of electrical conductivity are not associated with the presence of high levels of clay in the subsurface. Profiles 2 and 3 do not show strong evidence of perturbation of electrical conductivity associated with hydrocarbon contamination as in profile 1, in spite of being located in the anomalous zone depicted by chemical analyses. This behavior may be a consequence of heterogeneity in the composition of the subsoil but we must also note that the concentration distribution (Figure 5) was determined using only five samples and may not be representative.
It is difficult to establish a direct relationship between the hydrocarbon concentration and electrical resistivity variation because the ERT acquisition conditions were not the best since none of the profiles are located exactly over a sampling point that presents a significant concentration of hydrocarbon. This fact could have been improved if the chemical information had been available before geophysical data acquisition.
On the other hand, the contaminants in the subsoil could have been there for a long period of time (several years); in that case, these pollutants could have been subjected to degradation conditions until becoming mature hydrocarbons. However, due the subsoil characteristics, the suppositions on the degradation and age of hydrocarbon in the study area should be thoroughly studied.
6. Conclusions
ERT is effective in the identification of contaminated zones with medium fraction hydrocarbons. However, there must be enough information available to allow a good correlation between the resistivity values and the hydrocarbon concentrations. This information consists especially of soil samples properly located and characterized (i.e. physical, biological and chemical analyses), and a soil type analysis should be conducted to discard low resistivity values associated with clay content. The comparison between the results obtained with the hydrocarbon concentration in the soil and the geophysical models was not conclusive in the delimitation of the contaminated zone because of the lack of information to design the ERT acquisition properly. However, it was effective in showing that higher hydrocarbon concentration is related to lower resistivity values, as has been already suggested by several authors. Finally, the effectiveness of the method depends on a detailed geological characterization.
Acknowledgements
We would like to thank Grupo de Saneamiento de Suelos y Acuíferos of the Instituto de Ingeniería, UNAM, especially Rosario Iturbe and Guillermina Pérez for proposing and supporting the project, and for providing chemical information as well. Also, we thank Gerardo Cifuentes and students from Departamento de Geomagnetismo y Exploración, Instituto de Geofísica, UNAM, for their help during fieldwork. Lastly, we thank our guest editors Francisco Romero, Antonio Hernández and José Santos, as well as the anonymous reviewers for their comments to improve the manuscript.
References
Abdel Aal, G.Z., Atekwana, E.A., Slater, L.D., Atekwana, E.A., 2004, Effects of microbial processes on electrolytic and interfacial electrical properties of unconsolidated sediments: Geophysycal Research Letters, 31, 1-4. [ Links ]
Atekwana, E.A., Sauck, W.A., Werkema, D.D.Jr., 2000, Investigations of geoelectrical signatures at hydrocarbon contaminated site: Journal of Applied Geophysics, 44, 167-180. [ Links ]
Batayneh, A.T., 2005, 2D Electrical imaging of an LNAPL contamination, Al Amiriyya fuel station, Jordan: Journal of Applied Sciences, 5, 52-59. [ Links ]
Clark, I., Harper W.V., 2000, Practical Geostatistics: Alloa, Escocia, Geostokos Limited, 368 p. [ Links ]
Comisión Nacional del Agua (CONAGUA), 2003, Determinación de la disponibilidad de agua subterránea en el acuífero del Valle de Puebla, Estado de Puebla: Comisión Nacional del Agua, available on <http://www.conagua.gob.mx> [ Links ]
De la Vega, M., Osella, A., Lascano, E., 2003, Joint inversion of Wenner and dipole-dipole data to study a gasoline-contaminated soil: Journal of Applied Geophysics, 54, 97-109. [ Links ]
Flores-Márquez, E.L., Jiménez-Suárez, G., Martínez-Serrano, R.G., Chávez, R.E., Silva-Pérez, D., 2006, Study of geothermal water intrusion due to groundwater exploitation in the Puebla Valley aquifer system, Mexico: Hydrogeology Journal, 14, 1216-1230. [ Links ]
Geotomo, 2006, Manual RES2DINV Ver. 3.4: Penang, Malaysia, Geotomo Software, 132 p. [ Links ]
Godio, A., Naldi, M., 2003, Two-dimensional electrical imaging for detection of hydrocarbon contaminants: Near Surface Geophysics, 1, 131-137. [ Links ]
Golden Software Inc., 2011, Surfer 10 User's guide: Golden, Colorado, E.U.A., available on <http://downloads.goldensoftware.com/guides/Surfer10_Users_Guide_Preview.pdf> [ Links ]
Hernández-Márquez, J.O., Rodríguez-Villuendas, A., 2008, Aplicación de métodos geoeléctricos para el diagnóstico de un sitio urbano contaminado por hidrocarburos: México, D.F., México, Facultad de Ingeniería, Universidad Nacional Autónoma de México, tesis de licenciatura, 149 p. [ Links ]
Instituto Nacional de Estadística y Geografía (INEGI), 2009, Modelo digital de elevación de la República Mexicana: Instituto Nacional de Estadística, Geografía e Informática, available on <www.inegi.org.mx> [ Links ]
Iris Instruments, 2010, Syscal Pro Switch, Operation Manual: Orleans, Francia, available on <http://www.iris-instruments.com/Pdf%20file/SyscalPro_Gb.pdf> [ Links ]
Loke, M.H., 2010, Tutorial, 2D and 3D electrical imaging surveys: available on <http://www.landvizer.biz/forall/RES2DINV/CourseNotes.pdf> [ Links ]
Loke, M.H., Barker, R.D., 1996, Rapid least-squares inversion of apparent resistivity pseudosections using a quasi-Newton method: Geophysical Prospecting, 44, 131-152. [ Links ]
Loke, M.H., Acworth, I., Dahlin, T., 2003, A comparison of smooth and blocky inversion methods in 2D electrical imaging surveys: Exploration Geophysics, 34, 182-187. [ Links ]
Meju, M.A., 2002, Geoelectromagnetic exploration for natural resources: Models, case studies and challenges: Surveys in Geophysics, 23, 133-205. [ Links ]
Newmark, R.L., Aines. R.D., Hudson. G.B., Leif, R., Chirappa, M., Carrigan, C., Nitao, J.J., Elsholz, A., Eaker, C., 1999, An integrated approach to monitoring a field test of in situ contaminant destruction: Proceedings for SAGEEP, Oakland, California, U.S.A., 527-540. [ Links ]
Sauck, W.A., 1998, A conceptual model for the geoelectrical response of LNAPL plumes in granular sediments, in Proceedings of the Symposium on the Application of Geophysics to Engineering and Environmental Problems: Chicago, Illinois, U.S.A., Environmental and Engineering Geophysical Society, 805-817. [ Links ]
Secretaría de Medio Ambiente y Recursos Naturales (SEMARNAT), 2005, Norma Oficial Mexicana NOM-138-SEMARNAT/SS-2003, Límites máximos permisibles de hidrocarburos en suelos y las especificaciones para su caracterización y remediación: Diario Oficial de la Federación, available on <http://www.bdlaw.com/assets/attachments/Mexico%20-%20NOM-138.pdf> [ Links ]
Shevnin, V., Delgado-Rodríguez, O., Mousatov, A., Nakamura-Labastida, E., Mejía-Aguilar, A., 2003, Oil pollution detection using resistivity sounding: Geofísica Internacional, 42, 613-622. [ Links ]
Shevnin, V., Delgado-Rodríguez, O., Fernández-Linares, L., Zegarra-Martínez, H., Mousatov, A., Ryjov, A., 2005, Geoelectrical Characterization of an oil-contaminated site in Tabasco, Mexico: Geofísica Internacional, 44, 251-263. [ Links ]
Shevnin, V., Delgado-Rodríguez, O., Mousatov, A., Flores-Hernández, D., Zegarra-Martínez, H., Ryjov, A., 2006, Estimation of soil petrophysical parameters from resistivity data: Application to oil-contaminated site caracterization: Geofísica Internacional, 45, 179-193. [ Links ]
Siebe, C., Abrams, M., Macías, J.L., Obenholzner, J., 1996, Repeated volcanic disasters in Prehispanic time at Popocatépetl, Central México: Past key to the future?: Geology, 24, 399-402. [ Links ]
Slater, L., Binley, A., Kemna, A., 2000, Case Studies of Engineering & Environmental Applications of Induced Polarization Imaging: Proceedings of The First International Conference on the Application of Geophysical Methodologies & NDT to Transportation Facilities and Infraestructure, available on <http://2006geophysics.mst.edu/hgconproceedings/2000papers/case%20studies%20of%20engineering%20and%20environmental%20applications.pdf> [ Links ]
Sogade, J.A., Scira-Sappuzzo, F., Vichabian, Y., Shi, W., Rodi, W., Lesmes, D.P., Dale, M.F., 2006, Induced-polarization detection and mapping of contaminant plumes: Geophysics, 71, 75-84. [ Links ]

