


Serviços Personalizados
Journal

Artigo
 Inglês (pdf)
 Artigo em XML
 Referências do artigo
 Enviar este artigo por email
Indicadores
 Citado por SciELO
 Links relacionados
-
 Similares em
SciELO
Similares em
SciELO
Compartilhar

 Permalink
Boletín de la Sociedad Geológica Mexicana
versão impressa ISSN 1405-3322
Bol. Soc. Geol. Mex vol.60 no.2 Ciudad de México Jan. 2008
Artículos
Mapping Seismic Site Classes in Monterrey Metropolitan Area, northeast Mexico
Cartografía de la clasificación sísmica de sitio en el área metropolitana de Monterrey, noreste de México
Juan C. Montalvo–Arrieta1,*, Patricia Cavazos–Tovar1, Ignacio Navarro de León1, Efraín Alva–Niño1, Francisco Medina–Barrera1
1 Facultad de Ciencias de la Tierra, UANL, Ex–Hacienda de Guadalupe, Apartado Postal 104, Linares N. L. 67700, México. * montalvo@fct.uanl.mx
Manuscript received: April 25, 2008
Corrected Manuscript received: August 15, 2008
Manuscript accepted: August 08, 2008
Abstract
A first microzonation map of seismic site class distribution in Monterrey Metropolitan area is presented. This was prepared using borehole information, seismic refraction profiling and surficial geology. According to geotechnical site categories proposed by Rodriguez–Marek et al. (2001) and NEHRP soil classification (VS30), C, C1–C2 sites classes are located to the south and central of the study area. In the northwest zone, B site classes are dominant. Lowest S–wave velocity (average of 268 m/s) correspond to silts, whereas highest velocities (average 2311 m/s) are related to Cretaceous limestones. Maximum thicknesses (16 to 20 m) of the soft sediments C–C2 classes are located at the center area being correlated to two paleo–channels. This study provides an initial attempt to understand and characterize the seismic site classes in the study area.
Key words: seismic P–wave velocities, seismic S–wave velocities, borehole data, seismic microzonation, seismic refraction profiles.
Resumen
En este trabajo se presenta el primer mapa de la distribución de la respuesta sísmica de sitio en el área metropolitana de Monterrey, el cual fue preparado a partir de información de pozos, perfiles de refracción sísmica y geología superficial. De acuerdo con la clasificación geotécnica propuesta por Rodríguez–Marek et al. (2001) y la clasificación de suelos a través de VS30 del NEHRP, en la parte central y sur del área en estudio predominan los sitios clase C, C1–C2; mientras que en la zona noroeste los sitios clase B prevalecen. A partir de perfiles de refracción sísmica se determinó que los valores más bajos de propagación de ondas S (promedio 268 m/s) corresponden a limos, mientras que las velocidades más altas (promedio 2311 m/s) se correlacionan con calizas del Cretácico. Los espesores máximos de los sedimentos aluviales (16 a 20 m) se localizan en la parte central del área de estudio y se clasificaron como tipos C–C2, estos espesores se identifican con la presencia de paleocanales.
Palabras claves: Velocidades sísmicas de ondas P, velocidades sísmicas de ondas S, datos de pozos, microzonación sísmica, perfiles sísmicos de refracción.
1. Introduction
Local geological conditions may generate significant amplification of ground motion and concentrate damage during earthquakes. Usually the younger and softer soils amplify ground motion more strongly than older and more consolidated soils or bedrock. Several studies have shown the importance of the upper 30 m on the ground shaking from earthquakes (Montalvo–Arrieta et al., 2002). There are numerous works that show strong correlations between ground motion during earthquakes and average shear–wave velocity (e.g., Park and Elrick, 1998; Stewart et al., 2003). A simple way to characterize site conditions is by estimating the shear–wave velocity of shallow soils. The average velocity of the first 30 m (VS30) is a widely used parameter to predict the potential amplification of seismic shaking (Holzer et al., 2005). This parameter has been used in recent developments of building codes (BSSC, 1997; Dobry et al., 2000). A decreasing value of VS30 often correlates to an increase in amplification of earthquake ground motion, and with unconsolidated Quaternary deposits (Williams et al., 2003). Site classification obtained from shallow shear–wave velocity models is important in deriving strong–motion prediction equations (e.g., Boore et al., 1997). In areas of low seismicity and a lack of strong ground motion records, one way to classify the seismic site effect distribution is by means of the correlations between surface geology, borehole data (lithologic) and shear–wave velocity measurements. This approach was used in several areas (e.g., Tinsley and Fumal, 1985; Park and Elrick, 1998; Rodríguez–Marek et al., 2001; Stewart et al., 2003) to generate local and regional maps (Wills and Silva, 1998; Wills et al., 2000) according to site categories of the National Earthquake Hazards Reduction Program (NEHRP) and to predict amplification factors which are included in attenuation relations.
Monterrey and its metropolitan area (hereafter MMA) are located in northeast Mexico, limited by the Sierra Madre Oriental and the Gulf Coastal Plain provinces (Figure 1). Northeast Mexico is generally regarded to as a tectonically stable region, characterized by low seismicity (Figure 1) and a lack of strong ground motion records (Galván–Ramírez and Montalvo–Arrieta, 2008). In northeastern Mexico and the U.S. border region, the main historical earthquakes are the 1887 Bavispe, Sonora (MW = 7.4; Natali and Sbar, 1982), 1928 Parral, Chihuahua earthquake (MW = 6.5; Doser and Rodriguez, 1993), 1931 Valentine, Texas earthquake (MW = 6.4; Doser, 1987), and southwest Texas or Alpine earthquake in April 14, 1995, (MW 5.7; Xie, 1998; Frohlich and Davis, 2002). Although only about 5% of the global seismic energy is released in continental interiors (Talwani, 1999; Crone et al., 2003), the human impact of intraplate earthquakes justify efforts to understand and assess the potential hazards in stable regions. Galván–Ramírez and Montalvo–Arrieta (2008) made a compilation of the historical seismicity in the region.
Galván–Ramírez and Montalvo–Arrieta (2008) mentioned that a possible critical scenario would represent the rupture (MW = 6.5) of the San Marcos fault south segment in Central Coahuila. The importance of this scenario is the settlement of three of the most populated centers in northeast Mexico (Monterrey, Saltillo and Monclova with a total population of more than six million) located in a radius less than 150 km from the fault source. The damage associated to this hypothetical earthquake could be severe due to the fact that most of the buildings were constructed without seismic criteria. These authors using prediction equation by Toro et al. (1997) mentioned that, the expected Peak Ground Acceleration (PGA) values only for rock site obtained for Monterrey, Saltillo and Monclova are between 30 to 70 cm/ s2. On the other hand, this hypothetical earthquake may also produce, or trigger, significant landslides and rock falls in the Sierra Madre Oriental where parts of these cities are located. These cities, as many other urban centers in northern Mexico, have been constructed ignoring seismic criteria. Therefore, it is necessary to design policies to enforce the development of effective risk–reduction programs that include: (a) the level of expected ground shaking estimation, (b) identification of susceptible sites to ground failures, and (c) the production of geographic databases, including the previous information and population distribution, type of materials and building techniques.
The goal of this study is to generate the first distribution of seismic site conditions map for the Monterrey region. To obtain this, we used geotechnical data, seismic refraction profiles and surface geology. This study provides an initial attempt to understand and characterize the seismic site response, as well as the velocity structure, and its distribution in Monterrey city and its surrounding area.
2. Study area
The MMA is the third biggest city in Mexico, known as "the industrial capital of Mexico", with a population of about four million inhabitants (INEGI 2006). MMA is located at the borders of two tectonic provinces: Sierra Madre Oriental and the Gulf Coastal Plain (Figure 1). The Sierra Madre Oriental is a sequence of mainly carbonated and clastic marine sedimentary rocks of Late Jurassic and Cretaceous ages, complexly folded and overthrusted during the Laramide Orogeny (Gomberg et al. 1988; Dickinson and Lawton, 2001; English and Johnston, 2004). The Gulf Coastal Plain corresponds to a thick sequence of clastic sediments of Tertiary age characterized by an extensional deformation (Ortiz–Urbilla and Tolson, 2004). Therefore, the MMA morphology corresponds to a wide valley (~ 580 masl) surrounded by mountains with heights of 2100 masl. MMA population is mainly concentrated in the valley, where government offices, service facilities as well as commercial and residential areas are settled. During the last two decades, MMA has experienced an accelerated growth causing urban limits to move beyond the valley, reaching mountain toes and hillslopes (with pronounced slopes prone to landslides during rainfall season).
At present, there is a lack of an integrated work that depicts the valley geometry. The only available information is scarce and disseminated; it is based on geotechnical borehole data (Alva–Niño, 1995; Hernández–Padilla, 1995).
3. Surficial geology
As mentioned before, MMA is located at the frontal part of the Sierra Madre Oriental, North of the Monterrey salient (Padilla y Sánchez, 1982). Sedimentary rocks are composed of limestone and shale outcroppings in the valley borders and mountain ranges. Additionally, these rocks form gently hills in the valley: the La Loma Larga and Loma Linda structures (Figure 2). The first one corresponds to an anticline composed of Mendez Formation shales and San Felipe and Agua Nueva Formation limestones. The Loma Linda is composed of Mendez Formation shales and is located inside a valley delimited by the Cerro de Las Mitras and the Cerro del Topo Chico (Figure 2).
There are overlying discordantly to bedrock, alluvial and fluvial sediments of Tertiary and Quaternary ages. The valley is filled by fluvial and alluvial sediments deposited as terraces during accumulation–erosion cyclic changes (Ruiz–Martínez and Werner, 1997). The most recent sediments are deposited as riverbeds in Santa Catarina and La Silla rivers, both flowing eastward (Figure 2). Fluvial deposit thickness in the valley ranges from 18–24 meters and it is due to the presence of paleochannels as a result of meandering river courses (braided–streams). Alluvial deposits are constituted by uncemented and unweathered cobble to small pebble gravel, gravelly sand, sand and silts, locally cemented in modern washes by calcite cement.
During the construction of the first MMA subway transect (1987–1991), a geotechnical characterization was done through borehole drillings. Several caves were identified in the valley center just beneath government offices, schools and hospitals (Alva–Niño, 1995). These chemical dissolution structures are several meters in diameter and are related to karstification processes.
Based on surficial geology and morphology, the study area can be subdivided into three regions: southern, central, and northwestern. The southern and central zones are naturally separated by the La Loma Larga hill. The northwestern portion is situated between the El Cerro de las Mitras and the Cerro del Topo Chico (Figure 2). Thickness variation of unconsolidated sediments in central zone is shown by the geological cross section (A–A') constructed from borehole data (Figure 3).
The south–north oriented cross section A–A' shows with more detail the variations of the geometry due to the density of borehole data shown in Figure 2. This section is dominated by silts, alluvial and shale deposits, reaching its maximum thickness (about 20 m) between the boreholes BD7 – BD8 and BD14 – BD15. In the section extremes, the thickness layer diminish to 10 m. Alluvial deposits are composed of gravel (uncemented and partially cemented), gravelly sand and sand. Strong cementation is observed between boreholes BD18 – BD12 and in depths > 10 m (Alva–Niño, 1995). Other sites related to terraces (alluvium) occur in the southern area and near the Cerro de la Silla, where its thickness is greater than 15 m.
4. Geotechnical data
Rodriguez–Marek et al. (2001) recently proposed geotechnical classification schemes as alternative to evaluate seismic site response, based on results from the ground motion data analysis from the 1989 Loma Prieta and 1994 Northridge earthquakes. We used the site classification schemes (Table 1) proposed by Rodriguez–Marek et al. (2001) to analyse the 95 borehole data located in MMA. Figure 2 shows the distribution and classification of the boreholes. As seen in Figure 3, the Quaternary deposits are formed by silts, sands and gravels partially cemented, and in some locations clays product of the weathering of shales are present. The geologic crosses section A–A was constructed from 30 borehole data. At site BD3 the alluvial deposits are diminished due to uplift of bedrock, which according to Rodriguez–Marek classification corresponds to a site class B. The distribution of the borehole data in the central zone of the study area permits us to characterize the site conditions and distribution in MMA downtown area. Entire borehole data reach the bedrock at different depths; the maximum thickness of Quaternary sediments in the valley is 24 m. From 95 borehole data 74 correspond to site class C2 (soil depth > 6 m and < 30 m), 12 are related to site class C1 [weathered zone > 6 m and < 30 m (Vs > 360 m/s increasing to > 700 m/s)], and only 9 correspond to site class B (soil depth < 6 m). Sites C1 are located near Loma Linda and Cerro del Topo Chico hills and correspond to a diminished of the thickness of Quaternary sediments.
Additionally, we made seismic refraction profiles to obtain the seismic velocities of some sites in MMA. These shear wave velocities data permitted us to correlate surface geology, geotechnical site categories, and seismic velocity structures to develop the first seismic site classification MMA map.
5. Seismic data
Seismic velocity structure of the upper 30 m was determined at 37 locations in the MMA by using seismic refraction. Seismic refraction data were interpreted using travel–time curves (slope–intercept method). For this method, we picked first–arrival phases assumed to be refracted from the same interface, and calculated the velocity from the slope of the line connecting these phases. Velocities were computed from the line slope connecting arrivals, assuming that the velocity is constant along the profile. A RAS–24 Remote Acquisition System with 24–bit A/D conversion in a 24 channel box was used, with horizontal and vertical geophones with natural frequency of 28 Hz, and a sledgehammer as seismic source. As the study area is highly urbanized, it is difficult to obtain adequate sites for seismic refraction profiles. Thirty seven seismic refraction profiles were registered in city parks in residential areas, public land or industrial areas. Most sites were chosen to sample the primary surficial geologic units (silts, alluvium, conglomerates and bedrock formed by shales and/or limestones) with emphasis on the more populated areas.
Geophone array had variable intervals of 1.0, 2.0, 4.0, 5.0, 8.0 and 10 m, for both P and S waves, in direct and inverse profiles. These configurations were used depending on the characteristic of the site, mainly at places where we do not have information about thickness, to obtain a realistic velocity structure. Taking into account the geophone array dimension, a maximum penetration of 40 m was attained. For example, at the Hospital Universitario (PR5) located in the center of the valley, we used a geophone interval separation of 1, 5 and 8 m. Figure 4 depicts the seismograms with an interval separation of 5 m and the velocities obtained for P and S waves. Figure 5 shows the seismic velocity structure resulting (for P and S waves) the interpretation of each seismogram at PR5. At this site, four different materials were identified (silts, alluvium, fractured and unaltered shales) with the following velocities: 230, 470, 1705 and 2080 m/s for S waves, and 400, 823, 2140 and 2820 m/s for P waves (Figure 5). In this work we accept that the maximum error associated in the determination of velocities from slope methods is about 5 percent (10 % for noisy data). This range of errormay affect the accuracy of the layer thickness calculation in about 10 to 20 percent. Figure 6 shows the seismic velocity structure for the Rio Santa Catarina (PR 16) site. This location corresponds to shallow riverbed sands and gravels overlying shale bedrock. We identified only two lithologic units, fluvial deposits with velocities of 830 m/s for S waves and 1250 m/s for P waves; and shales with velocities of 1900 m/s to S waves and 3330 for P waves. We obtained seismic velocity structures (P and S waves) for all seismic refraction profiles, and we found that in almost all cases the thickness of the soil (silts, alluvium, in some places clays, and conglomerates) were less than 15 meters. The lowest velocities obtained were located at the valley centre, while the higher velocities correspond to bedrock sites (shales units). Some seismic refraction profiles were located near valley borders and hill slopes where limestones outcroppings appear (Figure 2).
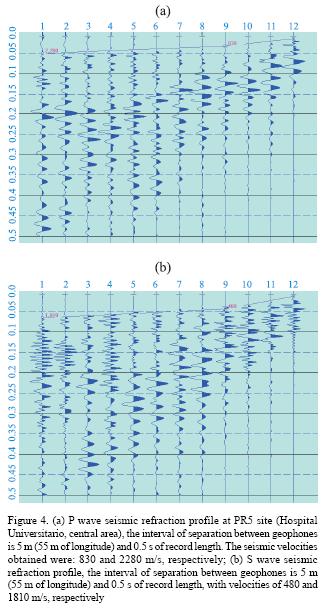
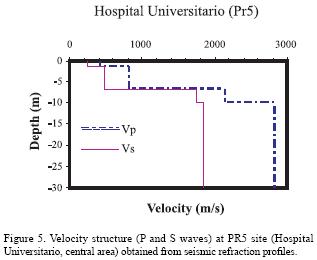
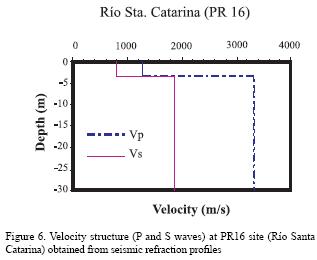
Table 2 shows the average results for P and S waves obtained from the five lithologic units: limestones, shales, conglomerates, gravels and silts, and the number of profiles in each unit. Detailed velocity structure for all seismic refraction data profiles is available in Cavazos Tovar (2007). P and S wave velocity average obtained for MMA represents the first contribution to understand the behaviour and distribution of the seismic velocities in the lithologic units (Quaternary, Tertiary, and Mesozoic) with emphasis on soil classifications. The lower velocities correspond to silt (Quaternary) with an average of 268 m/s and 433 m/s for S and P waves respectively, and the higher velocities (2311 m/s and 3684 m/s for S and P waves) are associated to the limestones (Mesozoic) that are located at the hills Cerro de Las Mitras and the Cerro del Topo Chico. The bedrock in the valley is represented by shales (Mesozoic) with mean velocities of 1774 m/s and 2783 m/s for S and P waves, whereas the alluvial deposits have mean velocities of 632 m/s and 1064 m/s for S and P waves.
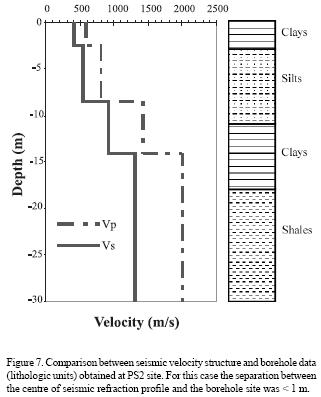
We measured some seismic profiles near the boreholes. Thicknesses determined from seismic velocity structure are very close to the borehole data lithologic description. Therefore, P and S wave velocities of surficial material can be correlated to the same type of material at depth. Figure 7 compares the seismic velocity structure to the borehole data for PS2 site. A seismic refraction profile was carried out near the borehole (< 1 m for the site), at this site the velocity structure for P and S waves was determined obtaining four layers composed of clays–silts and clay–shales. The velocity structure generated through seismic refraction profile, show that the seismic velocity variations are concordant with thickness and lithology changes reported in borehole descriptions. Also, the sediment consolidation degree increases with depth in the same way as the seismic velocity gradient increases (Figure 7). This process of sediment consolidation is due to calcite cementation of alluvium (caliche) which generates increases in seismic velocities in Quaternary alluvium. Similar behaviour between increases of seismic velocities and lithologic units with cementation were reported in other areas near MMA by Montalvo–Arrieta et al. (2005), where alluvium and conglomerated have mean values of 559 and 1220 m/s for S–waves and 957 and 2471 m/s for P–waves respectively. The increase of the seismic velocity with depth is verified with seismic tomography in three boreholes in the Linares area (Piccioto–Fernandez, 2000). This author obtained three velocity structures (P waves) for each borehole using a "sparker" source located at different depths in boreholes that cut shales of Mendez Formation. Piccioto–Fernandez's results show an increase of seismic velocity of 3200 m/s at 10 m to 5400 m/s at a depth of 45 m, for MMA the range of seismic waves for the Mendez Formation are 1200 to 2500 for S waves and 2140 to 3750 for P waves.
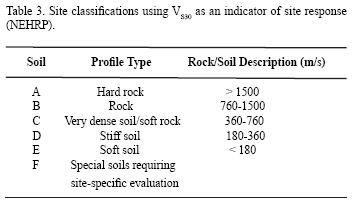
According to NEHRP building codes, soil conditions were classified in six different groups (Table 3). As mentioned by Holzer et al. (2005), this classification is widely used in the United States and has been incorporated into many buildings codes around the world. In this work, NEHRP classification scheme has been used to estimate the average shear–wave velocity (VS30) as indicator of site response:
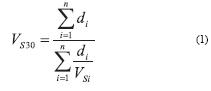
Where di is the thickness of the ith layer between 0 and 30 m and VSi is the shear–wave velocity layer in the ith layer (Borcherdt, 1994; Williams et al., 2003; Boore, 2004). The two main limitations of seismic refraction profiles interpretation techniques are: an assumption that layer velocity is constant across the length of the profile, and lower velocity layers underlying a high velocity layer can be detected, but no measured. However, in spite of these assumptions several authors have shown agreement with seismic velocity downhole profiles, determined from measurements in shallow boreholes in California and Memphis, Tennesse (Williams et al., 1997; Williams et al., 2003). For northeast Mexico, Montalvo–Arrieta et al. (2005) and Piccioto–Fernandez (2000) have found evidence in the Linares area (region with similar geological conditions as MMA) that the seismic velocities are increased with depth due to the characteristics of the geologic units buried trough surficial seismic refraction profiles and seismic tomogr in boreholes. So, although VS30 is not the only parameter to define seismic site response, it can be used in an attempt to understand and characterize the seismic site response, well as the velocity structure in an area with scatter seismic information as MMA.
We estimated the VS30 values of 37 seismic refraction profiles to obtain the seismic site class distribution according to NEHRP and correlated to the site geotechnical class obtained from borehole data, to generate the first seismic site class distribution map for MMA. The VS30 values for each seismic refraction profile were obtained from the seismic velocity structure generated by every seismic profile (e.g. Figures 5, 6 and 7) using equation (1). There are good correlations between the VS30 values and the geotechnical classification. Figure 7 shows the comparison between borehole data and seismic refraction profile at PS2 site, VS30 data correspond to site class C (VS30 = 716 m/s) and the borehole data have a C2 geotechnical classification (soil thickness equals 16 m).
6. Map of seismic site classes in MMA
Figure 8 shows the first seismic site distribution map for MMA in the upper 30 m. It was prepared by the interpolation of seismic refraction data (VS30) and borehole data (Rodriguez–Marek's geotechnical classification) in geologic maps (CETENAL, 1976) scale 1:50,000. We assigned the average VS30 (site class A NEHRP) obtained for limestones in Cerro de Las Mitras to the Loma Larga, Cerro del Topo Chico and Cerro de La Silla where the same type of rock outcropped. This information was integrated into the Geographic Information System (GIS). We found a good correlationbetween VS30 values, geotechnical classification, and the soil units description.
The low velocity sites (VS30 = 471 m/s) are related to alluvial debris thick horizons and recent soils which correspond to C site class materials. In the southern part, a small area with site class C2 was identified in front of the Monterrey salient. This spot is characterized by the accumulation of materials eroded from ranges (alluvial fans). The same case is found in the northwest of Cerro de la Silla, where three boreholes correspond to site class C2. The more extensive zone corresponds to the central area (downtown), where low VS30 values and geotechnical site classes C1–C2 were obtained from borehole data and correlated to alluvial and fluvial deposits. These yield the maximum thickness of the Quaternary sediments (soil depth > 6 m and < 30 m). The northwestern area represents the accumulation of alluvial material originated from the Las Mitras and Topo Chico ranges. In this portion, the site class B is predominant due to a thin layer of unconsolidated sediments (gravel partially cemented).
By contrast, the high VS30 velocities (760 – 2200 m/s) were determined in all three areas where shallow bedrock is present, e.g. near mountains, suggesting thick sequences of well–graded large clasts, such as boulders or cobbles, or very weak and fractured rock near the surface. The site classification for these places is A/B. Other places with these characteristics occur near both rivers where the loose sediments have thickness less than 5 m.
Recently, Montalvo–Arrieta et al. (2008) used the seismic velocity structures obtained from seismic refraction profiles and the thickness of the borehole data presented here, to obtain 1D seismic site response and compare them with spectral ratios H/V of microtremors recordings. They found the maximum spectral amplitudes between 3 to 6 times, which are related with a range of frequencies of 3 to 6 Hz respectively.
7. Conclusions
In this work, a first seismic soil classification map is presented for building purposes in MMA through VS30 and geotechnical seismic site classes. The presence and distribution of materials susceptible for ground shaking amplification are identified through the integration of seismic refraction profiling correlated to borehole information.
A seismic velocity classification for different lithologic units outcropping in the study area (silts, alluvium, conglomerates, shales and limestones) has been integrated for the first time. The lowest values of S waves (average of 268 m/s) correspond to silts, whereas the highest velocities (average 2311 m/s) are related to Cretaceous limestones. According to NEHRP and geotechnical soil classification, A, B, C–C2 site classes are predominant in MMA. C and C2 sites classes are located in the central part and at some places in the southern area. In the northwest zone A and B site classes are dominant, which are correlated to hard rock and rock. Maximum thicknesses (16 to 24 m) of the soft sediments class C2 are observed in MMA downtown, being correlated to paleo–channels.
As observed in Figure 8, in the central area of the MMA valley the seismic site response (NEHRP and geotechnical classification) corresponds to site classes C–C2. The lowest VS30 values are above 471 m/s and are linked to geotechnical classification C1–C2 class that correspond to soils with depth > 6 m and < 30 m. These high values of VS30 are a result of a cementation of alluvium by calcite (a.k.a. caliche). The lowest values of VS30 in MMA correspond to site class C (VS30 = 360 – 760 m/s), which are correlated to recent soils and Quaternary alluvium.
8. Acknowledgments
We are grateful to Mario Ordaz and anonymous reviewer for the critical comments on the manuscript that helped improve it. Thanks to M. M. González–Ramos for the critical reading of the manuscript and various useful remarks. This research has been partially supported by Apoyo a la Incorporación de Nuevos PTC under project PROMEP/103.5/03/2552, PAICYT CT877–04 and CONACYT 25637.
9. References
Alva–Niño, E, 1995, Datos base y metodología para la elaboración de una carta ingeniero–geológica de la zona metropolitana de Monterrey, N. L., México: Facultad de Ciencias de la Tierra, Universidad Autónoma de Nuevo León, bachelor's thesis. [ Links ]
Boore, D.M., 2004, Estimating (or NEHRP site classes) from shallow velocity models (depths < 30 m): Bulletin of the Seismological Society of America, 94, 591–597. [ Links ]
Boore, D.M., Joyner, W.B., Fumal, T.E., 1997, Equations for estimating horizontal response spectra and peak acceleration from western North America earthquakes: a summary of recent work: Seismological Research Letters, 68, 128–153. [ Links ]
Borcherdt, R.D., 1994, Estimates of site–dependent response spectra for design (methodology and justification): Earthquake Spectra, 10, 617–653. [ Links ]
Building Seismic Safety Council (BSSC), 1997, NEHRP Recommended Provisions for Seismic Regulations for New Buildings, Part 1–Provisions, (FEMA 302): Washington, DC, Federal Emergency Management Agency, 290 p. [ Links ]
Cavazos Tovar, N.P., 2007, Microzonación de la ciudad de Monterrey, N. L., basada en geología y velocidades de propagación de ondas sísmicas: Facultad de Ciencias de la Tierra, Universidad Autónoma de Nuevo León, bachelor's thesis. [ Links ]
CETENAL, 1976, Carta Geológica, Hoja Hidalgo G14C15, 1:50,000 scale. [ Links ]
CETENAL, 1976, Carta Geológica, Hoja Apodaca G14C16, 1:50,000, scale. [ Links ]
CETENAL, 1976, Carta Geológica, Hoja Garza García G14C25, 1:50,000, scale. [ Links ]
CETENAL, 1976, Carta Geológica, Hoja Monterrey G14C26, 1:50,000, scale. [ Links ]
Crone, A.J., De Martini, P.M., Machette, M.N., Okumura, K., Prescott, J., 2003, Paleoseismicity of two historically quiescent faults in Australia: implications for fault behavior in stable continental regions: Bulletin of the Seismological Society of America, 93, 1913–1934. [ Links ]
Dobry, R., Borcherdt, R.D., Crouse, C.B., Idriss, I.M., Joyner, W.B., Martin, G.R., Power, M.S., Rinne, E.E., Seed, R.B., 2000, New site coefficients and site classification system used in recent building seismic code provisions: Earthquake Spectra, 16, 41–67. [ Links ]
Dickinson, W.R., Lawton, T.F., 2001, Carboniferous to Cretaceous assembly and fragmentation of Mexico: Geological Society of America Bulletin, 113, 1142–1160. [ Links ]
Doser, D.I., 1987, The 16 August 1931 Valentine, Texas, earthquake: evidence for normal faulting in west Texas: Bulletin of the Seismological Society of America, 77, 2005–2017. [ Links ]
Doser, D.I., Rodriguez, J., 1993, The seismicity of Chihuahua, Mexico, and the 1928 Parral earthquake: Physics of the Earth and Planetary Interiors, 78, 97–104. [ Links ]
English, J.M., Johnston, S.T., 2004, The Laramide Orogeny: what were the driving forces?: International Geology Review, 46, 833–838. [ Links ]
Frohlich, C., Davis, S.D., 2002, Texas earthquakes: Springer–Verlag. [ Links ]
Galván–Ramírez, I.N., Montalvo–Arrieta, J.C., 2008, The historical seismicity and prediction of ground motion in Northeast Mexico: Journal of South American Earth Sciences, 25, 37–48. [ Links ]
Gomberg, J.S., Priestley, K.F., Masters, T.G., Brune, J.N., 1988, The structure of the crust and upper mantle of northern Mexico: Geophysical Journal International, 94, 1–20. [ Links ]
Hernández–Padilla, M, 1995, Investigaciones geológicas e hidrogeológicas del área metropolitana de Monterrey, Nuevo León, México: Facultad de Ciencias de la Tierra, Universidad Autónoma de Nuevo León, bachelor's thesis. [ Links ]
Holzer, T.L., Padovani, A.C., Bennett, M.J., Noce, T.E., Tinsley III, J.C., 2005, Mapping NEHRP VS30 site classes: Earthquake Spectra, 21, 161–177. [ Links ]
Instituto Nacional de Estadística Geografía e Informática (INEGI), XII censo de población y vivienda 2006: http://www.inegi.gob.mx [ Links ]
Montalvo–Arrieta, J.C., Sánchez–Sesma, F.J., Reinoso, E., 2002, A virtual reference site for the Valley of Mexico: Bulletin of the Seismological Society of America, 92, 1847–1854. [ Links ]
Montalvo–Arrieta, J.C., Quintanilla, Y., Tamez, A., Meneses, M., Ramos, L., Masuch, D., 2005, Microzonation of Linares region (northeast Mexico), based on geology and shear–wave velocity (VS30): Geofísica Internacional, 44, 331–340. [ Links ]
Montalvo–Arrieta, J.C., Yutsis, V., Krivosheya, K., Gómez, J.M., López–Barboza, S.L., Navarro de León, I., 2008, Seismic site effects and geometry of the subway line 2 Monterrey, Mexico base on microtremors, gravity and borehole data. En revisión. [ Links ]
Natali, S.G., Sbar, M.L., 1982, Seismicity in the epicentral region of the 1887 northeastern Sonora earthquake, Mexico: Bulletin of the Seismological Society of America, 72, 181–196. [ Links ]
Ortíz–Urbilla, A., Tolson, G., 2004, Interpretación estructural de una sección sísmica en la región Arcabuz–Culebra de la Cuenca de Burgos, NE de México: Revista Mexicana de Ciencias Geológicas, 21, 226–235. [ Links ]
Padilla y Sánchez, R.J., 1982, Geologic evolution of the Sierra Madre Oriental between Linares, Concepción del Oro, Saltillo and Monterrey, México: Austin, Texas, University of Texas, doctoral thesis. [ Links ]
Park, S., Elrick, S., 1998, Predictions of shear–wave velocities in southern California using surface geology: Bulletin of the Seismological Society of America, 88, 677–685. [ Links ]
Piccioto–Fernandez, A.R., 2000, Análisis de datos de tomografía sísmica en un medio anisotrópico: Facultad de Ciencias de la Tierra, Universidad Autónoma de Nuevo León, bachelor's thesis. [ Links ]
Ruiz–Martínez, M.A., Werner, J., 1997, Research into the Quaternary sediments and climatic variations in NE Mexico: Quaternary International, 43–44, 145–151. [ Links ]
Rodríguez–Marek, A., Bray, J.D., Abrahamson, N.A., 2001, An empirical geotechnical seismic site response procedure: Earthquake Spectra, 17, 65–87. [ Links ]
Stewart, J.P., Liu, A.H., Choi, Y., 2003, Amplification factors for spectral acceleration in tectonically active regions: Bulletin of the Seismological Society of America, 93, 332–352. [ Links ]
Talwani, P., 1999, Fault geometry and earthquakes in continental interiors: Tectonophysics, 305, 371–379. [ Links ]
Tinsley, J.C., Fumal, T.E., 1985, Mapping quaternary sedimentary deposits for areal variations in shaking response, in Ziony, J.E. (ed), Evaluating Earthquake Hazards in the Los Angeles Region. An Earth–Sience Perspective: U.S. Geological Survey Professional Paper 1360, 101–126. [ Links ]
Toro, G.R., Abrahamson, N.A., Schneider, J.F., 1997, Model of strong ground motion from earthquakes in central and eastern North America: best estimates and uncertainties: Seismological Research Letters, 68, 41–57. [ Links ]
Wills, C.J., Silva, W., 1998, Shear wave velocity characteristics of geologic units in California: Earthquake Spectra, 14, 533–556. [ Links ]
Wills, C.J., Petersen, M., Bryant, W.A., Reichle, M., Saucedo, G.J., Tan, S., Taylor, G., Treiman, J., 2000, A site–conditions map for California based on geology and shear–wave velocity: Bulletin of the Seismological Society of America, 90, 187–208. [ Links ]
Williams, R.A., Stephenson, W.J., Odum, J.K., Worley, D.W., 1997, High–resolution surface–seismic imaging techniques for NEHRP soil profile classification and earthquake hazards assessments in urban areas: U.S. Geological Survey Open–File Report, 97–501, 43 pp. [ Links ]
Williams, R.A., Wood, S., Stephenson, W.J., Odum, J.K., Meremonte, M.E., Street, R., Worley, D., 2003, Surface seismic refraction/reflection measurement determinations of potential site resonances and the areal uniformity of NEHRP site class D in Memphis, Tennessee: Earthquake Spectra, 19, 159–189. [ Links ]
Xie, J., 1998, Spectral inversion of Lg from earthquakes: a modified method with applications to the 1995, Western Texas earthquake sequence: Bulletin of the Seismological Society of America, 88, 1525–1537. [ Links ]

