


Serviços Personalizados
Journal
Artigo
 texto em
  Inglês (pdf)
 Artigo em XML
 Referências do artigo
 Enviar este artigo por email
Indicadores
-
 Citado por SciELO
 -
 Acessos
Links relacionados
-
 Similares em
SciELO
Similares em
SciELO
Compartilhar

 Permalink
Agrociencia
versão On-line ISSN 2521-9766versão impressa ISSN 1405-3195
Agrociencia vol.52 no.5 Texcoco Jul./Ago. 2018
Crop science
Maize (Zea mays L.) yields under climate change scenarios in the region of La Antigua, Veracruz, Mexico
1 INIFAP. Campo Experimental Cotaxtla. Km. 3.5 Carretera Xalapa-Veracruz. Colonia Ánimas. Xalapa, Veracruz-México. C.P.91190. (guajardo.rafael@inifap.gob.mx).
2 UNAM. Instituto de Geografía. Circuito Exterior s/n. Cd. Universitaria. Del. Coyoacán. México, D.F.-México. C.P. 04510. (rebeca@igg.unam.mx)
3 INIFAP-RASPA. Canal Sacramento Km. 6.5. Zona Industrial 4ta Etapa. Gómez Palacio, Durango-México. C.P. 35140. (sanchez.ignacio@inifap.gob.mx)
4 UNAM. Instituto de Ecología. Circuito Exterior s/n. Cd. Universitaria. Del. Coyoacán. México, D.F.-México. C.P. 04510. (vbarrada@ecologia.unam.mx)
5 UNAM. Colegio de Geografía. Circuito Exterior s/n. Cd. Universitaria. Del. Coyoacán. México, D.F.-México. (jcfilos@gmail.com)
6 INIFAP. Campo Experimental Cotaxtla. Km. 3.5 Carr. Xalapa-Veracruz. Col. Ánimas. Xalapa, Veracruz-México. C.P.91190. (diaz.gabriel@inifap.gob.mx)
Climate change will modify the production and distribution of plant species, which is why implementing adaptation plans to minimize its effects, as well as to reduce impacts on food security, should be considered. This study assessed the variation of maize (Zea mayz L.) yields under rainfed conditions under climate change scenarios, for the spring-summer cycle in the period of 2011 to 2030, in the Rural Development District of La Antigua, Veracruz, Mexico. The possible variations in maize production concerning current climate conditions were analyzed in areas with favorable conditions for the development of this crop. The logical-spatial coherence and homogeneity were verified with daily records of precipitation and temperature from 40 climatological stations of the National Meteorological Service. Missing data were estimated with ClimGen, climate series were generated with Lars WG, crop yields were evaluated for scenarios A1B, A2 and B1 using a water balance simulation model (SICTOD), and the potentially vulnerable zones were defined through spatial interpolation of yields. Maize yields in the RDD La Antigua for each climate change scenario were different from the present ones (p = 0.666); in the spatial scope, they could affect 7 % of the surface with conditions for maize production under scenario B1. Under the scenarios A1B and A2, 94 % of the surfaces with conditions for maize production would be affected. Yields can be maintained, but they could come to vary in space. The information can be used to develop projects of climate change adaptation, with the participation of agricultural producers, climate change managers, or others, with actions like crop substitution and new varieties, and to reprogram agricultural tasks.
Key words: yields; agricultural risk; climate change; maize; Rural Development District La Antigua
El cambio climático modificará la producción y la distribución de las especies vegetales, por lo cual deberá considerarse la implementación de planes de adaptación para minimizar sus efectos y la reducción de impactos a la seguridad alimentaria. En este estudio se cuantificó la variación de rendimientos de maíz (Zea mays L.) en condiciones de secano en el ciclo primavera-verano bajo escenarios de cambio climático en el periodo de 2011 a 2030, en el Distrito de Desarrollo Rural de La Antigua, Veracruz, México. Las variaciones posibles en la producción de maíz con respecto a las condiciones climáticas actuales se analizaron en áreas con condiciones propicias para el desarrollo de este cultivo. La congruencia lógico-espacial y homogeneidad se verificó con los registros diarios de precipitación y temperatura de 40 estaciones climatológicas del Servicio Meteorológico Nacional. Los datos faltantes se estimaron con ClimGen, series climáticas se generaron en LarsWG, los rendimientos se evaluaron en los escenarios A1B, A2 y B1 en SICTOD y las zonas potencialmente vulnerables se definieron mediante interpolación espacial de rendimientos. Los rendimientos de maíz en el DDR La Antigua, para cada escenario de cambio climático, fueron diferentes que los actuales (p = 0.066); en el ámbito espacial podrían afectar 7 % de la superficie con condiciones para la producción de maíz en el escenario B1. En los escenarios A1B y A2 se afectaría 94 % de las superficies con condiciones para la producción de maíz. Los rendimientos pueden mantenerse, pero podrán llegar a variar en el espacio. La información puede utilizarse para desarrollar proyectos de adaptación al cambio climático, con la participación de productores agrícolas, gestores en cambio climático, u otros, con acciones, como la sustitución de cultivos y variedades nuevas, y recalendarizar las labores agrícolas.
Palabras clave: rendimientos; riesgo agrícola; cambio climático; maíz; Distrito de Desarrollo Rural La Antigua
Introduction
Agricultural production is defined by factors of the physical environment, such as relief, soil and climate; in the latter, factors like temperature and precipitation are included, which can be defining in the yields, primarily in extreme and atypical events (Ojeda-Bustamante et al., 2011). The simultaneous impact of the natural variability of climate and climate change on agricultural activity is a risk to food security (Velasco et al., 2015). The threat of changes in climate is now recognized, from the impacts that agricultural production can generate and conditioning from the duration, frequency and intensity of rain and extreme temperature events. This shows the need to reevaluate the adaptation capacity of productive systems and their effect in sequence on the economic and social sectors (Wreford et al., 2010). The effects of climate change will be diverse between regions of the planet (Conde et al., 2004), but they will affect negatively and the seriousness of the effects will depend on the measures taken for mitigation and adaptation.
In dryland agriculture, the precipitation, among other variables in the spring-summer cycle, defines the soil moisture regime and the evapotranspiration of crops (Allen et al., 2006) as well as their productivity (Dirmeyer et al., 2009). In addition, the temperature influences the development of any crop and plant species; most can subsist between 0 and 32 °C, although each has specific requirements for their growth and development, which define the thermo-pluviometric thresholds of the plants. These thermal thresholds include the minimum, maximum and optimal temperatures for development. Each phenological stage has its own requirements of temperature and humidity; in the case of the optimal temperature for seed germination, it is frequently lower than the optimal temperature for vegetative development (Ortiz, 1984). This leads to evaluate the optimal hydric conditions of the crops, which may be through the soil water balance and taking into consideration the distribution, variability and changes of precipitation and the effect of temperature, which are reflected in the evapotranspiration and physical characteristics of the soil (Pántano et al., 2014). Water management, based on predictions or climate scenarios, allows maintaining the economic, social and food security of the country.
In Mexico, agricultural planted areas suffer the effects of adverse meteorological events such as drought. In 2012, the worst drought in seven decades took place, generating losses of nine thousand million pesos in maize crops (Reuters, 2012). In 2011, in the north of the country at least one million hectares were affected, primarily with crops such as maize, bean, wheat, sorghum, potato, vegetables and citrus trees; and losses were over 45 thousand million pesos (El Financiero, 2011). Extreme climatological events also affect the productive capacity and the loss of employment in rural areas.
The Mexican Sustainable Rural Development Law, published in the Official Journal of the Federation (2001), establishes that maize is a basic and strategic product for food security. According to the Service of Agrifood and Fishing Information (Servicio de Información Agroalimentaria y Pesquera, SIAP, 2015), in 2014 grain maize was sown in Mexico on 5.7 million dryland hectares in the spring-summer (SS) cycle. The states of Chiapas and Jalisco concentrate 10.3 and 8.8 % of the surface sown. The states with highest losses of this crop were Tamaulipas, Quintana Roo and San Luis Potosí, with 41, 33 and 22 % of surface damaged, respectively. The causes for crop damages in these states are unknown, but they are attributed to droughts in the north and excessive rains in the southeast of the country. Therefore, the hypothesis of this study was that changes in climate patterns represented by scenarios A1B, A2 and B1 of the Intergovernmental Panel on Climate Change (IPCC) will affect the yield of maize crop in the study region. The objective of this study was to identify and assess the changes in maize crop yields in potential rainfed areas, since 2011 and projected through 2030, in the Rural Development District (RDD) of La Antigua, Veracruz, Mexico, under climate change scenarios A1B, A2 and B; and to verify whether there is the possibility of changing these scenarios.
Materials and Methods
The RDD of La Antigua, Veracruz (19 ° 09’ and 19 ° 57 ’ N and 93 ° 13 ’ and 96 ° 47’ W) (Gobierno del estado de Veracruz, 2009; INEGI, 2014), is made up of the municipalities of Actopan, Alto Lucero de Gutiérrez Barrios, La Antigua, Paso de Ovejas, Úrsulo Galván and Puente Nacional. The area of influence generated was 20 km, in relation to the political limit of the RDD, to have support stations. The meteorological stations selected are managed by the National Meteorological Service (Servicio Meteorológico Nacional, SMN), and the information was obtained with the application developed for Google Earth (CONAGUA-SMN, 2014); more than 5000 climatologic stations are displayed with the application, of which 3,200 are in operation (CNA-SMN, 2010). The information was extracted in “kmz” format and exported to “shape” format to ease its management in Geographic Information Systems (GIS).
Through review and standard normal homogeneity tests (SNHT), Pettitt and Buishand (Hainie and Mohd, 2013), it was found that the information from the stations was enough, complete, coherent and homogeneous. The variables used were daily records of maximum temperature (Tmax), minimum temperature (Tmin), and precipitation (Pp) from 40 CONAGUA climate stations. The characteristics were: 1) having at least 25 years of information, 2) not having more than 20 % of the information missing from its historical record, and 3) having information prior to the year 2000. In addition, the spatial coherence of the information was verified through the implementation of routines developed in Visual Basic and stored in Excel macros, to detect atypical or out-of-the-ordinary records, such as: negative Pp, Tmax lower than Tmin, Tmin higher than Tmax, and records on invalid dates (leap years). Estévez and Gavilán (2008) based a process of spatial validation on the norm UNE 500540: 2004 (UNE, 2004) and description. The method consisted in calculating confidence intervals for each climate variable, from each station. Five neighboring stations, located in the same climate stratum, were identified at less than 20 km of distance; each record of Tmax, Tmin and Pp from these stations was checked against the confidence intervals and the record that did not influence the interval and did not fulfill the criteria already described were considered missing data.
The trial version of the XLSTAT program (Addinsoft, 2014) was used to verify the assumption of homogeneity of Tmax, Tmin and Pp, through Normal Standard Homogeneity (SNHT), Pettitt and Buishand. This allowed classifying into three groups in a concentrate of stations (Schonwiese and Rapp, 1997; Wijngaard et al., 2003): stations with reliable, semi-reliable and unreliable information. The first two were used in the study.
The missing data were estimated with the ClimGen software (Stöckle and Nelson, 2014) and included rainfall, temperature, solar radiation, among others. The software is of free access and requires daily climate information to calculate the parameters needed for data generation. This software is used to establish the climate normal in some states of the country (Díaz et al., 2006) and to study the space-time variation of rainfall spells (Díaz et al., 2011). The precipitation data generated are based on two assumptions (Carbajal et al., 2010): the condition of rain precipitation in a day (i) is related to the condition of precipitation of the previous day (i - 1); this assumption is known as Markov’s chain model, where P(W/W) is the conditional probability that it will rain on day i given that the previous day (i - 1) it rained and P(W/D) is the probability that it rained on day i given that the previous day it didn’t rain (i - 1). Therefore, P(D/W) = 1 - P(W/W) is defined as the probability that day i it will rain given that the previous day it did rain (i - 1) and P(D/D) = 1 - P(W/D) is the probability that one day it will not rain given that on the previous day (i - 1) it did not rain (Stöckle and Nelson 2014). ClimGen requires at least 25 years of information on precipitation and 10 years of minimum and maximum temperature to estimate missing information.
The scenarios for CO2 emission considered in this process (Table 1) were the ones proposed by the IPCC in its fourth statement (IPCC, 2000):
Table 1 Description of climate change scenarios based on IPCC’s fourth assessment.
| A1B | A2 | B1 | |
| Crecimiento de la población | Bajo | Alto | Bajo |
| Crecimiento económico | Muy alto | Medio | Alto |
| Uso de energía | Muy alto | Alto | Alto |
| El ritmo en los cambios de la tecnología | Rápido | Lento | Medio |
| Cambios tecnológicos favorables | Opciones energéticas balanceadas | Varía por región | Recursos limpios y eficientes |
| Conciencia ambiental | Bajo | Varía por región | Alto |
| Enfoque de equidad social | Bajo | Varía por región | Alto |
| Escala | Global | Local / Regional | Global |
In the estimation of current climate data and of the immediate future (2011 to 2030), for scenarios A1B, A2 and B1 (Suescun, 2012), the LarsWG software was used (Semenov and Barrow, 2002). This includes scenarios based on 15 global climate models used in the IPCC’s Fourth Evaluation Report (IPCC, 2008). From the 40 original databases of Tmax, Tmin and Pp, the missing data were estimated and for the current scenario, climate series were generated for each climate scenario based on the information from the same 40 stations. Thus, the total was 160 databases with complete information of Tmax, Tmin and Pp. Descriptive statistics and transition matrixes only of the Pp variable were applied to these variables.
To quantify the impact, the SICTOD computer software, developed by Sánchez et al. (2015), was used. This software quantifies the variables of moisture balance in the soil from the daily information of historical records, crop of interest, soil characteristics in the agricultural zone, date of sowing, and length of the crop’s growing period (Sánchez, 2013). The daily balance was carried out with the initial or antecedent moisture in the soil (ΔSi) in a control point, and inclusion in the system of: precipitation (Ppi), runoff (Qi), capillary action (δi) and deduction from loss by evapotranspiration (Et), deep percolation (Z) and runoff outside the cropped area (Q0) (Sánchez, 1994 and De Santa O. et al., 2005). This balance is summarized in the following equation.
With this information, yields based on the evapotranspiration deficit were estimated. The evapotranspiration was estimated with the precipitation information from each of the 40 stations in the climate change scenarios, showing the maximum yield expected, according to the history, under ideal rainfed conditions for the crop. The information was included in worksheets to incorporate into GIS.
Georeferencing of the yield tables, in the system of geographic coordinates and datum WGS84, was done with the ArcMap software (ESRI, 2011). The spatial interpolation of current yields and those associated to each climate change scenario was performed with the Inverse Distance method (IDW). This method is important because of its application in the GIS and because it weighs by distance. This weighing, when having a quadratic factor, receives a rather strong influence from the rain value of the nearest stations and when considering a series or variety of estimation points it can form concentric grouping of the amounts estimated around the stations (Pizarro et al., 2003). The general formula to perform the interpolation process is:
where pe: value estimation in point i; pi: value observed in the station i; wi: weight assigned to the station i; and N: total number of stations near point e. The weight (wi) is calculated as:
where β: coefficient of potency, and de,i: distance between the site to be estimated e and the station i.
Calculating the difference between the layer of current yields and the layers of yields under conditions of climate change was carried out with a map algebra process. As a result, three layers were obtained that express the trend of yields under climate change scenarios; the positive values indicated a decrease in yields and the negative ones an increase. These values are reclassified to identify patterns of change on the maps; the negative values were assigned the label “increase”, the positive values were assigned the label “decrease”, and the values 0 were assigned the label “without change”. Through ANDEVA it was determined whether there were significant differences between yields under the present scenario and the climate change scenarios, with a completely random design.
The spatial patterns in the change of yields were defined based on the potential areas for maize production established by Díaz et al. (2012), through the delimitation of favorable conditions of precipitation, temperature, soils and topography. The degree of affectation of these areas was determined under conditions of climate change.
Results and Discussion
Out of the 40 climatological stations, 32 fulfilled the conditions of minimum information necessary and 28 of these, according to results from homogeneity tests, showed valid information for the study. With α = 0.10 there were significant differences between the current yields and those estimated under the climate change scenarios (p = 0.066). The multiple comparison tests showed that the yields from scenario A1B (p = 0.019) and A2 (p = 0.082) would be significantly lower than the rest of the scenarios. The Tukey tests (α = 0.10) indicated that the yields from scenario A1B could be significantly lower than the rest (p = 0.065) (Figure 1).
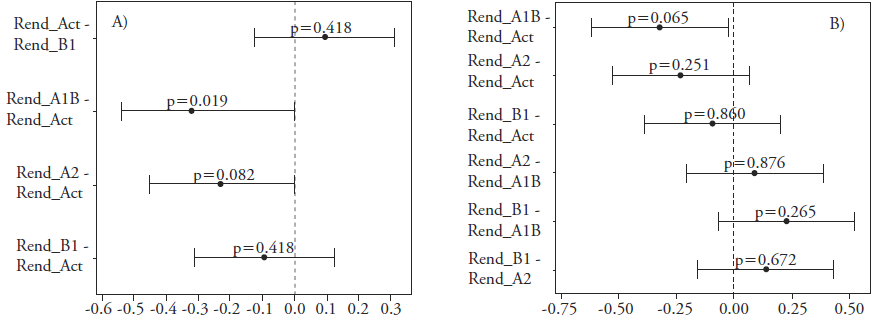
Figure 1 Simultaneous confidence intervals of minimum significant difference (A) and Tukey (B) for current yields and under climate change scenarios.
Under favorable rainfed conditions, in the current scenario, for maize development in the RDD of La Antigua and adequate management, the yields could be 3.5 to 4.0 t ha-1. Under A1B climate change conditions the yields can vary between 3.0 and 3.7 t ha-1, and would represent a decrease of 10 to 14 %. The effects in scenarios B1 and A2 could lead to the production of 3.4 to 3.9 t ha-1 and 3.1 to 3.8 t ha-1, with a decrease of 5 and 5.7 %, lower than in scenario B1 (7.5 and 11 % less for scenario A2) (Figure 2). These values are lower than those estimated by Conde et al. (2000) for Coatepec, with the model GFDL-R30, which indicated -30.68 % with the CO2 effect and -26.86 % without it. The information in different climate change scenarios showed that the variation in yields is due to the combined effect of seasonality of precipitation and temperature, and because climate change can show different behaviors in zones of the humid tropics, compared to other zones.
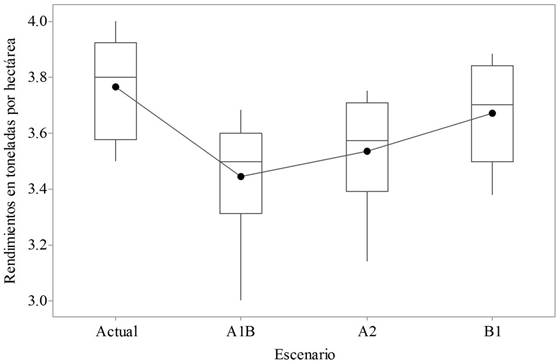
Figure 2 Average variation of maize yields through the different climate change scenarios in the RDD La Antigua, Veracruz, Mexico.
The B1 scenario in the RDD La Antigua showed that 93 % of the surface cultivated has high productive potential; however, the yield could be reduced slightly. The same behavior would be expected in scenario A1B, since out of the 16,918 ha with productive potential, 94 % will present reduction. In the same scenario, of the 78,343 ha with medium productive potential, 88 % of the surfaces could present a decrease in yields (Table 2).
Table 2 Surfaces of productive potential of maize affected under different climate change scenarios in the RDD La Antigua, Veracruz, Mexico.
| Escenario |
Potencial
productivo |
Tendencia de
rendimientos |
Superficie afectada por
condiciones de cambio climático |
Disminución de
rendimientos kg ha-1 |
||
| Actual | ha | ha | % | |||
| A1B | Alto | 16 918 | ↓ | 15 963 | 94 | 154.35 - 154.75 |
| Medio | 78 343 | ↓ | 69 040 | 88 | 361.54 - 361.68 | |
| A2 | Alto | 16 918 | ↓ | 15 963 | 94 | 113.74 - 114.01 |
| Medio | 78 343 | ↓ | 73 229 | 93 | 260.05 - 260.90 | |
| B1 | Alto | 16 918 | = | 15 780 | 93 | 12.80 - 12.91 |
| ↓ | 182 | 1 | 62.68 - 62.98 | |||
| Medio | 78 343 | ↓ | 59 228 | 76 | 104.27 - 104.74 | |
In Alto Lucero de Gutiérrez Barrios, 95 % of the surface with high productive potential and 64 % of the surfaces with medium productive potential could present a lower impact on the yield from the effect of climate change in the B1 scenario. The same pattern can be expected in the municipalities of Puente Nacional and Actopan, where the decrease could be of up to 3.29 kg ha-1 in 96 and 91 % of the surfaces with high productive potential. These variations can be present in agricultural areas of the mountainous zones (Figure 3).
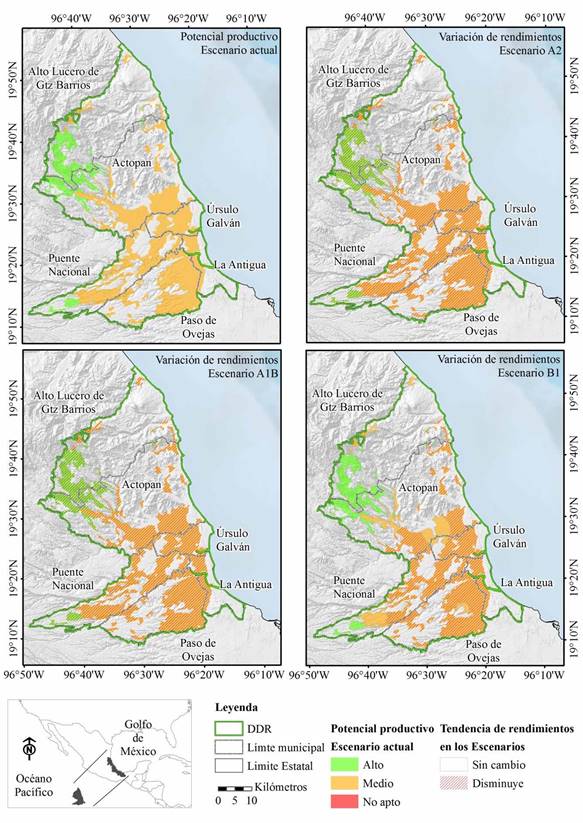
Figure 3 Spatial variation of maize yields in areas with productive potential in the RDD La Antigua, Veracruz, Mexico, under different climate change scenarios.
In contrast, the municipality of La Antigua could be affected by any of the three scenarios, and 100 % of the surface with medium productive potential would present a reduction of 168, 571 and 416 kg ha-1 in scenarios B1, A1B and A2. Other municipalities with medium productive potential that could be affected are Paso de Ovejas, with a decrease in yields of 277 to 384 kg ha-1, in the 21,391 ha under scenarios A1B and A2; in Úrsulo Galván it would decrease from 306 to 431 kg ha-1 (94 %) (7,702 ha) in surfaces with medium productive potential; in Puente Nacional the decrease would be between 226 and 298 kg ha-1 in 96 % of the surface with medium productive potential (18,299 ha) in scenarios A1B and A2; in Actopan they would be 19,126 ha (90 %) with medium productive potential, with a decrease between 199 and 287 kg ha-1 in scenarios A1B and A2 (Table 3).
Table 3 Surfaces with productive potential for maize affected by climate change scenarios in the municipalities that make up the RDD La Antigua, Veracruz, Mexico.
| Clave de municipio | Nombre de municipio | Potencial productivo | Superficie (ha) | Tendencia rendimientos | Superficie afectada en el escenario climático (ha) | Disminución promedio de rendimientos por escenario climático (kg ha1) | ||||
| A1B | A2 | B1 | A1B | A2 | B1 | |||||
| 004 | Actopan | Alto | 7,207 | = | 0 | 0 | 6,532 | 0 | 0 | 0.00 |
| ↓ | 6,619 | 6,619 | 87 | 149.28 | 104.59 | 17.60 | ||||
| Medio | 21,200 | = | 0 | 0 | 6,879 | 0.00 | 0.00 | 0.00 | ||
| ↓ | 19,126 | 19,126 | 12,244 | 286.57 | 199.06 | 60.94 | ||||
| 009 | Alto Lucero de Gutiérrez Barrios | Alto | 8,340 | = | 0 | 0 | 7,939 | 0.00 | 0.00 | 0.00 |
| ↓ | 8,034 | 8,034 | 95 | 150.90 | 106.93 | 18.86 | ||||
| Medio | 3,005 | = | 0 | 0 | 1,916 | 0.00 | 0.00 | 0.00 | ||
| ↓ | 2,523 | 2,523 | 606 | 208.70 | 148.50 | 37.23 | ||||
| 016 | La Antigua | Medio | 4,736 | ↓ | 4,189 | 4,189 | 4,189 | 571.10 | 415.75 | 167.92 |
| 126 | Paso de Ovejas | Medio | 22,029 | = | 0 | 0 | 810 | 0.00 | 0.00 | 0.00 |
| ↓ | 21,391 | 21,391 | 20,580 | 383.87 | 277.00 | 87.35 | ||||
| 134 | Puente Nacional | Alto | 1,371 | = | 0 | 0 | 1,310 | 0.00 | 0.00 | 3.29 |
| ↓ | 1,310 | 1,310 | 0 | 164.34 | 130.66 | 0.00 | ||||
| Medio | 19,159 | = | 0 | 0 | 3,644 | 0.00 | 0.00 | 0.00 | ||
| ↓ | 18,299 | 18,299 | 14,655 | 297.90 | 225.92 | 92.84 | ||||
| 191 | Úrsulo Galván | Medio | 8,214 | = | 0 | 0 | 748 | 0.00 | 0.00 | 0.00 |
| ↓ | 7,702 | 7,702 | 6,954 | 430.69 | 306.07 | 109.17 | ||||
The response of the crops to changes in climate patterns follows a combined effect of precipitation and temperature that modifies the physiological response of the crop. The increase in temperature, linked to water stress, enhances stomatal closing; this decreases the rate of gas exchange and affects the yield. The excess precipitation can decrease oxygenation in the soil and the rate of water and nutrient absorption by the crop.
Scenario A1B included a higher population growth than the other scenarios and a growing use of energy, which is why a greater emission of greenhouse effect gases is assumed, compared to the other two scenarios. In these, a lower demand of consumption goods is assumed as well as lower gas emission to the atmosphere. However, the response of crops in other regions can differ in function of the nearness to oceans and the altitude.
The impact on the yield calculated in the climate scenarios tested seems to be irrelevant, but the method used in the study can be transcendental. The simulation model used to quantify the water balance in the soil (SICTOD) considers the initial moisture content in the soil, the water requirements from the crops, and the stochastic nature of climate, and includes production functions of the crops. All of this allows quantifying the probable yield under the climate restrictions imposed.
In terms of vulnerability scenarios for the maize crop, if B1 climate change conditions are present in the RDD La Antigua, no significant changes are expected in the areas of productive potential identified by Díaz et al. (2012), which are mainly in mountainous areas, since variation in climatologic characteristics for crop development could me minimal for they would benefit from the increase in temperature in any of the scenarios evaluated. In contrast, in scenarios A1B and A2 the climate variations would affect the productive potential, and almost all of the RDD could present adverse conditions that would affect the yield, primarily in low altitude zones. It should be mentioned that if the new group of scenarios called “representative concentration pathways” (RCP) were to be applied, the results would be different, since these scenarios are centered on anthropic emissions and do not include changes in natural driving forces, such as solar or volcanic radiative forcing, or the natural emissions of methane (CH4) or nitrogen oxide (N2O); in addition, these have representations that range from a scenario of mitigation considering a total radioactive forcing of 2.6 W m-2 (RCP2,6), going through scenarios of stabilization RCP4,5 and RCP6,0, until reaching RCP8,5 which represents a scenario with a very high level of greenhouse gas emissions.
This methodological proposal attempts to set the necessary bases for decision makers and society in general to have scientific elements to design actions that decrease the vulnerability to adverse climate phenomena in areas with productive potential for maize, under rainfed conditions in the SS cycle, in the zone within the Rural Development District of La Antigua.
The simulation models are used in diverse fields of human activity and in the planning of agricultural areas they have facilitated advances, such as the agility of calculations, in information processing and in the simulation of different processes. This allows greater understanding and reliable results (Lhomme et al., 1984; Jones and Tardieu, 1998), and offers the possibility of modeling the development of maize cultivation in different dates of sowing and cycles. Sowing dates may be redefined with this, in order to take advantage of the best hydric conditions for the development of crops or productive reconversion. In the literature, there is a great variety of models to quantify or estimate the yield of crops through the soil water balance, but they omit the management of climate change scenarios and do not consider dryland agriculture.
The cartographic information generated can contribute to planning the working schemes that lead to adaptation actions under conditions of climate change, for maize growing, and cultivation of other crops involved in food security.
Conclusions
The conditions of climate change B1, in the RDD La Antigua, would not cause significant changes in productive potential; to the contrary, the minimum climate variation could benefit the scenarios considered here. Scenarios A1B and A2 with their climate variations would affect the productive potential of almost all of the RDD, especially in zones with low altitude.
The analysis methodology used to determine the affectations that the maize crop would have due to climate change effects in this study is an important advancement, for it is flexible and can be adapted to the schemes defined in the Fifth Evaluation Report, which incorporates new scenarios, called “representative concentration pathways” (RCP).
Literatura Citada
Allen, R. G., L. S. Pereira, D. Raes, y M. Smith. 2006. Evapotranspiración del Cultivo: Guías para la Determinación de los Requerimientos de Agua de los Cultivos. Riego y drenaje. FAO. Roma, Italia. pp: 7-13. [ Links ]
Addinsoft, 2014. XLSTAT software estadístico para Microsoft Excel. Software de computadora en su versión de prueba. http://www.xlstat.com/es/. New York. Addinsoft SARL. [ Links ]
Carbajal C., M., C. Yarlequé, A. Posadas, E. Silvestre, A. Mejía, y R. Quiróz, 2010. Reconstrucción de datos faltantes de precipitación pluvial diaria mediante la Transformada Wavelet. Rev. Peru. Geo-Atmos. 2: 76-88. [ Links ]
Comisión Nacional del Agua - Servicio Meteorológico Nacional (CNA-SMN). 2014. Red de Estaciones Climatológicas. http://smn.cna.gob.mx/ . México (Consulta: septiembre 2014). [ Links ]
Comisión Nacional del Agua - Servicio Meteorológico Nacional (CNA-SMN). 2010. Red de Estaciones Climatológicas. http://smn.cna.gob.mx/ . México (Consulta: octubre 2010). [ Links ]
Conde, C., R. M. Ferrer, C. Gay, y R. Araujo. 2004. Impactos del cambio climático en la agricultura en México. In: Martínez, J., y A. Fernández B. (comp). Cambio Climático: Una Visión desde México. pp: 227-238. [ Links ]
De Santa O., F. M., F. López F., y A. Calera B. 2005. Agua y Agronomía. Mundi-Prensa S.A. Universidad de Castilla La Mancha. Madrid, España. 603 p. [ Links ]
Diario Oficial de la Federación (DOF). 2001. Ley de Desarrollo Rural Sustentable. México, D.F. México. Viernes 7 de diciembre de 2001. [ Links ]
Díaz P., G., R.A. Guajardo P., G. Medina G., , I. Sánchez C., J. Soria R., J. M. P. Vázquez A., J. A. Quijano C., F. Legorreta P., y J. A. Ruíz C. 2012. Potencial productivo de especies agrícolas de importancia socieconómica en México. Secretaría de Agricultura, Ganadería, Desarrollo Rural, Pesca y Alimentación. Instituto Nacional de Investigaciones Forestales, Agrícolas y Pecuarias (SAGARPA-INIFAP). Cotaxtla, Veracruz. México. 140 p. [ Links ]
Díaz P., G. , I. Sánchez C., y R. A. Guajardo P. 2011. Análisis de series de tiempo de clima para tomar decisiones en México. In: Oswald, S. U. Retos de la Investigación del Agua en México. Universidad Nacional Autónoma de México (UNAM). Centro Regional de Investigaciones Multidisciplinarias (CRIM). Cuernavaca, Morelos. México. 754 p. [ Links ]
Díaz P., G. , J. A. Ruíz C., M. A. Cano G., V. Serrano A., y G. Medina G. 2006. Estadísticas climatológicas básicas del estado de Veracruz (Periodo 1961-2003). Secretaría de Agricultura, Ganadería, Desarrollo Rural, Pesca y Alimentación. Instituto Nacional de Investigaciones Forestales, Agrícolas y Pecuarias (SAGARPA-INIFAP). Cotaxtla, Veracruz. México. 292 p. [ Links ]
Dirmeyer, P. A., C. A. Schlosser, and K. L. Brubaker. 2009. Precipitation, recycling and land memory: An integrated analysis. J. Hydrometeorol. 10: 278-288. [ Links ]
El Financiero. 2011. Pérdidas agrícolas por más de 45 mil mdp por heladas. El Financiero, 14 Febrero de 2011. p. 16. [ Links ]
ESRI 2011. ArcGIS Desktop: Release 10. Redlands, CA: Environmental Systems Research Institute. [ Links ]
Estévez, J., y P. Gavilán. 2008. Procedimientos de validación de datos de estaciones meteorológicas automáticas. Aplicación a la red de información agroclimática de Andalucía. Plataforma de asesoramiento y transferencia del conocimiento agrario y pesquero de Andalucía. Instituto de Investigación y Formación Agraria y Pesquera. Consejería de Agricultura, Pesca y Desarrollo Rural. pp: 1-12. [ Links ]
Conde, C., R. M. Ferrer, y D. Liverman. 2000. Estudio de la vulnerabilidad de la agricultura de maíz de temporal mediante el modelo ceres - maize. In: Gay G., C. (comp.). México: una Visión hacia el Siglo XXI. El Cambio Climático en México. Instituto Nacional de Ecología, Universidad Nacional Autónoma de México, US Country Studies Program. México. pp: 93-110. [ Links ]
Gobierno del estado de Veracruz. 2009. Manual por regiones Distrito de Desarrollo Rural 06 La Antigua. Departamento de Gestión Educativa. Área Productiva. Red Comunitaria Vasconcelos. Xalapa, Ver. 52 p. [ Links ]
Hainie A., N., and D. S. Mohd 2013. Homogeneity test on daily rainfall series for Malaysia. Matematika 29: 141-150. [ Links ]
Instituto Nacional de Estadística y Geografía (INEGI). 2014. Marco Geoestadístico Municipal. http://www.inegi.org.mx/geo/contenidos/geoestadistica/ . Aguascalientes, México (Consulta: septiembre 2014). [ Links ]
Jones, H. G., and F. Tardieu. 1998. Modelling water relations of horticultural crops a review. Sci. Hortic. 74: 21-46. [ Links ]
Lhomme, J. P., L. Gómez, y A. Jaramillo. 1984. Modelo matemático del balance hídrico. Turrialba 34: 503-507. [ Links ]
Ojeda-Bustamante, W., E. Sifuentes-Ibarra, M. Íñiguez-Covarrubias, M. J. Montero-Martínez. 2011. Impacto del cambio climático en el desarrollo y requerimientos hídricos de los cultivos. Agrociencia 45: 1-11. [ Links ]
Ortiz S., C. A. 1984. Elementos de Agrometeorología Cuantitativa: Con Aplicaciones en la República Mexicana. Universidad Autónoma de Chapingo Departamento de suelos. Universidad Autónoma de Chapingo. Texcoco, Edo. de México. 327 p. [ Links ]
Pántano, V. C., L. B. Spescha, O. C. Penalba, y G. M. Murphy. 2014. Influencia de la variabilidad de temperatura y precipitación en la situación hídrica del suelo, en la región oriental de secano de la Argentina. Meteorológica 39: 21-36. [ Links ]
Panel Intergubernamental de Cambio Climático (IPCC). 2008. Cambio climático 2007: Informe de síntesis. Contribución de los grupos I, II y III al Cuarto Informe de evaluación del Grupo Intergubernamental de Expertos sobre el Cambio Climático. Organización Meteorológica Mundial (OMM)-Programa de las Naciones Unidas para el Medio Ambiente (PNUMA). Ginebra, Suiza. 114 p. [ Links ]
Panel Intergubernamental de Cambio Climático (IPCC). 2000. Informe Especial del IPCC: Escenarios de emisiones. Organización Meteorológica Mundial (OMM)-Programa de las Naciones Unidas para el Medio Ambiente (PNUMA). Ginebra, Suiza. 27 p. [ Links ]
Pizarro T., R., C. Ramírez B., y J. P. Flores V. 2003. Análisis comparativo de cinco métodos para la estimación de precipitaciones areales anuales en periodos extremos. Bosque (Chile) 24: 31-38. [ Links ]
Reuters, 2012. Pérdidas agrícolas por sequía en México superan los 16 mil mdp en 7 años: EE.UU. La Jornada, 4 de abril de 2012. [ Links ]
Sánchez C., I., G. Díaz P., M. Velazquez V., D. C. Slack, P. Heilman, and A. Pedroza S. 2015. A decision support system for rainfed agricultural areas of Mexico. Comput. Electron. Agric. 114: 178-188. [ Links ]
Sánchez C., I. 2013. Modelo de balance hídrico como apoyo a toma de decisiones en zonas agrícolas bajo incertidumbre climática. Instituto Nacional de Investigaciones Forestales, Agrícolas y Pecuarias (INIFAP). Gómez Palacio, Durango. México. (Folleto Técnico Núm. 28). 58 p. [ Links ]
Sánchez C. I. 1994. Evaluating strip farming systems for arid ecosystems a stochastic approach. Doctoral Thesis dissertation. University of Arizona. 111 p. [ Links ]
Schonwiese, C. D. and J. Rapp. 1997. Climate trend atlas of Europe based on observation 1891-1990. Int. J. Climatol. 18: 580-581. [ Links ]
Semenov, M. A. and E. M.Barrow. 2002. Lars-WG: A stochastic weather generator of use in climate impact studies. Rothamsted Research. Harpenden, Gertfordshire. United Kingdom. 28 p. [ Links ]
Servicio de Información Agroalimentaria y Pesquera (SIAP). 2015. Cierre de la producción agrícola bajo condiciones de temporal ciclo PV de maíz del 2014. http://www.siap.gob.mx/ . Consulta: 11 de febrero de 2014. [ Links ]
Stöckle, C. O. and Nelson, R. 2014. CS Suite-ClimGen. Software de computadora de libre acceso Software de computadora de libre acceso http://modeling.bsyse.wsu.edu/CS_Suite/ClimGen/documentation/abstract/es.htm . Washington State University. Washington, USA (Consulta: febrero 2014). [ Links ]
Suescun J., M., 2012. Aplicación de modelos de generación de variables meteorológicas para la gestión del riego en la provincia de Álava. Universidad Pública de Navarra: Escuela Técnica Superior de Ingenieros Agrónomos. Navarra, España. 110 p. [ Links ]
UNE 500540, 2004. Redes de estaciones meteorológicas automáticas: Directrices para la validación de registros meteorológicos procedentes de redes de estaciones automáticas: Validación en tiempo real. Asociación española de normalización y certificación. AENOR. España. 7 p. [ Links ]
Velasco H., M. de los A., T. Morales A., N. G. Estrella Ch., R. Díaz R., J. P. Juárez S., M. Hernández V., y R. Bernal M. 2015. Tendencias y variabilidad de índices de cambio climático: enfoque agrícola en dos regiones de México. Rev. Mex. Cienc. Agríc. 6: 1587-1599. [ Links ]
Wreford, A., D. Moran, and N. Adger. 2010. Climate change and agriculture: impacts adaptation and mitigation. Organization for Economic Coperation and Development (OECD). Programa de las Naciones Unidas para el Medio Ambiente (PNUMA). Ginebra, Suiza. 140 p. [ Links ]
Wijngaard, J. B., A. M. G. Klein T., and G. P. Konnen, 2003. Homogeneity of 20th century European daily temperature and precipitation series. Int. J. Climatol. 23: 679-692. [ Links ]
Received: January 2017; Accepted: August 2017
 Este es un artículo publicado en acceso abierto bajo una licencia Creative Commons
