


 texto en
  Inglés (pdf)
 Artículo en XML
 Referencias del artículo
 Enviar artículo por email
 Citado por SciELO
  Similares en
SciELO
Similares en
SciELO 
 Permalink
Introduction
Consumers are increasingly interested in the health benefits of foods looking beyond the basic nutritional needs. The nutritional value of legumes is gaining interest in the developed countries because of increasing demand for functional food. Green beans (Phaseolus vulgaris L.) are cultivated and distributed throughout the world, and they are used in diets worldwide (Khatun et al., 2007).
Green beans fall into two growth habits: indeterminate (climbing or pole) beans and determinate (dwarf or bush) beans. Pod colour is green, yellow or purple (Singh and Singh, 2015), while shape range from thin “fillet” to wide “romano”. Pods are rich in proteins, carbohydrates, dietary fibre, minerals, vitamins and antioxidant phytochemicals (Lim, 2012). Green beans can be prepared steamed, boiled, stir-fried or baked, and unlike most of the vegetables, they retain the antioxidant activity after most cooking treatments (Jimenez-Monreal et al., 2009). Pods are harvested immature, usually 12 to 14 d after the first blossoms open (Lim, 2012). Immature pods are marketed as fresh, frozen or canned, whole or French cut (Duke, 1981).
Domestication of common bean occurred independently in Mesoamerica and Andean South America (Kaplan and Lynch, 1999) and gave rise to two major gene pools within the cultivated forms (Gepts, 1988); afterwards, both Mesoamerican and Andean cultivars were disseminated all over the world. The relative distribution of each major gene pool varies from region to region (Gepts, 1988). The long tradition of green bean cultivation in Croatia has resulted in the development of a large number of landraces adapted to specific areas, and chosen to suit different dietary habits (Čupić et al., 2012). Traditional landraces are an important source of germplasm for plant breeders, have considerable genetic variation and show high adaptability to different environmental conditions (FAO Country report, 2008).
Nutrient composition varies among green beans and such variation is influenced by genotype, growing conditions, and maturity stage at harvest (Kelly and Scott, 1992; Jakopic et al., 2013; Selan et al., 2014). Therefore, the hypothesis of our study was that there are significant differences in nutritional quality among traditional green bean landraces in Croatia and that those differences could be related to gene pool and/or morphotype differences. In addition, the objective was to assess the nutrition value of most important Croatian green bean landraces and to evaluate the effect of origin and morphotype on content of proteins, sugars, fibres, calcium, potassium and phosphorus in fresh green bean pods.
Materials and Methods
Plant material and morphotype determination
Research was carried out on 14 accessions of green bean landraces originating from diverse geographical regions of Croatia (Table 1). The accessions were grown in non-replicated field plots at the experiment field in Maksimir, Zagreb. Seeds were planted on May 6, 2014. Prior to planting 350 kg ha-1 of N:P:K (7:20:30) was broadcasted. During vegetation, mechanical weed control was performed. The vegetation period was characterized by sufficient and proper distribution of rainfall (145 mm, 145.4 mm, 157.8 mm and 115.2 mm, during May, Jun, July, and August, respectively); thus, there was no need for irrigation. Mean monthly temperatures during the vegetation period, May, Jun, July, and August, were 16.2, 20.3, 22.4, and 19.2 ᵒC, respectively.
Table 1 Accessions used in the study with their corresponding phaseolin type and morphotype.
| Number | Accession | Origin (County) |
Phaseolin type† |
Morphotype | ||
| Habit | Pod colour | Pod width | ||||
| 1 | S501 | Dubrovnik | I | Indeterminate | Green | Wide |
| 2 | S506 | Varaždin | I | Indeterminate | Yellow | Thin |
| 3 | S507 | Varaždin | II | Indeterminate | Green | Wide |
| 4 | S508 | Dubrovnik | III | Determinate | Green | Wide |
| 5 | S509 | Varaždin | II | Indeterminate | Yellow | Thin |
| 6 | S518 | Krapina | I | Determinate | Yellow | Thin |
| 7 | S525 | Krapina | II | Indeterminate | Yellow | Wide |
| 8 | S526 | Gorski Kotar | III | Determinate | Yellow | Thin |
| 9 | S538 | Koprivnica | I | Indeterminate | Green | Wide |
| 10 | S541 | Zagreb | II | Indeterminate | Yellow | Wide |
| 11 | S542 | Zagreb | III | Determinate | Yellow | Thin |
| 12 | S543 | Karlovac | III | Determinate | Yellow | Wide |
| 13 | S544 | Zadar | III | Determinate | Green | Thin |
| 14 | S545 | Zadar | III | Indeterminate | Green | Thin |
†Phaseolin types: I - Mesoamerican "S" type, II - Andean "H" or "C" type, III - Andean "T" type.
The morphotypes of 14 accessions were classified based on three morphological traits (growth habit, pod colour and pod width), which required them to be scored based on the descriptor list for common bean used in the Phaseolus Database (http://www.genbank.at/en/ecpgr-phaseolus.html).
Phaseolin type
Total genomic DNAs were extracted from 25 mg of silica gel dried leaves from each accession using DNeasy Plant Mini Kit (Qiagen, Valencia, California, USA). The PCR amplification of phaseolin sequence combined PCR primers developed by Kami et al. (1995) and a tailed PCR primer approach (Schuelke, 2000). The 20 μL of the PCR mix contained reverse (5'-GCTCAGTTCCTCAATCTGTTC-3') and FAM labelled M13 primer (5'-TGTAAAACGACGGCCAGT-3), each of 8 pmol, 2 pmol of the tailed forward primer (5'-TGTAAAACGACGGCCAGTAGCATATTCTAGAGGCCTCC-3'), 1 x PCR buffer, 0.2 mM dNTPs, 1 U TaKaRa Taq™ Hot Start DNA Polymerase (Takara Bio Inc., Otsu, Japan) and 5 ng of template DNA. A two-step PCR protocol was utilized with an initial touchdown cycle (94 °C for 5 min; 5 cycles of 45 s at 94 °C, 30 s at 60 °C, which was lowered by 1 °C in each cycle, and 90 s at 72 °C; 25 cycles of 45 s at 94 °C, 30 s at 55 °C, and 90 s at 72 °C; and 8-min extension step at 72 °C) (Radosavljević et al., 2011). The PCR products were detected on an ABI 3730xL DNA analyser (Applied Biosystems, Foster City, CA, USA) by the Macrogen DNA service (Seoul, South Korea) and analysed using GeneMapper 4.0 computer program (Applied Biosystems, Foster City, CA, USA).
Nutritional quality
Seven nutritional quality traits were determined on pod samples harvested before they were fully mature, from 12 to 14 d after the blossoms opened depending on genotype and weather conditions (Lim, 2012). Dry matter content was determined by drying the pod samples in an air-forced oven at 70 °C until a constant mass. Dried samples were then ground and homogenized using a sample grinder (IKA® Werke M 20). The total N content was determined using the Kjeldahl procedure following plant material decomposition at 420 °C in the presence of sulphuric acid (AOAC, 1995). Crude protein content was estimated by multiplying the value of total N content with conversion factor of 6.25 (Merrill and Watt, 1973).
After digestion of the plant material in a microwave oven with nitric and perchloric acid (6:1), phosphorus (P2O5) content was determined using a spectrophotometer, potassium (K2O) content was determined using flame photometer (AOAC, 1995), and calcium content was determined titrimetrically (AOAC, 1995). The content of total sugars (reducing + non-reducing) was quantified according to Nelson-Somogyi method (Somogyi, 1945; Maness, 2010). Crude fibre content was determined using the method with intermediate filtration (HRN EN ISO 6865, 2001). The sample was treated with boiling diluted sulfuric acid, the residue was separated by filtration, washed and then treated with boiling potassium hydroxide solution. The residue was separated by filtration, washed, dried, weighed and turned into ash. The loss in mass resulting from this process corresponds to crude fibre mass in the sample. Dry matter content was expressed as percentage of fresh weight, and all other traits as percentage of dry matter.
Data analysis
The relationships among seven quantitative traits describing chemical composition of fresh pods were assessed by Pearson's correlation coefficient using PROC CORR (SAS Institute Inc., 2011). The univariate ANOVA using PROC GLM (SAS) and a post hoc Tukey test (p ( 0.05) were carried out for each trait in order to compare the values among accessions. Subsequently, the accessions were grouped according to phaseolin type (I, II or III) and to the three morphological traits: growth habit (determinate vs. indeterminate), pod colour (green vs. yellow), and pod width (thin vs. wide), and the group means were compared as described above.
In addition, a canonical correspondence analysis (CCA) was performed to elucidate the relationships between four qualitative traits (phaseolin type and three morphological traits) and seven quantitative traits describing chemical composition of fresh pods. The analysis was carried out using PAST ver. 3.07 (Hammer et al., 2001).
Results and Discussion
Crude protein content was strongly positively correlated with phosphorus (r=0.85) and potassium (r=0.78) content, but it was strongly negatively correlated with total sugars content (r=-0.74). Furthermore, a strong positive correlation was determined between phosphorus and potassium content (r=0.82) (Table 2). Ferreira et al. (2006) studied correlations among pod quality traits during different pod developmental stages and found correlations among pod dry matter, alcohol-insoluble solids, and fibre content which were also strongly affected by pod maturation process. In addition, mineral composition, colour and lipid content were stable for all studied cultivars during different pod developmental stages.
Table 2 Pearson's correlation coefficients (r; below diagonal) and their significance (above the diagonal) between seven nutritional quality traits of green bean fresh pods.
| No. | Trait | Trait | ||||||
| 1 | 2 | 3 | 4 | 5 | 6 | 7 | ||
| 1 | Dry matter | * | ns | *** | ns | ns | ns | |
| 2 | Crude protein | 0.38 | ns | *** | ns | *** | *** | |
| 3 | Crude fibre | -0.10 | 0.26 | ns | ns | ns | ns | |
| 4 | Total sugars | -0.60 | -0.74 | -0.29 | ns | *** | ** | |
| 5 | Calcium | -0.25 | -0.31 | 0.21 | 0.16 | ** | ** | |
| 6 | Phosphorus | 0.29 | 0.85 | 0.05 | -0.53 | -0.44 | *** | |
| 7 | Potassium | 0.15 | 0.78 | -0.07 | -0.47 | -0.44 | 0.82 | |
*** p≤0.001; ** 0.001<p<0.01; * 0.01<p<0.05; ns p>0.05.
There is indirect evidence that protein synthesis requires potassium (Hawkesford et al., 2012) and its probable function is polypeptide synthesis in the ribosomes, which requires a high potassium concentration (Wyn Jones and Pollard, 1983). Moreover, potassium has favourable effect on the transport of assimilates to growing plant organs (Engels et al., 2012); whereas, phosphates have an irreplaceable role in energy-transfer processes, it serves as important linkage in groups, and provides essential ligands in enzymatic processes (Taiz and Zeiger, 2002). All these facts, along with the high mobility of potassium and phosphorus in plants and the crude protein content of fresh pods, explain the positive correlation between crude protein, phosphorus and potassium content in fresh pods.
Contents of crude fibres in fresh pods varied between 7.7 % and 11.1 % (data not shown) and non-significant differences were observed among green bean accessions. Dry matter content of fresh pods varied from 72.3 % (S544) to 98 % (S501) and significant differences were found only between accession S501and accessions S544, S543, S518, S507, S542, S509, S526, S545, and S508 (Figure 1A).
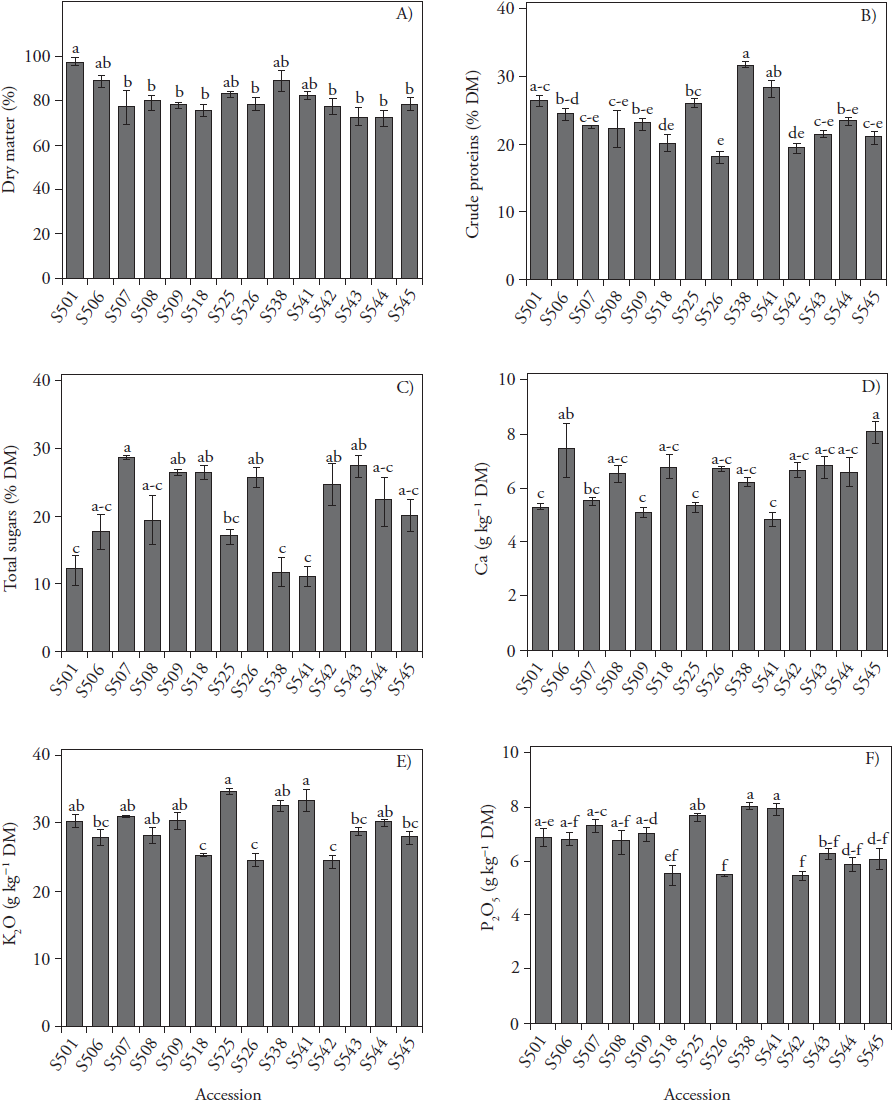
Vertical bars represent the means ± standard errors of the mean (SEM) (n=3); *** p ( 0.001 ANOVA; means (bars) with different letters are statistically significant (Tukey; p ≤ 0.05).
Figure 1 Dry matter (A), crude proteins (B), total sugars (C), calcium (D), potassium (E), and phosphorus (F) content in dry matter of pods from 14 field grown green bean accessions.
Crude protein content in fresh pods varied from 18.2 % (S526) to 31.7 % (S538) and the content of superior accession S538 was similar to that of accessions S501 (26.5%) and S541 (28.2%) (Figure 1b). These results agree with those reported by Salinas et al. (2012) who recorded 22.3 % protein content in pods of indeterminate bred cv. 'Hav-14'. In addition, Kazydub et al. (2017) showed 17.8 - 23.6 % of crude protein content as average values in five Siberian green bean cultivars.
Total sugars content in green bean fresh pods varied from 11.3 % (S541) to 28.6 % (S507); however significant differences were only found between accession S507 and accessions S518, S509, S543, S507 (Figure 1C). These results are similar to those reported by Sánchez-Mata et al. (2002) of 21.1-21.5 % of total soluble sugars in pods of cv. 'Perona'. Calcium content in fresh pods varied between 4.9 g kg-1 (S541) and 8.1 g kg-1 (S545); however, significant differences were only found when comparing accessions S545 (8.1 g kg-1) and S506 (7.4 g kg-1) with accessions S501 (5.3 g kg-1), S509 (5.1 g kg-1), S525 (5.3 g kg-1), and S541 (4.9 g kg-1) (Figure 1D). Potassium content in fresh pods varied between 24.3 g kg-1 and 34.6 g kg-1 (Figure 1E), and phosphorus content varied from 4.4 to 6.4 g kg-1. High contents of both nutrients were found in fresh pods of accessions S525, S538 and S541, with 34.6, 32.4, and 33.3 g kg-1 for potassium and 6.1, 6.4, and 6.4 g kg-1 for phosphorus, respectively. In addition, low contents of these nutrients were found in fresh pods of accessions S518, S526, and S542, 25.2, 24.4 and 24.3 g kg-1 potassium and 4.4, 4.4, and 4.4 g kg-1 of phosphorus, respectively (Figures 1E and 1F). Results of mineral nutrients content are comparable to those obtained in pods of five Portuguese green bean cultivars by Ferreira et al. (2012), who reported 6.3, 30.6, and 5.9 g kg-1 as average values of phosphorus, potassium, and calcium content, respectively.
The accessions were grouped according to phaseolin type (I, II or III) as well as according to each of the three morphological traits [growth habit (determinate vs. indeterminate), pod colour (green vs. yellow), pod width (thin vs. wide)]. Regarding phaseolin analysis, four accessions had phaseolin type I ("S"), which is predominant in Mesoamerican gene pool, whereas the other accessions belong to Andean gene pool characterized by the phaseolin types II ("H" or "C") and III ("T") (Table 1).
Analysis of variance revealed significant differences among phaseolin types in all nutritional quality traits (Table 3). The accessions of the Mesoamerican gene pool (phaseolin type I) had significantly higher dry matter and crude protein contents of fresh pods, as compared to accessions of the Andean gene pool (phaseolin types II and III); on the contrary Andean accessions had significantly higher total sugars content than the Mesoamerican and those with phaseolin type II had the highest phosphorus and potassium contents. Islam et al. (2002) also found differences in pod quality traits between Mesoamerican and Andean gen pool. These authors reported higher calcium, phosphorus, sulphur and zinc content, and lower iron and phaseolin content in Mesoamerican compared to Andean gen pool.
Table 3 Effect of phaseolin type, growth habit, pod colour and pod width on seven nutritional quality traits of green bean fresh pods.
| Trait | Phaseolin type† | Growth habit ¶ | Pod colour | Pod width | |||||
| I | II | III | D | I | Green | Yellow | Thin | Wide | |
| Dry matter (%) | 88.6a | 80.2b | 76.6b | 76.7b | 84.7a | 82.8a | 79.8a | 78.6b | 83.5a |
| Crude protein (%) | 25.7a | 25.0b | 21.0c | 20.9b | 25.5a | 24.6a | 22.7b | 21.5b | 25.6a |
| Crude fibre (%) | 9.4ab | 8.3b | 9.8a | 9.6a | 9.0a | 10.0a | 8.8b | 9.1a | 9.4a |
| Total sugars (%) | 17.1b | 20.9a | 23.4a | 24.4a | 18.2b | 19.2b | 22.2a | 23.4a | 18.3b |
| Calcium (g kg-1) | 6.4a | 5.2b | 6.9a | 6.7a | 6.0b | 6.4a | 6.2a | 6.8a | 5.8b |
| Phosphorus (g kg-1) | 5.4b | 6.0a | 4.8c | 4.7b | 5.8a | 5.4a | 5.2b | 4.8b | 5.8a |
| Potassium (g kg-1) | 28.9b | 32.3a | 27.3c | 26.8b | 31.0a | 30.0a | 28.6b | 27.2b | 31.2a |
†Phaseolin types: I - Mesoamerican "S" type, II - Andean "H" or "C" type, III - Andean "T" type
¶Growth habit: D - determinate, I - indeterminate; means with different letters are statistically significant (Tukey test: p≤0.05).
Significant differences in almost all nutritional quality traits were also found among different morphotypes. The content of crude fibres was similar regardless of growth habit and pod width. Accessions of indeterminate growth habit had higher dry matter and crude protein content as well as phosphorus and potassium content as compared to determinate ones, but showed lower total sugar and calcium contents. Accessions of yellow pod colour had higher total sugar content, but lower phosphorus and potassium content as compared to accessions having green pods. Accessions with green pods had higher content of crude protein, crude fibres, phosphorus and potassium and lower content of total sugars, as compared to morphotypes with yellow pods. Accessions with wide pods had higher dry matter content, crude protein, phosphorus, and potassium content and lower total sugars and calcium content, than accessions having thin pods.
Results of our research indicate a considerable variation in nutritional traits of fresh pods among green bean accessions. In addition, although measured pod traits represent quantitative traits affected by environmental conditions, favourable climatic conditions during our experiment, along with comparable results reported by other authors indicate the existence of different patterns of nutrient accumulation, in relation to different green bean morphotypes and different phaseolin types.
The relationships between pairs of four qualitative traits (phaseolin type, and three morphological traits) and seven quantitative traits describing chemical composition of fresh pods (shown as vectors) are shown as a biplot constructed by the first two axes of canonical correspondence analysis (CCA) (Figure 2). The first axis explained more than 60 % of the total variation showing that the increased levels of phosphorus, potassium and crude proteins in the pods are related to indeterminate growth habit (Hab_I), wide pod morphotype (PW_W) and phaseolin type II (Ph_II). Similarly, the accessions having phaseolin type III (Ph_III), determinate growth habit (Hab_D) and thin pods (PW_T) tend to show higher values of total sugars and calcium. However, it is more likely that growth habit type and pod width rather than phaseolin type have more profound effect on nutritional traits of fresh pods due to limited number of different morphotypes within each phaseolin type. Namely, most of the accessions within phaseolin type III had determinate habit type (four out of five accessions), whereas accessions within types I and II had indeterminate habit type (eight out of nine accessions) (Table 1). Furthermore, Singh et al. (1991) reported that determinate growth habit in common bean is controlled by the fin locus and that most varieties of the Nueva Granada race from the Andean gen pool (phaseolin type III) possess this locus. Thus, it seems that plants with different growth habit type tend to have different biochemical and metabolic patterns of nutrient remobilization and accumulation in pods. Such results agree with those reported by Koinange et al. (1996) and Rosales-Serna et al. (2004), who detected differences in common bean plants with different growth habits. Besides, Singh and Singh (2015) stated that growth habit is responsible for canopy geometry, and traits such as leaf number, leaf size, internode number, and internode length have significant impact on pod yield and quality.
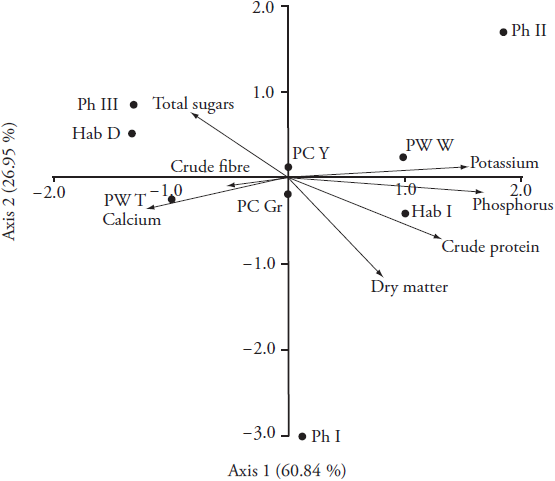
Ph_I - phaseolin type I; Ph_II - phaseolin type II; Ph_III - phaseolin type III; Hab_D - determinate habit; Hab_I - indeterminate habit, PC_Gr - green pod colour; PC_Y - yellow pod colour; PW_T - thin pod width; PW_W - wide pod width.
Figure 2 Biplot of the canonical correspondence analysis (CCA) showing the relationships between four qualitative traits (phaseolin type, and three morphological traits) and seven quantitative traits describing chemical composition of fresh pods (shown as vectors).
Determinate cultivars generally exhibit less biomass accumulation due to the compact growth habit and rapid flowering and maturation period, whereas cultivars of indeterminate growth habit exhibit sequential senescence of leaves that occurs simultaneously with flowering. In addition, growing tissues in indeterminate plants are sinks for compounds transported in the phloem, and thus mobile nutrients such as potassium and phosphorus could be remobilized from the senescing leaves to growing tissues (Thomas, 2013). Our results are in line with these statements. Namely, higher contents of mobile nutrients, i.e. nutrients that are remobilized via phloem (P2O5 and K2O) (Hawkesford et al., 2012) were found in pods of plants with indeterminate growth habit, whereas calcium as an immobile nutrient mainly transported by transpiration stream in the xylem (Hawkesford et al., 2012), was found in pods of plants of determinate growth habit.
A feasible explanation for high total sugar and calcium content in morphotypes with thin pods, when compared to morphotypes with wide pods, lies in their tendency to accumulate high fibre content (Figure 2). The lack of significant differences in fibre content between morphotypes with thin and wide pods (Table 3) may be the result of early harvest that prevented the accumulation of fibres in pods, as well as the fact that green bean is characterised by low fibre content (Singh and Singh, 2015). Fibres are long cells with secondary cell walls which serve as supporting elements in plant parts that are no longer elongating (Evert and Esau, 2006); therefore, the quantity of the secondary cell wall increases with ageing of pods. The main difference in composition of primary and secondary cell walls is that cellulose is more abundant in secondary walls, whereas pectic substances are primary binding site for calcium ions (Willats et al., 2001) and they lack secondary walls (Evert and Esau, 2006). Thus, during the early period of growth, pods contain a higher content of calcium and sugars and less fibre; whereas as, later on, the content of sugars and calcium decrease and those of fibres increase.
Green beans, also known as French beans, string beans or snap beans, are significant component of a well-balanced diet. Moreover, among European countries, higher legume consumption is observed around the Mediterranean (Bouchenak and Lamri-Senhadji, 2013). The Mediterranean Diet is considered as a healthy dietary pattern that protects against some chronic diseases and green beans consumption has received a rising interest from researchers. Green beans also play an important role in meeting the requirements of daily protein, fibre and minerals. According to Shanmugacelue (1989), 100 g of edible portion of pods contain on an average 1.7 g protein, 4.5 g carbohydrate, 1.8 g fibre, 50 mg Ca, 29 mg Mg, 28 mg P, and 1.7 mg Fe. Nonetheless, the appearance of vegetables, taste, and nutritional value have a growing influence on consumer food choice. According to Očić et al. (2015), consumers in Croatia prefer thin/yellow and thin/green pods; besides, the quality traits of green bean pods are more important than the yield itself (Singh and Singh, 2015)).
Conclusions
There are different patterns of nutrient accumulation in green bean due to morphotype and gene pool of accessions. Analysed accessions could be used as valuable sources of bioactive nutrients in future breeding programs. Additionally, outstanding accessions S538 and S541 had significantly higher crude proteins, phosphorus and potassium content, while accessions S506 and S545 had the highest calcium content.

