


Servicios Personalizados
Revista
Articulo
 texto en
  Inglés (pdf)
 Artículo en XML
 Referencias del artículo
 Enviar artículo por email
Indicadores
-
 Citado por SciELO
 -
 Accesos
Links relacionados
-
 Similares en
SciELO
Similares en
SciELO
Compartir

 Permalink
Agrociencia
versión On-line ISSN 2521-9766versión impresa ISSN 1405-3195
Agrociencia vol.52 no.3 Texcoco abr./may. 2018
Natural Renewable Resources
Carbon concentration in three species of tropical trees in the sierra sur of Oaxaca, México
1Postgrado en Ciencias Forestales, Campus Montecillo, Colegio de Postgraduados. 56230. Carretera México-Texcoco km 36.5. Montecillo, Texcoco, Estado de México, México.
2INIFAP-CIRPAS-Campo Experimental Valles Centrales de Oaxaca. 68200. Melchor Ocampo No. 7, Santo Domingo Barrio Bajo, Villa de Etla, Oaxaca, México.
3Postgrado Edafología, Campus Montecillo, Colegio de Postgraduados. 56230. Carretera México-Texcoco km 36.5. Montecillo, Texcoco, Estado de México, México.
All terrestrial ecosystems, but especially tropical forests, are important to mitigate global climate change since they absorb and store CO2 in biomass form in the trees. The identification of the carbon concentration (CC) in tree species contributes to improve the estimations of carbon (C) when the aim is to make estimations in relatively large areas. The objective of this study was to determine and compare the CC in three tropical species of trees: Alchornea latifolia Sw, Cupania dentata DC. and Inga punctata Willd. from the Sierra Sur of Oaxaca, México. Therefore, the CC was measured in the stem, branches and leaves in trees of different diameters. For each species, three individuals were selected in three diametric categories CD I (less than 10 cm), CD II (between 10 and 20 cm) and CD III (between 21 and 35 cm) from which samples were obtained for the structural components. The CC expressed in percentage of biomass was determined in a Shimadzu TOC 5000-A total carbon automatic analyzer. The data were analyzed with ANOVA for a completely random design and the means were compared with the Tukey test (p≤0.05). The CC in the structural components and diametrical categories in the three species were lower than the value that was accepted generically of 50 %. The lowest CC was found in the stem of the CD I of I. punctata, with 44.82 %, and the highest was in the leaves of CD III of C. dentata with 47.72 %. The general mean of CC was 46.20±1.03 %. The variations in CC should be taken into account to improve the accuracy in the estimations of the content of C in tropical trees and forests.
Keywords: tropical sub-evergreen forest; biomass; carbon capture; structural components; diametrical categories
Todos los ecosistemas terrestres, pero en especial los bosques tropicales, son importantes para mitigar el cambio climático global ya que absorben y almacenan CO2 en forma de biomasa en los árboles. La identificación de la concentración de carbono (CC) en las especies arbóreas contribuye a mejorar las estimaciones de carbono (C) cuando se trata de hacer estimaciones en áreas relativamente grandes. El objetivo de este estudio fue determinar y comparar la CC en tres especies tropicales de árboles: Alchornea latifolia Sw, Cupania dentata DC. e Inga punctata Willd. de la Sierra Sur de Oaxaca, México. Por lo tanto, se midió la CC en fuste, ramas y hojas en árboles de diámetros diferentes. Para cada especie se seleccionaron tres individuos en tres categorías diamétricas CD I (menor a 10 cm), CD II (entre 10 y 20 cm) y CD III (entre 21 y 35 cm) de las que se obtuvieron muestras para los componentes estructurales. La CC expresado en porcentaje de la biomasa se determinó en un analizador automático de carbono total Shimadzu TOC 5000-A. Los datos se analizaron en un ANDEVA para un diseño completamente al azar y las medias se compararon con la prueba de Tukey (p≤0.05). La CC en los componentes estructurales y categorías diamétricas en las tres especies fueron inferiores al valor que de manera genérica se maneja como aceptado del 50 %. La menor CC se presentó en el fuste de la CD I de I. punctata con 44.82 %, y la más alta fue en las hojas de la CD III de C. dentata con 47.72 %. La media general de CC fue 46.20±1.03 %. Las variaciones en CC deben considerarse para mejorar la precisión en las estimaciones del contenido de C en los árboles y bosques tropicales.
Palabras clave: bosque tropical subperennifolio; biomasa; captura de carbono; componentes estructurales; categorías diamétricas
Introduction
The anthropogenic emissions of CO2 from the burning of fossil fuels and the changes in land use of forest lands since the Industrial Revolution have contributed to an increase of 40 % in the atmospheric concentration of CO2; that is, from 280 ppm in 1750 to 403.64 ppm in October, 2017 (Dlugokencky and Tans, 2017). Therefore, the use of tree areas as a strategy for carbon (C) sequestration is important (IPCC, 2007). Forests contribute to mitigating global climate change because of their influence in the global cycle of C (Tesfaye et al., 2016), through the absorption and accumulation of CO2 in the leaves, branches, stem, and roots in the form of biomass. The identification of the potential for capture and storage of C in forests is necessary to improve the understanding of the dynamics of C balance at different scales, and also for the interpretation of the variations observed in the exchange of C between the atmosphere and the biosphere, and in the evaluation of public policies to mitigate the anthropogenic emissions of CO2 (Dugan et al., 2017).
In order to calculate the content of C stored from the biomass of trees, the conversion factor of 50 % of the dry weight is used (Houghton, 2005; Basuki et al., 2009; Thomas and Martin, 2012), regardless of the species, from the structure of the tree and type of forest. However, the general use of this value in the estimations of C stored in the forest vegetation can cause problems of under and over estimation (close to 5 %) (Thomas and Malczewski, 2007; Martin and Thomas, 2011). When the estimations of C are made at a different level, for example regional or national, they can generate over estimations of the reality (Gao et al., 2016), and, in addition, the carbon concentration (CC) in trees can vary from 41.9 to 51.6 % in tropical species (Elias and Potvin, 2003; Martin and Thomas, 2011), 45.7 to 60.7 % in subtropical species and 43.4 to 55.6 % in temperate and boreal species (Thomas and Martin, 2012; Gao et al., 2016). Meanwhile, the CC in shrubs shows a variation of 0.41 to 0.50 % and in herbs of 0.38 to 0.50 % (Razo et al., 2015). This variation can be in function of the species, the tree tissue, the management practices, the sampling method, the climate conditions, and the technique used for its determination, causing for the comparison of CC between studies to be difficult (Bert and Danjon, 2006; Martin and Thomas, 2011).
Measuring CC in México has been done primarily in species of conifers of temperate climate (Figueroa et al., 2010; Yerena-Yamallel et al., 2012; Pompa-García and Yerena-Yamallel, 2014; Hernández-Vera et al., 2017), in some broadleaves of tropical and subtropical climate (Figueroa et al., 2005;Hernández-Vázquez et al., 2012; Villanueva-López et al., 2015; Pompa-García et al., 2017a), and sparsely in herbaceous species (Razo et al., 2015). Therefore, the identification of the CC variations in tropical species would be a tool to improve the estimations of biomass to carbon.
The objective of this study was to determine and compare the CC of the stem, branches and leaves for different diameters of the trees of Alchornea latifolia Sw., Cupania dentata DC. and Inga punctata Willd., which are native species of the sub-evergreen tropical forests of the Sierra Sur of Oaxaca, México. The hypothesis was that there are differences in the CC between species, structural components and diametrical categories of the tree.
Materials and Methods
Study area
The study was carried out in the private plot of La Cabaña farm, located between 15° 56’ 13.54” and 15° 55’ 12.85” N, and 96° 24’ 09.13” and 96° 23 51.83” W, on a surface of 300 ha found in the physiographic region of the Sierra Sur, in Oaxaca, municipality of Pluma Hidalgo. The climate is semi warm humid with abundant summer rains (ACm), temperature of 18 to 26 °C, and precipitation of 1500 to 3500 mm. The geomorphology of the zone is complex low sierra with Phaozem soil type (INEGI, 2010). The vegetation corresponds to a sub-evergreen tropical forest where the tree stratum is made up primarily by the following species: A. latifolia Sw., C. dentata DC., I. punctata Willd., Astronium graveolens Jacq., Pterocarpus acapulcensis Rose, Inga paterno Harms, Homalium trichostemon S.F. Blake, Saurauia serrata D.C., Cecropia obtusifolia Bertol., Diphysa robinioides Benth., Lonchocarpus guatemalensis Benth., Calycophyllum candidissimum (Vahl) DC., Cupania glabra Sw. and Bursera simaruba (L.) Sarg.
The species selected for this study were A. latifolia, C. dentata and I. punctata, and they are part of the natural forest. However, these species are not considered ecologically important in México (Pompa-García et al., 2017b), despite their abundance in the natural vegetation and their use in traditional systems of coffee production in the Sierra Sur of Oaxaca, since they are species that provide shade and are multipurpose (Ventura-Aquino et al., 2008). Likewise, the wood of A. latifolia and C. dentata is used for constructions of houses, rural works, and handles of agricultural tools (Pennington and Sarukhán, 2005). Inga punctata provides some secondary products such as fodder, fruits and fuel to agroforestry producers.
Obtaining samples
For all the species, three diametrical categories were selected: CD I (less than 10 cm), CD II (between 10 and 20 cm) and CD III (more than 20 and less than 35 cm), and three individuals were elected from each category. The tree crown was divided into three sections: low, medium, high (Zhang et al., 2009) and in each of them, a branch was selected randomly from which a disk (approximately 5 cm thick) was obtained, and from the same an approximate sample of 250 g of foliage. From the stem, a disk was obtained at a height of 1.30 m from the ground level. All the samples were placed in paper bags with their corresponding labels and were transported to the Laboratory of Soil Fertility and Environmental Chemistry in Colegio de Postgraduados, where they were dried in a stove (Nyle model L500) at 70 °C until constant weight as indicated by the procedures described by Etchevers et al. (2005) for determination of CC in plant samples. Then, from the material of branches and leaves collected in each section of the crown, a subsample of 50 g was taken to form a single compound sample from each component of the tree, and from the trunk slice a subsample was also obtained that included sapwood, heartwood and bark in such a way that it included the same proportion. All the subsamples were cut into small fractions (splinters) and ground with knifes and scissors. In order to achieve homogeneity in the material, the samples were pulverized until they passed through the mesh 40 in a General Electric Mod. 5KH39QN5525 mill, and were deposited in envelopes labeled for their determination.
Measuring carbon
Before the carbon analysis, the compound subsamples were dried at 70 °C for 24 h to take out the moisture absorbed from the environment. After, around 30 mg were placed in a Shimadzu TOC 5000-A automatic analyzer of total carbon, to measure the CC by the dry combustion technique at 900 °C and measuring the CO2 released through infrared spectrometry (Etchevers et al., 2005). A total of 81 compound subsamples were analyzed, corresponding to 27 individuals per species.
Statistical analysis
A three-factor ANOVA was carried out with the data to evaluate the effects of species, diametric category, and structural component in the CC and the interactions corresponding to the species. For the species factor three levels were considered (A. latifolia, C. dentata and I. punctata), the same as the diametrical category factor (CD I, CD II, CD III), and the structural component factor (stem, branches, leaves), grouping the data into a completely random design with factorial arrangement 3X3X3 with three repetitions. The Tukey test (p≤0.05) was used for the factors or interactions that presented significant differences. The assumptions of normality and homogeneity of variances were validated for the model through the Shapiro-Wilk and Levene test (Montgomery, 2012). In addition, the differences between the average CC from each species and the generic value of standard biomass conversion (50 %) (Basuki et al., 2009; Houghton, 2005; Thomas and Martin, 2012) were evaluated statistically with a t-student test (p≤0.01). These analyses were performed with the R software version 3.3.3 (R Development Core Team, 2017) and with the agricolae package (De Mendiburu, 2016).
Results and Discussion
Carbon concentration per species
The results from the laboratory showed that the CC in the three species was found in an interval of 44.13-48.70 %, with a general mean of 46.20 %. The CC was significantly different between species (F 2, 54=14.03, p≤0.0001). The species with the highest average CC was C. dentata with 46.71 %, and then A. latifolia (46.02 %), and I. punctata (45.86 %) (Table 1). The results from the t-test were for A. latifolia (t=-18.32, p≤0.001), C. dentata (t=-17.32, p≤0.001) and I. punctata (t=-27.23, p≤0.001), indicating that the average CC in the three species of tropical trees was statistically lower than the 50 % established as a conversion factor with regard to the biomass.
Table 1 Carbon concentration (CC) in three species of tropical trees.
| Especie | n | Media | DE |
|---|---|---|---|
| Alchornea latifolia | 27 | 46.02 b | 1.13 |
| Cupania dentata | 27 | 46.71 a | 0.99 |
| Inga punctata | 27 | 45.86 b | 0.79 |
| Media general | 81 | 46.20 | 1.03 |
DE: Standard deviation. Means with different letter in a column are statistically different (Tukey; p≤0.05).
The variations in the CC in the three species shown in our study are similar to the ones found by Elias and Potvin (2003) for 32 tropical species from Panama (44.4 to 49.4 %). Gayoso and Guerra (2005) measured the CC in 16 species of native forests from Chile, and reported a variation of 34.9-48.3 % with an average of 43.7 %, while Yeboah et al. (2014) reported the CC in an interval of 45.8- 49.8 % in plantations of 19 species of tropical trees of 7 to 12 years in two ecozones of Ghana. Figueroa et al. (2005) determined a higher CC for the species of Inga (51.16 %) and of 51.19 % for six species from the mesophyll forest in the Sierra Norte of Oaxaca, México. In addition, Becker et al. (2012) point out that the variation of CC was 47.5-50 % in 23 tropical species in Eastern Africa, with a mean of 50 %. Hernández-Vázquez et al. (2012) reported an average CC of 40.8 % for the species Inga jinicuil Schltdl. in coffee agroforestry systems in San Juan Tepanzacoalco, Ixtlán, Oaxaca, value lower than that of I. punctata in our study. Pompa-García et al. (2017a) found that the CC in 82 species of trees in tropical and subtropical zones of México was 42.8 to 44.3 %, values lower than those found in our study.
The differences in the CC in the studies and in the three species analyzed in our study were attributed primarily to the physical and chemical properties of the tree tissues (Thomas and Malczewski, 2007). The variation in the CC between species of tropical trees is caused by the different proportions of cellulose and lignin (Martin and Thomas, 2011). In addition, in most of the studies the volatile compounds of C are unknown in the total concentration of C, which may cause a significant under estimation in the content of total C (Martin et al., 2013). Likewise, the effects of the ecological attributes of the species, such as tolerance to shade, influence importantly the variation of CC in the tree tissues (Gao et al., 2016). The trees with high content of lignin tend to present high levels of CC; thus, the species of conifers have a higher CC in the wood (50.8±0.7 %) compared to the species of tropical angiosperms (47.1±0.4 %) (Thomas and Malczewski, 2007). In the same way, tree species of temperate/boreal zones present a higher variation of CC (43.4-55.6 %) than the species from tropical zones (41-51.6 %) (Thomas and Martin, 2012).
Carbon concentration by component and diametric category
The average values of CC in the structural components of the tree in the three species were 45.77 %, 46.04 % and 46.77 % in the stem, the branches and the leaves, respectively (Table 2), while the average CC was 45.84 % in CD I, 46.12 % in CD II and 46.63 in CD III (Table 3). The results from the variance analysis indicated that the CC was significantly different between structural components of the tree (F 2,18=18.74, p≤0.001) and between diametrical categories (F 2,18=6.79, p≤0.001) in I. punctata. Likewise, in C. dentata the CC showed significant differences between the structural components (F 2,18=25.20, p≤0.001) and between the diametric classes (F 2,18=8.79, p≤0.001). Meanwhile, in A. latifolia only the diametric classes presented significant differences (F 2,18=6.98, p≤0.01). The interaction structural component by diametric class for the three species did not show significant differences (p˃0.05).
Table 2 Carbon concentration (CC) in the different structural components of the tree.
| Especie | Componente estructural | ||
|---|---|---|---|
| Fuste | Ramas | Hojas | |
| Alchornea latifolia | 45.56±0.88 a | 46.40±0.75 a | 46.10±1.55 a |
| Cupania dentata | 46.29±0.70 a | 46.11±0.55 a | 47.71±0.80 b |
| Inga punctata | 45.46±0.62 a | 45.62±0.70 a | 46.51±0.66 b |
| Media general | 45.77±0.81 a | 46.04±0.72 a | 46.77±1.25 b |
Mean±standard deviation, n=9. Means with different letters in a line are statistically different (Tukey; p≤0.05).
Table 3 Carbon concentration (CC) in the different diametric categories.
| Especie | Categoría diamétrica | ||
|---|---|---|---|
| CD I | CD II | CD III | |
| Alchornea latifolia | 46.00±1.03 ab | 45.36±0.69 a | 46.69±1.27 b |
| Cupania dentata | 46.61±0.76 a | 46.92±0.91 b | 47.15±0.95 b |
| Inga punctata | 45.38±0.58 a | 45.83±0.84 ab | 46.36±0.64 b |
| Media general | 45.84±0.84 a | 46.12±1.07 ab | 46.63±1.05 a |
Mean±standard deviation, n=9. Means with different letters in a line are statistically different (Tukey; p≤0.05).
In A. latifolia, the CC was 46.40 % in the branches, 46.10 % in the leaves and 45.56 % in the trunk, although without significant differences (p˃0.05). Instead, the CC from leaves (47.71 %) of C. dentata was significantly higher than that from the trunk (46.11 %) and branches (45.62 %) (p≤0.01). A similar behavior was observed in I. punctata: the CC was significantly higher than the leaves with 46.51 %, compared to the branches (45.62 %) and the trunk (45.46 %) (p≤0.01). The trees with diametric categories above 20 cm (CD III) had higher values (p≤0.05) in the CC than the CDI and CDII in the three species (Table 3). The lowest CC was found in the stem of the CDI of I. punctata with 44.82 %, and the highest in the leaves of CD III of C. dentata with 47.72 %. All the values of CC in the structural components and in the diametric categories were lower than 50 % in the three species (Figure 1).
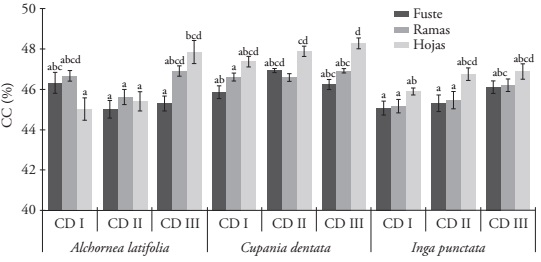
Figure 1 Average carbon concentration (CC) in the trunk, the branches and the leaves in the different diametric categories (DC) for the three species of tropical trees. The data are means ± standard deviation (n=3). Different letters in the bars indicate statistically significant differences (Tukey; p≤0.05).
The results obtained in CC for I. punctata had a similar performance to the study carried out by Pompa-García et al. (2017a) for Inga vera Willd. in the tropical forests of México, with a higher CC in the leaves (49 %) and 46 % of CC in the trunk; however, the CC in the branches (44 %) was lower than the one found in our study. Pompa-García et al. (2017) determined a higher CC in the trunk (48 %) and branches (47 %) in Croton draco Schltdl. & Cham., compared to the ones found in A. latifolia, and a lower CC in the leaves (39 %), although both species belong to the same family (Euphorbiaceae).
The three species showed the highest CC in the leaves, then in the branches and finally in the stem (Table 2). This variation is because in the leaves there is a higher accumulation of carbohydrates and the highest rates of volatile compounds (Watson and Casper, 1984; Yerena-Yamallel et al., 2012). The wood in the branches has a higher concentration of lignin and extracts from the stem wood, which results in a higher CC (Bert and Danjon, 2006), while the stem contains higher relative concentrations of non-structural carbohydrates (starch and simple sugars) (Hoch et al., 2003).
The trees in the higher diametric categories (CD III) showed a higher CC in the three tropical species; these patterns of changes in the increase of the CC dependent on the size of the tree were observed in other species of tropical trees, in Dominican Republic and Panama (Martin et al., 2013; Martin and Thomas, 2013). In the process of tree growth, the content of lignin decreases, and is compensated by the increase in other compounds of C in the wood, such as volatile compounds and, as consequence, a higher CC (Martin et al., 2013). In addition, the increase of CC due to the size of the tree can be because of a higher formation of tension wood in the larger trees in response to the increase of crown load in individuals of larger size (Du and Yamamoto, 2007).
The results from our study contribute key information about the inter-intra specific variation of CC and should be taken into account when quantifying the capture and storage of C in the forest. In addition, the incorporation of CC values in different structural tree components and diametric categories in allometric equations of biomass for the three tropical species (Aquino et al., 2015) are an important tool to improve scenarios of global C emissions (Gao et al., 2016).
Conclusions
The values of carbon concentration in the structural components of the tree obtained in the different diametric categories of the three tropical species were lower than 50 %, which is used as a standard in the calculation of the carbon content from the biomass. The structural component which showed a higher concentration of carbon was the leaves; and the trunk presented the lowest mean percentage in the three species. The trees with diameters larger than 20 cm showed the highest CC among all the species.
Literatura citada
Aquino R., M., A. Velázquez M., J. F. Castellanos B., H. M. De los Santos P., y J. D. Etchevers B. 2015. Partición de la biomasa aérea en tres especies arbóreas tropicales. Agrociencia 49: 299-314. [ Links ]
Basuki, T. M., P. E. van Laake, A.K. Skidmore, and Y. A. Hussin. 2009. Allometric equations for estimating the above-ground biomass in tropical lowland Dipterocarp forests. For. Ecol. Manage. 257: 1684-1694. [ Links ]
Becker, G. S., D. Braun, R. Gliniars, and H. Dalitz. 2012. Relations between wood variables and how they relate to tree size variables of tropical African tree species. Trees 26: 1101-1112. [ Links ]
Bert, D., and F. Danjon. 2006. Carbon concentration variations in the roots, stem and crown of mature Pinus pinaster (Ait.). For. Ecol. Manage . 222: 279-295. [ Links ]
De Mendiburu, F. 2016. Agricolae: Statistical Procedures for Agricultural Research. R package version 1.2-4. [ Links ]
Dlugokencky, E., and P. Tans. 2017. Trends in atmospheric carbon dioxide, National Oceanic & Atmospheric Administration, Earth System Research Laboratory (NOAA/ESRL). Disponible en: https://www.esrl.noaa.gov/gmd/ccgg/trends/global.html (Consulta: noviembre 2017). [ Links ]
Du, S., and F. Yamamoto. 2007. An overview of the biology of reaction wood formation. J. Integr. Plant Biol. 49: 131-143. [ Links ]
Dugan, A. J., R. Birdsey, S. P. Healey, Y. Pan, F. Zhang, G. Mo, J. Chen, C. W. Woodall, A. J. Hernandez, K. McCullough, J. B. McCarter, C. L. Raymond, and K. Dante-Wood. Forest sector carbon analyses support land management planning and projects: assessing the influence of anthropogenic and natural factors. Climatic Change 144: 207-220. [ Links ]
Elias, M., and C. Potvin. 2003. Assessing inter- and intra-specific variation in trunk carbon concentration for 32 neotropical tree species. Can. J. For. Res. 33: 1039-1045. [ Links ]
Etchevers, J. D., C. M. Monreal, C. Hidalgo, M. Acosta, J. Padilla, y R. M. López. 2005. Manual para la determinación de carbono en la parte aérea y subterránea de sistemas de producción en laderas. Colegio de Postgraduados. México. 29 p. [ Links ]
Figueroa N., C. M., G. Ángeles P., A. Velázquez M., y H. M. De los Santos P. 2010. Estimación de la biomasa en un Bosque bajo manejo de Pinus patula Schltdl. et Cham en Zacualtipán, Hidalgo. Rev. Mex. Cienc. For. 1: 105-112. [ Links ]
Figueroa N., C. M., J. D. Etchevers B., A. Velázquez M., y M. Acosta M. 2005. Concentración de carbono en diferentes tipos de vegetación de la Sierra Norte de Oaxaca. Terra Latinoam. 23: 57-64. [ Links ]
Gao, B., A. R. Taylor, H. H. Y. Chen, and J. Wang. 2016. Variation in total and volatile carbon concentration among the major tree species of the boreal forest. For. Ecol. Manage . 375: 191-199. [ Links ]
Gayoso A., J., y J. Guerra C. 2005. Contenido de carbono en la biomasa aérea de bosques nativos en Chile. Bosque26: 33-38. [ Links ]
Hernández-Vásquez, E., G. Campos-Ángeles, J. Enríquez-Del Valle, G. Rodríguez-Ortiz, y V. Velasco-Velasco. 2012. Captura de carbono por Inga jinicuil Schltdl. En un sistema agroforestal de café bajo sombra. Rev. Mex. Cienc. For. 3: 11-21. [ Links ]
Hernández-Vera, D., M. Pompa-García, J. I Yerena-Yamallel, y E. Alanís-Rodríguez. 2017. Within-tree carbon concentration variation in three Mexican pine species. Bosque 38: 381-386. [ Links ]
Hoch, G., A. Richter, and C. Körner. 2003. Non-structural carbon compounds in temperate forest trees. Plant, Cell and Environ. 26: 1067-1081. [ Links ]
Houghton, R.A. 2005. Aboveground forest biomass and the global carbon balance. Glob. Change Biol. 11: 945-958. [ Links ]
INEGI. 2010. Compendio de información geográfica municipal Pluma Hidalgo Oaxaca. http://www.inegi.org.mx/geo/contenidos/topografia/compendio.aspx . (Consulta: enero 2017). [ Links ]
IPCC. 2007. Climate change 2007: A synthesis. Report Summary for Policymakers. Intergovernmental Panel on Climate Change, IPCC Secretariat, Geneva, Switzerland. pp. 22. [ Links ]
Martin, A. R., and S. C. Thomas. 2011. A reassessment of carbon content in tropical trees. PloS one 6: e23533. [ Links ]
Martin, A. R., and S. C. Thomas. 2013. Size-dependent changes in leaf and wood chemical traits in two Caribbean rainforest trees. Tree Physiol. 33: 1338-1353. [ Links ]
Martin, A. R., S. C. Thomas, and Y. Zhao. 2013. Size-dependent changes in wood chemical traits: a comparison of Neotropical saplings and large trees. AoB PLANTS 5: plt039. [ Links ]
Montgomery, D. C. 2012. Design and Analysis of Experiments. John Wiley & Sons, 8th edition. 752 p. [ Links ]
Pennington, T. D., y K. Sarukhán. 2005. Manual para la Identificación de Campo de los Principales Árboles Tropicales de México. Tercera ed. Inst. Nal. Invest. Forest. SAG. México. 523 p. [ Links ]
Pompa-García, M., J. A. Sigala-Rodríguez, E. Jurado, and J. Flores. 2017a. Tissue carbon concentration of 175 Mexican forest species. iForest-Biogeosciences and Forestry 10: 754-758. [ Links ]
Pompa-García, M., J. A. Rodríguez, y E. Jurado, E. 2017b. Some tree species of ecological importance in Mexico: A documentary review. Rev. Chapingo Ser. Ciencias For. Ambiente 23: 185-219. [ Links ]
Pompa-García, M., y J. I. Yerena-Yamallel. 2014. Concentración de carbono en Pinus cembroides Zucc: fuente potencial de mitigación del calentamiento global. Rev. Chapingo Ser. Ciencias For. Ambiente 20: 169-175. [ Links ]
R Development Core Team. 2017. R: A language and environment for statistical computing. R Foundation for Statistical Computing, Vienna, Austria. [ Links ]
Razo Z., R., A. J. Gordillo M., R. Rodríguez L., C. C Maycotte M., y O. A. Acevedo S. 2015. Coeficientes de carbono para arbustos y herbáceas del bosque de oyamel del Parque Nacional El Chico. Rev. Mex. Cienc. For. 6: 58-67. [ Links ]
Tesfaye, M. A., A. Bravo-Oviedo, F. Bravo, and R. Ruiz-Peinado. 2016. Aboveground biomass equations for sustainable production of fuelwood in a native dry tropical afro-montane forest of Ethiopia. Ann. For. Sci. 73: 411-423. [ Links ]
Thomas, S. C., and A. R. Martin. 2012. Carbon content of tree tissues: a synthesis. Forests 3: 332-352. [ Links ]
Thomas, S. C., and G. Malczewski. 2007. Wood carbon content of tree species in Eastern China: Interspecific variability and the importance of the volatile fraction. J. Environ. Manage. 85: 659-662. [ Links ]
Ventura-Aquino, Y., B. Rendón, S. Rebollar, and G. Hernández. 2008. Use and conservation of forest resources in the municipality of San Agustín Loxicha, Sierra Madre del Sur, Oaxaca, México. Agrofor. Syst. 73: 167-180. [ Links ]
Villanueva-López, G., P. Martínez-Zurimendi, F. Casanova-Lugo, L. Ramírez-Avilés, and P. I Montañez-Escalante. 2015. Carbon storage in livestock systems with and without live fences of Gliricidia sepium in the humid tropics of Mexico. Agrofor. Syst. 89: 1083-1096. [ Links ]
Watson, M.A., and B. B. Casper. 1984. Morphogenetic constraints on patterns of carbon distribution in plants. Annu. Rev. Ecol. Syst. 15:233-258. [ Links ]
Yeboah, D., A. J. Burton, A. J. Storer, and E. Opuni-Frimpong. 2014. Variation in wood density and carbon content of tropical plantation tree species from Ghana. New Forests 45: 35-52. [ Links ]
Yerena-Yamallel, J. I., J. Jiménez-Pérez, O. A. Aguirre-Calderón, y E. J. Treviño-Garza. 2012. Contenido de carbono total en los componentes de especies arbóreas y arbustivas en áreas con diferente uso, en el matorral espinoso tamaulipeco, en México. Bosque 33:145-152. [ Links ]
Zhang, Q. Z., C. Wang, X. Wang, and X. Quan. 2009. Carbon concentration variability of 10 Chinese temperate tree species. For. Ecol. Manage . 258: 722-727. [ Links ]
Received: July 2017; Accepted: February 2018
 Este es un artículo publicado en acceso abierto bajo una licencia Creative Commons
