


Serviços Personalizados
Journal
Artigo
 texto em
  Inglês (pdf)
 Artigo em XML
 Referências do artigo
 Enviar este artigo por email
Indicadores
-
 Citado por SciELO
 -
 Acessos
Links relacionados
-
 Similares em
SciELO
Similares em
SciELO
Compartilhar

 Permalink
Agrociencia
versão On-line ISSN 2521-9766versão impressa ISSN 1405-3195
Agrociencia vol.52 no.2 Texcoco Fev./Mar. 2018
Crop Science
Nutrient concentration of purslane (Portulaca oleracea L.) in response to NPK fertilization
1Colegio de Postgraduados, Campus Montecillo. 56230. Km. 36.5, Carretera México-Texcoco, Montecillo, Texcoco. Estado de México.
2Departamento de Fitotecnia, Universidad Autónoma Chapingo. 56230. Km 38.5 Carretera México-Texcoco. Chapingo, Estado de México.
In order to find out a crop’s contribution of essential elements for humans, its nutrient concentration must be determined. The objective of this study was to evaluate the effect of NPK fertilization on water content, above-ground biomass production, and nutrient concentration of purslane (Portulaca oleracea L.), in three harvest dates (27, 34, and 42 d after its emergence). The study was conducted under field conditions. Four doses of N (0, 100, 200, and 300 kg N ha-1), P (0, 30, 60, and 90 kg P2O5 ha-1), and K (0, 40, 80, and 120 kg K2O ha-1) were evaluated in 12 treatments with a fully randomized block design with four replicates. The information was analyzed by regression. The N applied increased the concentration of N, P, S, Fe, Mn, Cu, Zn, and B, and decreased the concentration of K and Ca. Applying P increased the concentration of P. Applying K decreased the concentration of K, Ca, Mg, and Na. Late harvest dates increased the concentrations of N, K, Na, Mn, Fe, and Cu. The concentration of Na, Cu, and Zn do not exceed the limits established for their fresh consumption. Purslane contributes substantial amounts of K, Ca, Mg, Mn, Fe, and Zn that could contribute to the recommended daily intake of essential minerals.
Key words: Portulaca oleracea L.; nitrogen fertilization; micronutrients; essential minerals
La concentración nutrimental de un cultivo permite conocer el aporte de elementos esenciales para los humanos. El objetivo del presente estudio fue evaluar el efecto de la fertilización con NPK en el contenido de agua, producción de biomasa aérea y concentración nutrimental de la verdolaga (Portulaca oleracea L.) en tres fechas de cosecha (27, 34 y 42 d después de la emergencia). El estudio se realizó en condiciones de campo. Cuatro dosis de N (0, 100, 200 y 300 kg N ha-1), P (0, 30, 60 y 90 kg P2O5 ha-1) y K (0, 40, 80 y 120 kg K2O ha-1) se evaluaron en 12 tratamientos con un diseño de bloques completos al azar y cuatro repeticiones. La información se analizó mediante regresión. El N aplicado incrementó la concentración de N, P, S, Fe, Mn, Cu, Zn y B y disminuyó la concentración de K y Ca. La aplicación de P incrementó la concentración de P. La aplicación de K disminuyó la concentración de K, Ca, Mg y Na. Las fechas de cosecha más tardías aumentaron las concentraciones de N, K, Na, Mn, Fe y Cu. La concentración de Na, Cu y Zn no sobrepasan los límites establecidos para su consumo fresco. La verdolaga tiene aporte substancial de K, Ca, Mg, Mn, Fe, y Zn que podrían contribuir con la ingesta diaria recomendada de minerales esenciales.
Palabas claves: Portulaca oleracea L.; fertilización nitrogenada; micronutrientes; minerales esenciales
Introduction
In Mexico, 454 ha of purslane (Portulaca oleracea L.) are sown under irrigation and dry land farming conditions. In the states of Morelos, Baja California, and Mexico City, the average yields are 19.18, 10.13, and 9.47 t ha-1 (SIAP, 2014), respectively. Producers in Mexico City have achieved yields up to 40 t ha-1 (according to personal communication with local producers).
Researches about nutrient concentration in plants establish the basis of the crops’ fertilization. Concentration can be adjusted during the crop cycle and the amount of fertilizer to be used can be optimized (Greenwood, 1983). As a result of its contribution to human nutrition, determining the nutrient concentration in plants is also useful (FNB/FNIC, 2001).
The content of N, P, K, Ca, and Mg varies between wild purslane, ornamental purslane, stages of growth, weather conditions, fertilization, and harvest date (Teixeira and Carvalho, 2009; Kaymak, 2013; Alam et al., 2014; Petropoulos et al., 2015). In Mexico, the studies have focused on the ethnobotanical description, while studies about nutrient concentration in the above-ground biomass are infrequent. The objective of this research was to determine the concentrations of N, P, K, Ca, Mg, Na, S, Mn, Fe, Cu, Zn, and B in the above-ground biomass of purslane in three dates of commercial harvest, according to the amount of N, P, and K applied.
Materials and Methods
The study was carried out in the Experimental Field of Colegio de Postgraduados, Campus Montecillo, Estado de Mexico (19° 28’ 2.07” N, 98° 54’ 1.71” W, at a 2215-m altitude), in July and August, 2014. The zone has a temperate semi-arid climate (Bs 1 kwe (w) (i’) g), with summer rains (July to September), a 625-mm average annual precipitation, and 22 °C average temperatures (García, 1973). It has a Mollic Ustifluvent soil type (Soil Survey Staff, 2010), with a 150-cm depth, and a silt loam texture (Ap horizon). Rainfall in June, July and August, 2014, was 135.2, 142.5, and 134.1 mm, respectively. The average daily maximum temperatures in July and August varied from 19 to 30 °C, and the minimum temperatures varied from 6 to 11 °C.
Plant material
The purslane seeds were collected in Mixquic, Mexico City. Purslane plants usually grow erect, have few branches, but large leaves and green stems.
Treatments and experimental design
Purslane was grown under field and dry land farming conditions, with four doses of N (0, 100, 200, and 300 kg N ha-1), P (0, 30, 60, and 90 kg P2O5 ha-1), and K (0, 40, 80, and 120 kg K2O ha-1). Each element was applied separately with the third dose of the other two nutrients under a non-limiting or sufficiency condition (Table 1). The 12 treatments generated were distributed in a fully randomized block design with four replicates. The experimental units were handmade 3 x 1.5 m rectangles (length x width). The net harvest area of the plot (“useful plot”) had an area of 4.5 m2. Fertilizer sources were ammonium sulfate [(NH4)2SO4, 21 % N], monoammonium phosphate [NH4H2PO4, 12 % N and 61 % P2O5], and potassium sulfate [K2SO4, 51 % K2O].
Table 1 Fertilization dose of the treatments under study.
| Tratamiento | Dosis de fertilización | ||
| N (kg N ha-1) | P (kg P2O5 ha-1) | K (kg K2O ha-1) | |
| N0 | 0 | 60 | 80 |
| N100 | 100 | 60 | 80 |
| N200 | 200 | 60 | 80 |
| N300 | 300 | 60 | 80 |
| P0 | 200 | 0 | 80 |
| P30 | 200 | 30 | 80 |
| P60 | 200 | 60 | 80 |
| P90 | 200 | 90 | 80 |
| K0 | 200 | 60 | 0 |
| K40 | 200 | 60 | 40 |
| K80 | 200 | 60 | 80 |
| K120 | 200 | 60 | 120 |
Experiment set-up
The soil was prepared following the procedures used by the Mixquic producers, including: ploughing and preparing the land with a harrow, digging irrigation channels, and setting-up cultivation beds or “melgas” (piece of land ready for sowing). Thirty cm wide contours were built around each melga: an activity known as piling up (acamellonar) or framing (encuadrar). Sowing was carried out on July 3, 2014: first 1.86 g m-2 of seed (4726 seeds g-1) were scattered, followed by 3.5 t ha-1 of poultry manure to stimulate germination. Half of the nitrogen fertilizer and all the P and K were applied 25 d after sowing (das), and the rest 32 das. Weed control was carried out manually and no insecticides or fungicides were applied. Purslane was harvested during its plant maturity, 27 d after the emergence (dae, C1); during its first flowering, 34 dae (C2); and during its second flowering, 42 dae (C3).
Soil sampling and analysis
A soil sample -composed of 10 subsamples- was obtained at a 0-20 cm depth from each experimental unit. The samples were dehydrated at 40-50 °C, for 2 days and were afterwards sieved (2 mm). Evaluations included pH, electrical conductivity (EC) (Richards, 1990), organic matter (Jackson, 1976), P (Olsen and Dean, 1965), interchangeable bases -K, Ca, Mg, and Na- (Chapman, 1965), micro-elements -Fe, Cu, Zn, and Mn- (Aguilar et al., 1987), and texture (Bouyoucos, 1936). The values were: pH 8.2; EC 0.36 dS m-1; organic matter 2.29 to 3.0 %. The following elements were also found in mg kg-1: P 12 to 35; K 546 to 819; Ca 560 to 780; Mg 125 to 192; Na 6.9; Fe 9; Cu 1.3; Zn 24 to 29; and Mn 1.5. The texture was silt loam.
Plant sampling and analysis
Above-ground biomass was harvested with a 0.0625-m2 wooden frame. This frame was placed on the soil of each experimental unit, and the plant within the frame was cut at ground level. The plant material was kept at 70 °C, for 72 h. The dry tissue was weighed, and the water content in the above-ground biomass was calculated.
The dry above-ground biomass was ground and sieved in a 1.0 mm sieve, to determine its nutrient concentrations. The concentration of N was determined by the Kjeldahl method (Alcántar and Sandoval, 1999). In order to determine P, K, Ca, Mg, Na, S, Mn, Fe, Cu, Zn, and B, tissue was subject to wet digestion using a mixture of nitric and perchloric acids (HNO3:HClO4, 2:1) (Alcántar y Sandoval, 1999). K and Na were measured by flame photometry with a Corning 400-flame Photometer equipment, and the remaining elements were measured with an atomic emission induction plasma-coupled spectrometry equipment (ICP-AES, VARIAN®, Liberty II model, Mulgrave, Australia).
Statistical analysis of information
A regression model was determined for each nutrient concentration of the biomass, as a function of N, P, and K applied, and three harvest dates, which were considered as auxiliary variables (harvest 1: C1=0, C2=0, C3=0; harvest 2: C1=0, C2=1, C3=0; harvest 3: C1=0, C2=0, C3=1); besides, soil factors (organic matter, P Olsen, and interchangeable K) were also included. The model was estimated with the method described by Volke (2008): specifying a model with one or few variables, based on the graphic relationship between the response variables and the factors under study; then variables are incorporated into the model, based on the graphic relationship between the residuals and the factors not yet been included in the model, but which show some response tendency. This method is followed until a model with the lowest mean squared error (MSE) is obtained. The regression models were obtained with the SAS 8.2 statistical software for Windows, and the charts of the nutrient concentration based on the N, P, and K and the crops were generated with the values estimated by the models.
Results and Discussion
The regression models of the nutrient concentrations showed variable effects depending on the nutrient applied and the harvest date. In contrast, none showed effect due to the variation of organic matter, P, or K in the soil.
The water content in the above-ground biomass of purslane increased with the N applied, from 94.2 to 95.3 % in harvest 1 and from 94.2 to 95.8 % in harvest 2; the water content in harvest 3 increased from 92.7 to 94.9, with 0 and 300 kg N ha-1 (Table 2, Figure 1).
Table 2 Regression models for water content and concentration of N, P, and K in the above-ground biomass of purslane (Portulaca oleracea L.), based on the amount of N, P and K applied and harvest dates.
| Modelo de regression | Pr. F | CV % | R2 |
| H = 94.244 - 1.542 C3 + 0.0604 N0.50 + 0.00170 C2 N + 0.00402 C3 N | ** | 0.43 | 0.710 |
| cN = 25.230 + 0.0520 N + 0.00325 N P0.50 | ** | 10.59 | 0.642 |
| cP = 3.279 + 0.00425 P + 0.0564 P0.50 + 0.00256 N | ** | 7.53 | 0.407 |
| cK = 12.118 + 0.0306 N - 0.0001582 N2 + 0.1104 K - 0.00111 K2 - 1.4286 C3 | ** | 11.65 | 0.705 |
H: water content in the above-ground biomass of purslane (%); cN: concentration of N (mg g-1); cP: concentration of P (mg g-1); cK: concentration of K (mg g-1); N: dose of N (kg ha-1); P: dose of P (kg P2O5 ha-1); C2 and C3 are auxiliary variables for harvest 2 and 3 in relation to harvest 1. Pr. F.: probability of F; ** p=0.01; CV: coefficient of variation (%); and R2: coefficient of multiple determination.
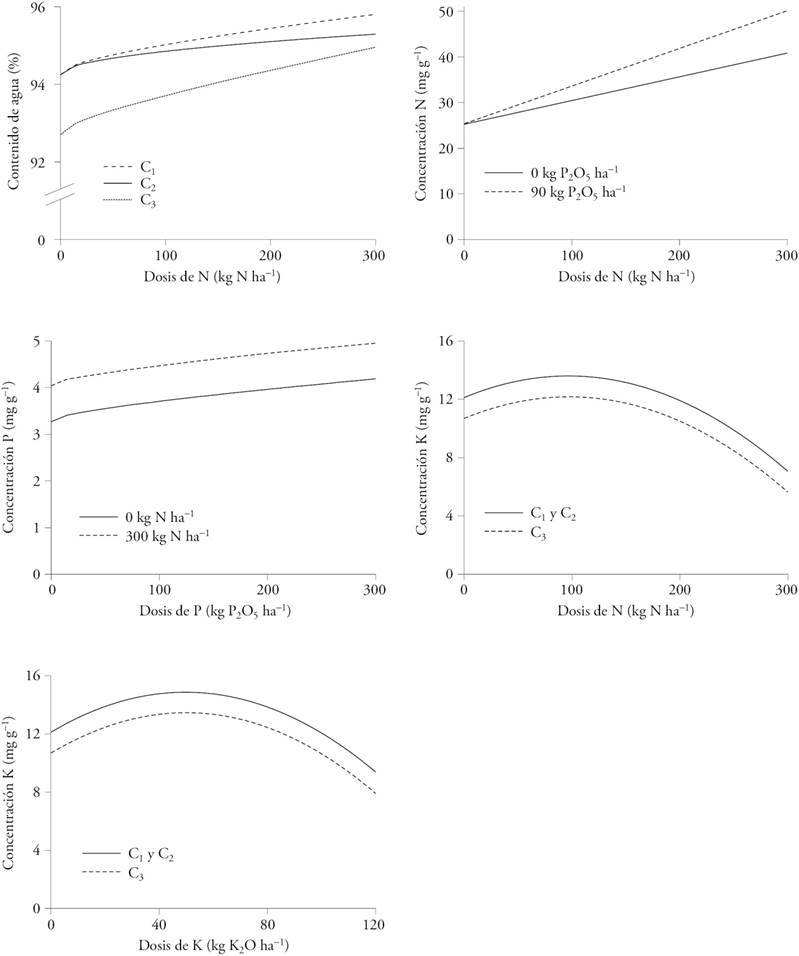
Figure 1 Water content and concentration of N, P, and K in the above-ground biomass of purslane (Portulaca oleracea L.), based on the amount of N, P, and K applied, and harvest date. C1: harvest 1 to 27 days after emergence (dae); C2: harvest 2 to 34 dae; and C3: harvest 3 to 42 dae.
The water content in above-ground biomass of purslane was similar to the results of Kaymak (2013) and Lara et al. (2011). Karkanis and Petropoulos (2017) reported differences between purslane cultivars from Iran and Greece, without significant variations in harvest time: 26 das (i.e., 91 to 93 %) and 45 das (i.e., 90 to 94 %). Uddin et al. (2012a) observed that water content decreased as the harvest time was extended, from 90 to 74 % at 15 and 60 das. The water content in the above-ground biomass of purslane decreased under salt stress conditions, as a result of adding NaCl to the nutrient solution (Teixeira and Carvallho, 2009; Kafi and Rahimi, 2011; Uddin et al., 2012b). In contrast, the water content in the tissue was not affected by water stress (drought) or water saturation in the soil (Uddin et al., 2017).
The concentration of N in above-ground biomass increased when N and P were applied -and by the interaction between both factors- from 25.2 to 40.8 mg N g-1 with 300 kg N ha-1. The maximum concentration was 50.0 mg g-1 with 90 kg P2O5 ha-1, and 300 kg N ha-1 (Table 2, Figure 1).
These values matched those obtained by Kaymak (2013) (24 mg N g-1, applying 150 kg N ha-1), Viana et al. (2015) (28.6 mg N g-1), and Graifenberg et al. (2003) at 124 das under hydroponic conditions (28 and 32 mg N g-1), with 0 and 3 g L-1 of NaCl in the nutrient solution. Uddin et al. (2017) observed that water stress affected the concentration of N in purslane -10 saturated days followed by field capacity condition, with 15.7 mg N g-1- compared to continuous flooding -with 31.4 mg N g-1. Fontana et al. (2006) reported concentrations of 6.3 and 7.8 mg g-1, with 12 and 36 mmol N L-1 in the nutrient solution, respectively. Alam et al. (2014) obtained maximum concentrations of 118 and 184 mg N g-1 in two genotypes of Malayan purslane.
The N and P applied increased the content of P: starting from 3.28 mg g-1 (in 0.77 mg P g-1 with 300 kg N ha-1), and from 1.01 (90 kg P2O5 ha-1) (Table 2, Figure 1).
Nitrogen fertilizer modified the P content in purslane, with values of 2.4, 2.5, 2.7, and 2.9 mg P g-1 with ammonium sulfate, ammonium nitrate, urea, and calcium ammonium nitrate, respectively (Kaymak, 2013). Under saline conditions, the concentration of P in above-ground biomass increased, from 4.7 to 5.8 mg P g-1 with 0 and 3 g NaCl L-1 (Graifenberg et al., 2003), respectively. Concentrations of P in purslane from Brazil and Malaysia were higher than those of our study: 5.3 mg g-1 (Viana et al., 2015), and 8.3 and 14.1 mg g-1 (Alam et al., 2014).
The concentration of K in the above-ground biomass increased with the N and K applied, from 12.1 to 13.5 mg g-1 with 95 kg N ha-1, and up to 14.9 mg g-1 with 50 kg K2O ha-1. After reaching these maximum values, the concentration of N and K decreased. During harvest 3, K concentration decreased by 1.43 mg g-1 (Table 2, Figure 1).
According to the bibliography, concentrations of K in purslane are higher than those of this study: 22.5 and 37.9 mg K g-1 in Turkey; 53.7 mg K g-1 in Brazil; and 478 and 586 mg K g-1 in Malaysia (Kiliç et al., 2008; Kaymak, 2013). In addition, Uddin et al. (2012a) observed 50, 51, and 59 mg K g-1 increases according to the harvest date at 30, 45, and 60 das, respectively. In hydroponic systems, adding NaCl to the nutrient solution decreased concentrations of K of 29.1 and 43.7 mg g-1 fresh weight (FW), with 0.8 and 24.2 dS m-1, respectively (Teixeira and Carvalho, 2009). In the nutrient solution of floating tray systems, aeration modified K concentrations, with levels from 3.8 to 4.5 mg K kg FW and from 3.2 to 4.3 mg K kg FW; meanwhile, the lack of aeration modified the levels from 2.5 to 4.0 mg K kg FW (Lara et al., 2011).
The concentration of S in the above-ground biomass decreased in harvest 2 and 3, by 1.34 and 1.55 mg g-1. In contrast, applying doses of N of up to 170 kg N ha-1 increased the content of S in all crops and reached 3.92, 2.59, and 2.37 mg S g-1 in harvest 1, 2, and 3, respectively (Table 3, Figure 2). Viana et al. (2015) obtained similar concentrations of S (2.8 mg S g-1); in contrast, Kaymak (2013) determined lower concentrations (0.47 to 0.55 mg S g-1).
Table 3 Regression models for concentrations of S, Ca, Mg, and Na in the above-ground biomass of purslane (Portulaca oleracea L.), based on the amount of N and K applied and harvest dates.
| Modelo de regression | Pr. F | CV % | R2 |
| S = 3.11 + 0.0094 N - 0.0000272 N2 - 1.337 C2 - 1.555 C3 | ** | 16.28 | 0.742 |
| Ca = 9.866 - 0.00798 K - 0.194 C2 - 0.550 C3 | ** | 14.05 | 0.504 |
| Mg = 15.678 - 0.0195 K + 0.555 C2 + 0.628 C3 | ** | 4.14 | 0.669 |
| Na = 4.674 - 0.00574 N + 0.00000377 N2 - 0.0223 K + 0.0000961 K2 + 0.391 C2 + 0.203 C3 | ** | 9.81 | 0.779 |
The concentration of elements is expressed in mg g-1. N: dose of N (kg ha-1); K: dose of K (kg K2O ha-1); C2 and C3 are auxiliary variables for harvest 2 and 3 in relation to harvest 1. Pr. F.: probability of F; **p=0.01, CV: coefficient of variation (%); and R2: coefficient of multiple determination.
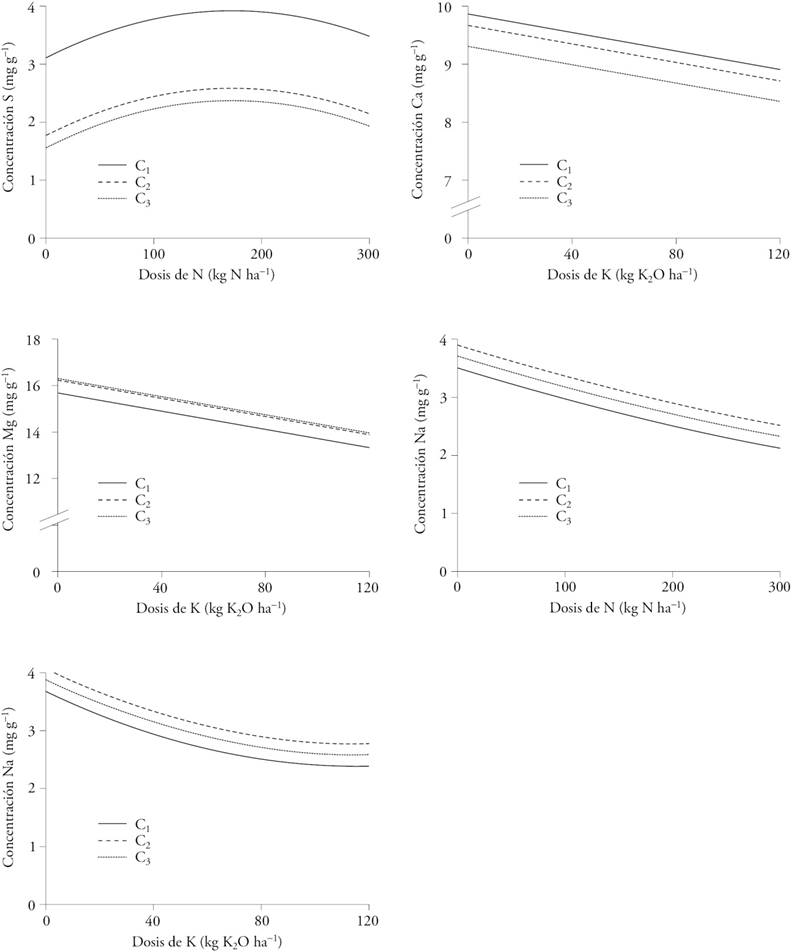
Figure 2 Concentrations of S, Ca, Mg, and Na in the above-ground biomass of purslane (Portulaca oleracea L.), based on the amount of N and K applied, and harvest date. C1: harvest 1 to 27 days after emergence (dae); C2: harvest 2 to 34 dae; and C3: harvest 3 to 42 dae.
In harvest 1, the concentration of Ca in the above-ground biomass decreased from 9.86 to 8.90 mg g-1 when 120 kg K2O ha-1 was applied; at the same time, in harvest 2 and 3, the decrease in the concentration of Ca was 0.19 and 0.55 mg g-1 (Table 3, Figure 2).
In harvest 1, the concentration of Mg in the above-ground biomass decreased, from 15.67 to 13.34 mg Mg g-1 with 120 kg K2O ha-1; in contrast, in harvest 2 and 3, the concentration increased by 0.55 and 0.63 mg Mg g-1 (Table 3, Figure 2).
N (300 kg N ha-1) and K (115 kg K2O ha-1) decreased Na, from 4.67 to 3.29 mg g-1 and 3.38 mg g-1 in the above-ground biomass; in contrast, harvest 2 and 3 increased the concentration by 0.39 and 0.20 mg Na g-1 (Table 3, Figure 2).
Alam et al. (2014) determined Ca (37 and 43 mg g-1) and Mg (46 and 49 mg g-1) concentrations, which are higher than those found in our study; Viana et al. (2015) also obtained more Ca (14 mg g-1) but less Mg (8.4 mg g-1). Kaymak (2013) observed that the concentrations of Ca (12 to 15 mg g-1) and Mg (1.4 to 1.5 mg g-1) in purslane depend on the source nitrogenous fertilizer that is used (ammonium sulfate, ammonium nitrate, urea, and calcium ammonium nitrate). Uddin et al. (2012a) reported that the concentration of Ca (64.6 to 77.9 mg g-1) and Mg (51.7 to 59.4 mg g-1) in purslane increased at 15 and 60 das, while the concentration of Na (6.3 to 8.2 mg g-1) decreased depending on the harvest date. Teixeira and Carvalho (2009) observed that the presence of NaCl (0.8 to 24 dS m-1) in the nutrient solution decreased the concentration of Ca (44.7 to 87.37 mg g-1) and increased the content of Na (14.2 to 36.9 mg g-1) in purslane stems and leaves, while concentrations were higher in spring than in summer. Petropoulos et al. (2015) reported higher content of Ca and Mg in purslane from Iran (0.21 to 0.23 mg Ca g-1 FW and 0.14 to 0.17 mg Mg g-1 FW) than in purslane from Greece (0.15 to 0.17 mg Ca g-1 FW and 0.12 mg Mg g-1 FW). Egea-Gilabert et al. (2014) observed different concentrations of Na among purslane genotypes from Spain, with variations ranging from 0.55 to 0.79 mg g-1 FW. Lara et al. (2011) indicated that the concentration of Na increased under anaerobic conditions when the nutrient solution was placed in floating trays.
The concentration of Mn in the above-ground biomass increased as a result of applying N (from 54.9 to 65.7 mg Mn kg-1 with 300 kg N ha-1) in harvest 1; likewise, an increase was observed in harvest 2 and 3 (66.6 and 64.6 mg Mn kg-1) (Table 4, Figure 3).
Table 4 Regression models for concentrations of Mn, Fe, Cu, Zn and B in the above-ground biomass of purslane (Portulaca oleracea L.), based on the amount of N applied and harvest dates.
| Modelo de regresión | Pr. F | CV % | R2 |
| Mn = 54.917 + 0.000120 N2 + 0.0389 C2 N+0.0324 C3 N | ** | 9.00 | 0.619 |
| Fe = 613.614 + 1.546 N - 0.00381 N2 + 549.83 C2 + 703.24 C3 | ** | 23.61 | 0.598 |
| Cu = 11.322 = 0.0133 N + 1.470 C2 + 2.453 C3 | ** | 8.95 | 0.632 |
| Zn = 31.518 + 0.0769 N - 0.000132 C2 N2 - 0.000149 C3 N2 | ** | 13.95 | 0.543 |
| B = 31.88 + 0.022 N - 0.000066 N2 - 4.439 C2 | ** | 6.61 | 0.547 |
The concentration of elements is expressed in mg kg-1. N: dose of N (kg ha-1); C2 and C3 are auxiliary variables for harvest 2 and 3 in relation to harvest 1. Pr. F.: probability of F; ** p=0.01; CV: coefficient of variation (%); and R2: coefficient of multiple determination.
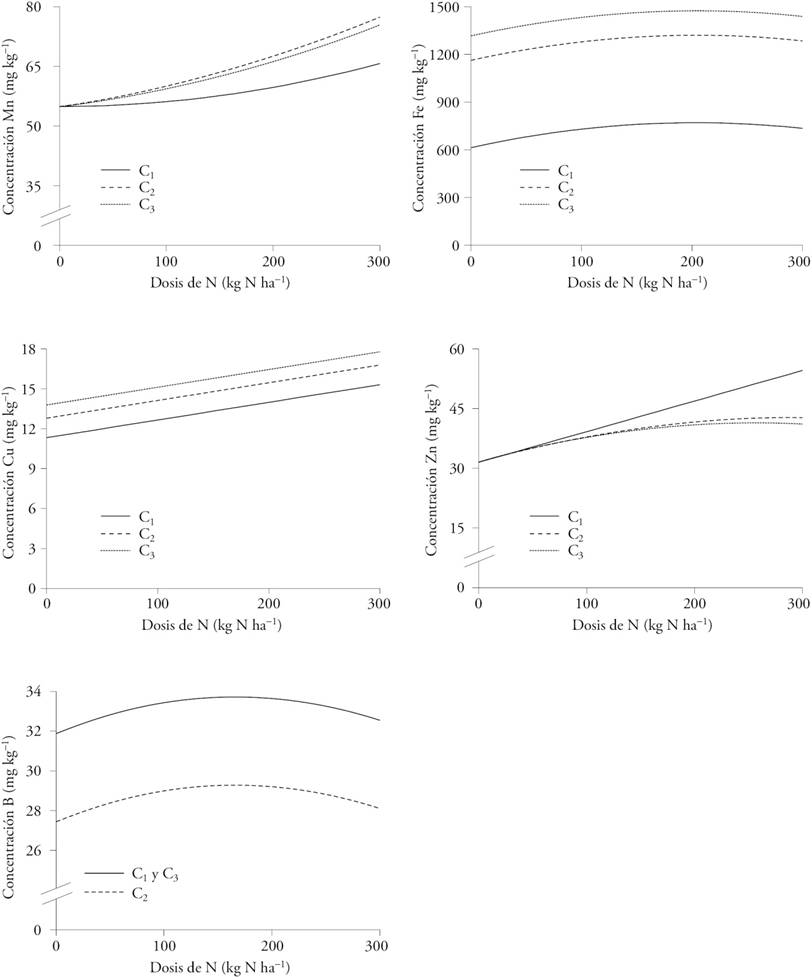
Figure 3 Concentrations of Mn, Fe, Cu, Zn, and B in the above-ground biomass of purslane (Portulaca oleracea L.), based on the amount of N applied, and harvest date. C1: harvest 1 to 27 days after emergence (dae); C2: harvest 2 to 34 dae; and C3: harvest 3 to 42 dae.
The concentration of Fe increased in harvest 1, from 613.6 to 769.8 mg Fe kg-1, in the above-ground biomass with 190 kg N ha-1. In harvest 2 and 3, the increase reached 549.8 and 703.2 mg Fe kg-1 (Table 4 and Figure 3).
Doses of 300 kg N ha-1 increased the concentration of Cu in the above-ground biomass, from 11.3 to 15.3 mg Cu kg-1. Harvest 2 and 3 increased by 1.5 and 2.4 mg Cu kg-1 (Table 4, Figure 3).
In the above-ground biomass of harvest 1, 300 kg N ha-1 increased the concentration of Zn from 31.5 to 54.6 mg Zn kg-1; however, in harvest 2 and 3, Zn decreased by 19.3 and 18.1 mg Zn kg-1 (Table 4, Figure 3).
With 165 kg N ha-1, the concentration of B also increased, from 31.9 to 33.7 mg B kg-1 in harvest 1 and 3, respectively; however, the concentration decreased in harvest 2, by 4.4 mg B kg-1 (Table 4, Figure 3).
Viana et al. (2015) observed 22, 188, 14, 126, and 41 mg of Mn, Fe, Cu, Zn, and B per g of purslane from Brazil. Alam et al. (2015) determined 1.6, 1.0, and 1.4 mg of Mn, Fe, and Zn per g of purslane from Malaysia. In addition, Petropoulos et al. (2015) observed significant differences in the concentration of Zn (2.1 to 3.3 mg kg-1 FW), Fe (1.6 to 23.4 mg kg-1 FW), and Mn (4.5 to 5.9 mg kg-1 FW) in purslane genotypes from Greece and Iran. Kaymak (2013) observed significant differences as a result of the source of nitrogen fertilizer (ammonium sulfate, ammonium nitrate, urea, and calcium ammonium nitrate) in B (8.9 to 9.7 mg kg-1), Cu (8.3 to 11.4 mg kg-1), Fe (184 to 255 mg kg-1), and Zn (16 to 20 mg kg-1); but Mn (15 mg kg-1) was not modified. Concentrations lower than those mentioned above were obtained in our study. Uddin et al. (2012a) reported that the concentration of Fe (12.2 to 14.6 mg g-1) and Zn (8.4 to 10.4 mg g-1) increased between 15 and 60 das.
The recommended daily intake for humans is 34 to 56 g of protein, 0.7 to 1.2 g of P, 4.5 to 4.7 g of K, 1.0 to 1.3 g of Ca, 0.30 to 0.42 g of Mg, 1.2 to 1.5 g of Na, 1.3 to 2.6 mg of Mn, 8 to 18 mg of Fe, 0.7 to 0.9 mg of Cu, 8 to 12 mg of Zn, with a maximum limit of 2.3 g of Na, 10 mg of Cu, 40 mg of Zn, and 17 mg of B (FNB/FNIC, 2001). The results of this study indicate that -depending on the application of N, P, K, and the harvest date-, 5 g of dried purslane or 87 to 119 g of fresh purslane can provide 0.8 to 1.6 g of protein (equivalent to 25 and 50 mg N g-1), 19 to 23 mg of P, 36 to 77 mg of K, 41 to 49 mg of Ca, 66 to 81 mg of Mg, 10 to 20 mg of Na, 0.3 to 0.4 mg of Mn, 3.1 to 7.4 mg of Fe, 0.1 mg of Cu, 0.2 to 0.3 mg of Zn, and 0.1 to 0.2 mg of B. Since it includes all these components, purslane can be considered as a nutritious alternative.
Conclusions
Applying N increases the water content and the concentration of N, P, S, Mn, Fe, Cu, Zn, and B, and decreases the concentration of K and Na in the above-ground biomass. Applying P increases the concentration of P. High doses of K decrease the concentration of K, Ca, Mg, and Na. The content of N, K, Na, Mn, Fe, and Cu in late harvests is higher, while water, S, Ca, Mg, Zn, and B content decreases. Purslane is a nutritious alternative, as a result of its high content of N protein, Mg, Mn, and Fe, and its low content of Na, Cu, Zn, and B.
Literatura citada
Alam, M. A., A. S. Juraimi, M. Y. Rafii, A. A. Hamid, F. Aslani, M. A. M. Zainudin, and Md. K. Uddin. 2014. Evaluation of antioxidant compounds, antioxidant activities, and mineral composition of 13 collected purslane (Portulaca oleracea L.) accessions. BioMed Res. Int. 2014: 1-10. [ Links ]
Alcántar, G. G., y M. Sandoval V. 1999. Manual de Análisis Químico de Tejido Vegetal. Sociedad Mexicana de la Ciencia del Suelo A. C. Publicación Especial No. 10. Chapingo, México. 156 p. [ Links ]
Bouyoucos, G. L. 1936. Direction for making mechanical analysis of soils by the hydrometer method. Soil Sci. 42: 3. [ Links ]
Chapman, H. D. 1965. Cation exchange capacity. In: C.A. Black (ed). Methods of analysis. Part 2. Agronomy 9. American Society of Agronomy. Madison, WI. pp: 891-901. [ Links ]
Egea-Gilabert, C., V. Ruiz-Hernández, and P. Angeles. 2014. Characterization of purslane (Portulaca oleracea L.) accessions: Suitability as ready-to-eat product. Sci. Hortic. 172: 73-81. [ Links ]
FNB/FNIC. 2001. Dietary reference intakes (DRI) and recommended dietary allowances (RDA), dietary reference intakes: elements. Food and Nutrition Information Center. http://www.nal.usda.gov/fnic/etext/000105.html (Consulta: enero, 2014). [ Links ]
Fontana, E., J. Hoeberechts, S. Nicola, V. Cros, G. Palmegiano, and P. Peiretti. 2006. Nitrogen concentration and nitrate/ammonium ratio affect yield and change the oxalic acid concentration and fatty acid profile of purslane (Portulaca oleracea L.) grown in a soilless culture system. J. Sci. Food Agric. 86: 2417-2424. [ Links ]
García, E. 1973. Modificaciones al sistema de clasificación climática de Köppen. Instituto de Geografía, Universidad Nacional Autónoma de México. México, D.F. 96 p. [ Links ]
Graifenberg, A., L. Botrini, L. Giustiniani, F. Filippi, and M. Curadi. 2003. Tomato Growing in Saline Conditions with Biodesalinating Plants: Salsola soda L., and Portulaca oleracea L. Acta Hortic. 609: 301-305. [ Links ]
Greenwood, D. J. 1983. Quantitative theory and the control of soil fertility. New Phytol. 94: 1-18. [ Links ]
Jackson, M. L. 1976. Análisis químico de suelos. Trad. al español por M. J. Beltran. 3a ed. Omega. Barcelona, España. 92 p. [ Links ]
Karkanis, A. C., and S. A. Petropoulos. 2017. Physiological and Growth Responses of Several Genotypes of Common Purslane (Portulaca oleracea L.) under Mediterranean Semi-arid Conditions. Not. Bot. Horti Agrobot. Cluj-Napoca 45: 69-575. [ Links ]
Kaymak, H. C. 2013. Effect of nitrogen forms on growth, yield and nitrate accumulation of cultivated purslane (Portulaca oleracea L.). Bulg. J. Agric. Sci. 19: 444-449. [ Links ]
Kiliç, C. C., Y. S. Kukul, and D. Anaç. 2008. Performance of purslane (Portulaca oleracea L.) as a salt-removing crop. Agric. Water Manage. 95: 854-858. [ Links ]
Lara, L., C. Egea-Gilabert, D. Niñirola, E Conesa, and A. Fernández. 2011. Effect of aeration of the nutrient solution on the growth and quality of purslane (Portulaca oleracea). J. Hortic. Sci. Biotechnol. 86: 603-610. [ Links ]
López-Ríos, G. 1996. Domesticación de la verdolaga (Portulaca oleracea L.) y semidomesticación del romerillo (Suaeda difusa Wats.) en el sistema agrícola de chinampas de San Gregorio Atlapulco, Xochimilco, D.F. Rev. Geogr. Agríc. 22-23: 103-112. [ Links ]
Olsen, S. R., and L. A. Dean. 1965. Phosphorus. In: C. A. Black (ed). Methods of Soil Analysis. Part 2. Agronomy 9. American Society of Agronomy. Madison, WI. pp: 1035-1049. [ Links ]
Petropoulos S., A. Karkanis, A. Fernandes, L. Barros, I. C. F. R. Ferreira, G. Ntatsi, K. Petrotos, C. Lykas, and E. Khah. 2015. Chemical composition and yield of six genotypes of common purslane (Portulaca oleracea L.): An alternative source of omega-3 fatty acids. Plant Foods Hum. Nutr. 70: 420-426. [ Links ]
Richards, L. A. 1990. Diagnóstico y Rehabilitación de Suelos Salinos y Sódicos. 6a ed. Departamento de Agricultura de Estados Unidos de América. Limusa. México, D.F. 172 p. [ Links ]
Servicio de Información Agroalimentaria y Pesquera (SIAP). 2014 2014 https://www.gob.mx/siap/ (Consulta: enero, 2014). [ Links ]
Soil Survey Staff. 2010. Claves para la Taxonomía de Suelos, Ortiz-Solorio, C. A, Gutiérrez-Castorena, Ma del C. (trads). Undécima Edición. USDA-Natural Resources Conservation Service, Washington, D.C. 374 p. [ Links ]
Teixeira, M., and I. S. Carvalho. 2009. Effects of salt stress on purslane (Portulaca oleracea) nutrition. Ann. Appl. Biol. 154: 77-86. [ Links ]
Uddin, M. K., S. A. Juraimi, M. E. Ali, and M. R. Ismail. 2012a. Evaluation of antioxidant properties and mineral composition of purslane (Portulaca oleracea L.) at different growth stages. Int. J. Mol. Sci. 13: 10257-10267. [ Links ]
Uddin, M. K. , S. A. Juraimi, F. Anwar, M. A. Hossain, and M. A. Alam. 2012b. Effect of salinity on proximate mineral composition of purslane (Portulca oleracea L.). Aust. J. Crop Sci. 6: 1732-1736. [ Links ]
Uddin, M. K., S. G. Sam, A. Awang, A. S. Juraimi, M. B. Jalloh, M. S. Madon, and S. M. Shamsuzzaman. 2017. Effect of water regimes on growth, total flavonoid and phenolic content of purslane (Portulaca oleracea L.). Bangl. J. Bot. 46: 255-262. [ Links ]
Volke, H. V. 2008. Estimación de funciones de respuesta para información de tipo no experimental, mediante regresión. Colegio de Postgraduados. Montecillo, Estado de México, México. 113 p. [ Links ]
Received: June 01, 2016; Accepted: December 01, 2017
 Este es un artículo publicado en acceso abierto bajo una licencia Creative Commons
