


Services on Demand
Journal
Article
 text in
  English (pdf)
 Article in xml format
 Article references
 Send this article by e-mail
Indicators
-
 Cited by SciELO
 -
 Access statistics
Related links
-
 Similars in
SciELO
Similars in
SciELO
Share

 Permalink
Agrociencia
On-line version ISSN 2521-9766Print version ISSN 1405-3195
Agrociencia vol.51 n.8 Texcoco Nov./Dec. 2017
Water-Soil-Climate
Soil quality indicators to evaluate soil fertility
1Colegio de Postgraduados. Campus Montecillo. Colegio de Postgraduados. 56230. Montecillo, Estado de México. (hidalgo@colpos.mx).
The Mixteca Alta Oaxaqueña, Mexico (MAO), presents moderate to severe levels of soil degradation. Water and wind erosion are the main causes of this degradation, with soil losses between 50 and 200 Mg ha-1 year-1 and in some areas may be higher. Soil quality indicators (SQI) are useful tools for assessing the status of soil fertility and its degradation. The objective of this study was to generate (univariate) quality indicators whose values, included within a single scale, allow to evaluate the soil fertility of the MAO and place them on a thematic map of degradation. The hypotheses were: 1) the attributes evaluated in this study function as SQI, and 2) the SQI values that vary within a single scale allow to compare the states that these attributes maintain. The value of the indicators will allow to propose corrective actions of the agronomic management of the soils and avoid their degradation. This proposal is easy to implement, of low cost, fast generation, can use information available in the literature and support regional public policies. The chemical and physicochemical attributes evaluated were: pH, organic matter (OM), extractable P (Pex), exchange bases (Ca, Mg and K), effective cation exchange capacity (ECEC); plus a biological one, the carbon in microbial biomass (CBM). With these attributes, quality indicators, soil quality and soil quality classes were defined in agricultural and degraded sites in five localities of the MAO: Tonaltepec, Gavillera, Cerro Prieto, Nduayaco and Pericón, where there was support from the community. Sampling was completely randomized. The sites from where the samples were obtained to generate the SQI were georeferenced and located on a thematic map of degradation types. The values of the indicators and the quality classes generated evidenced the precarious state of fertility of the MAO soils. Its use will allow to propose corrective measures to improve the current fertility of soils and avoid further degradation.
Keywords: soil quality indicators; degraded soils; soil fertility; Mixteca Alta Oaxaqueña
La Mixteca Alta Oaxaqueña, México (MAO), presenta niveles moderados a graves de degradación de suelo. La erosión hídrica y eólica son las principales causas de esa degradación, con pérdidas de suelo entre 50 y 200 Mg ha-1 año-1 y en algunas zonas puede ser mayor. Los indicadores de calidad (ICS) son herramientas útiles para evaluar el estado de la fertilidad del suelo y su degradación. El objetivo de este estudio fue generar indicadores de calidad (univariados) cuyos valores, comprendidos dentro de una escala única, permitan evaluar la fertilidad de suelos de la MAO y situarlos en un mapa temático de degradación. Las hipótesis fueron: 1) los atributos evaluados en este estudio funcionan como ICS y 2) los valores de los ICS que varían dentro de una escala única permiten comparar los estados de estos atributos. El valor de los indicadores permitirá proponer acciones correctivas del manejo agronómico de los suelos y evitar su degradación. Esta propuesta es de ejecución fácil, costo bajo, generación rápida, que usa información disponible en la literatura y puede apoyar políticas públicas regionales. Los atributos químicos y fisicoquímicos evaluados fueron: pH, materia orgánica (MO), P extraíble (Pex), bases de intercambio (Ca, Mg y K), capacidad de intercambio catiónico efectiva (CICE); además, uno biológico, el carbono en biomasa microbiana (CBM). Con estos atributos se definieron los indicadores de calidad, los valores de éstos y las clases de calidad de suelo en sitios agrícolas y degradados de cinco localidades de la MAO: Tonaltepec, Gavillera, Cerro Prieto, Nduayaco y Pericón, donde hubo apoyo de la comunidad. El muestreo fue completamente aleatorio. Los sitios de donde se obtuvieron las muestras para generar los ICS se georeferenciaron y ubicaron en un mapa temático de tipos de degradación. Los valores de los indicadores y las clases de calidad generados evidenciaron el precario estado de fertilidad de los suelos de la MAO. Su uso permitirá proponer medidas correctivas para mejorar la fertilidad actual de los suelos y evitar una mayor degradación.
Palabras clave: indicadores de calidad de suelo; suelos degradados; fertilidad suelos; Mixteca Alta Oaxaqueña
Introduction
The Mixteca Alta Oaxaqueña (MAO) is one of the regions of Mexico with a high level of marginalization, whose population lives in precarious conditions (Ramales et al., 2014). The studies carried out cover topics such as deforestation, overgrazing, soil erosion, climate variability, poverty and migration. The Centro de Desarrollo Integral Campesino de la Mixteca (Center for Integral Rural Development of La Mixteca (CEDICAM) coordinates, among others, community work initiatives in the region that focused on combating desertification and improving the quality of the environment, especially in the availability of water and development of an agriculture friendly to the conditions of the region. However, studies to evaluate the fertility and degradation status of soils at the specific site level are scarce. The scarcity of studies is serious because soil and water are the fundamental basis for food production (Ortiz et al., 1994; Torres et al., 2003). The MAO soils show severe erosion and a marked heterogeneity in their physicochemical characteristics. They are nutrient-poor soils, especially nitrogen and phosphorus. They have a high content of calcium and carbonates, alkaline pH, organic matter deficiency and textures from heavy to medium (SARH, 1984; Bravo et al., 1993; Plan Municipal de Desarrollo. San Juan Yucuita, Nochixtlán, Oaxaca, 2010) and these conditions limit agricultural production (Alfaro, 2004).
According to Bravo et al. (1993), the increase in soil fertility creates benefits over the long term. However, there is still no improvement in this situation.
Bradomín (1992) reported that 70 % of the MAO soils presented some type of degradation. Deforestation, agricultural expansion and transhumant overgrazing of sheep and goats are the main causes of soil deterioration (SEMARNAT-CP, 2002). The complex topography of the region and the predominance of shallow soils complicate the comprehensive implementation of policies to conserve the soil resource.
The state of soils degradation prevents them from providing goods and services in the expected way, including food production and conservation of other natural resources such as water, flora and fauna. A criterion that helps to determine the degree of degradation of the soil is the evaluation of its quality (Doran and Parkin, 1996; Karlen et al., 1997). The Soil Science Society of America’s Soil Health Committee defines soil quality as its ability to function within the boundaries of a natural or managed ecosystem, which implies: 1) sustaining the productivity of plants and animals, 2) maintaining or improving air and water quality, (3) maintaining human health and habitat (Karlen et al., 1997; Acevedo et al., 2005), 4) sustaining biological activity, biodiversity and productivity, (5) filtering, buffering, degrading and immobilizing contaminants, 6) storing and recycling nutrients and, 7) supporting socio-economic structures associated with the human habitat (Doran and Parkin, 1996; Karlen et al., 1997; Bautista and Etchevers, 2014).
The concept of quality is functional; includes variables which serve to evaluate the condition of the soil, or soil quality indicators. The SQI are measurement tools that provide information about the properties, processes and characteristics of the soil (Bremer and Ellert, 2004). These SQI are measurable attributes that reveal the response of the productivity or functionality of the soil to the environment, and indicate whether the quality of the soil improves, remains constant or decreases over time (Ghaemi et al., 2014). They give information on the effect of change in the use of the soil and the impact of agricultural practices on its degradation or functioning (Astier et al., 2002).
No SQI is appropriate for all the purposes and contexts (Cantú et al., 2007). The SQI can be the physical, chemical and biological properties of the soil or processes occurring in it (Larson and Pierce, 1991; Doran and Parkin, 1994; NRCS, 1996; Seybold et al., 1997). Most researchers use predefined SQI as suggested by Gómez et al. (1996), Shukla et al. (2004), Singh and Khera (2009), to name just a few authors. Others combine a large amount of SQI into indices and generate a total data set (TDS) (Doran and Parkin, 1994; Karlen et al., 1998). One option is to use few indicators, but they must be representative, so the use of a minimum data set (MDS) was proposed (Govaerts et al., 2006).
The MDS contains a selection of parameters representing the TDS, which enables to save time and money (Govaerts et al., 2006; Qi et al., 2009). To identify the most sensitive SQI or those having the greatest impact on the soil quality the Principal Component Analysis (PCA) is used. To this end, physical, chemical and biological properties of the soil are evaluated, which vary in number according to the authors: Bautista et al., 2011 in Mexico (11), Qi et al., (2009) (22), Bi et al. (2013) (19) and Liu et al. (2013) (26). In Mexico the economic resources for research and development projects are scarce; the MDS approach is considered to be the most appropriate because it allows to select the parameters that better represent the quality of the soil.
The most commonly used chemical indicators to generate SQI are: soil buffer capacity, availability of nutrients for plants and microorganisms, pH, electrical conductivity, total and labile organic carbon, organic matter, cation exchange capacity, total and mineralized nitrogen, phosphate adsorption capacity and availability of micronutrients (Larson and Pierce, 1991; Doran and Parkin, 1994; NRCS, 1996; Bautista et al. 2004; Bautista et al., 2011; Bautista and Etchevers, 2014).
Since no property is permanent, to evaluate soil quality spatial and temporal dimensions must be considered (Doran and Parkin, 1996; Karlen et al.,1997; Bautista and Etchevers, 2014). In the spatial dimension, the study areas can be a plot or a region (Bautista and Etchevers, 2014), and the temporal dimension refers to a time interval in which the indicator changes. Therefore, the methodology of indicators should be based on a cartographic base so that the analysis in space and time be feasible (Cantú et al., 2007). The indicators are not universal and represent a vision of the moment (Doran and Safley, 1997), so it is necessary to validate them over time to record their changes (Cantú et al., 2007). Soil quality assessment allows the constant monitoring of an area, to identify changes in its characteristics and propose appropriate management practices (Doran and Parkin, 1994). The objective of this study was to generate indicators of quality (univariate) whose values, within a single scale, allow the evaluation of the fertility of the MAO soils and place them on a thematic map of degradation. The hypotheses were: 1) the attributes evaluated in this study function as SQI, and 2) the SQI values that vary within a single scale allow to compare the states that these attributes.
Materials and Methods
Study area
The research was conducted in an area (32, 919 ha) located in the northeast of MAO (17° 30’ and 17° 42’ N and 97° 00’ and 97° 25’ W) (Figure 1) forming part of the physiographic province of the Sierra Madre del Sur (Southern Sierra Madre) and the physiographic subprovinces Sierras Centrales of Oaxaca and Mixteca Alta. Its climate is temperate sub-humid and the sierra is the predominant topoform. The geology of the area is highly varied, though limestones (36 %) prevail, as well as basic extrusive igneous rocks (18 %) and limestone-shale association (8 %), in addition to other minor rocks on the surface such as sandstones (Rivas, 2008)2.

Representative soils in the area are Leptosols, Pheozem and Regosoles (INEGI, 2007; IUSS Working Group WRB, 2014).
Leptosols are thin, stony and poorly developed soils, which may contain a large amount of calcareous material. They are associated with sites of complex orography, are common in mountainous areas and in heavily eroded regions, while their agricultural potential is limited because of their shallow depth and abundant stoniness. The Pheozem are dark and rich in organic matter, they present limitations for agricultural activity as they are susceptible to wind and water erosion and periodic droughts. Regosols are formed on unconsolidated materials and are located within the most fertile soils; their main use is agricultural2.
The vegetation of the area, according to the (INEGI, 2007), is mostly induced pasture (25.9 %), wooded areas of oak, pine and pine-oak association (32 %).
The predominant crops are traditional subsistence ones: maize associated with beans or as monocultures; on a smaller scale, wheat, canary seed and barley are planted; maize in cajete (structure built to preserve water from summer rains) and winter wheat grown on residual moisture, irrigated maize and wheat; also, triticale, oats, alfalfa and sorghum. Both milpa intercropped with fruit trees (MIAF) and pastures help to retain the soil and prevent its loss (Plan Municipal de Desarrollo (Municipal Development Plan), San Juan Yucuita, Nochixtlán, Oaxaca, 2010).
Soil sampling
Fifty seven sampling sites were selected (42 agricultural, 12 degraded and 3 forest sites) distributed in five communities of five municipalities of the zone: Tonaltepec (Santo Domingo Tonaltepec), Gavillera, (San Bartolo Soyaltepec), Cerro Prieto (San Miguel Chicahua), Nduayaco (Santiago Apoala) and Pericón (Santa María Apazco). The sites sampled were: 1) ten agricultural sites, four degraded in Tonaltepec; 2) ten agricultural sites, one degraded in Gavillera; 3) seven agricultural sites, three degraded and a forest in Pericón; 4) nine agricultural sites, two degraded in Nduayaco; 5) six agricultural sites, two degraded in Cerro Prieto. In addition, soil in three forest sites were also collected. The communities of each municipality were chosen based on three criteria: 1) belonging to the same basin (Papaloapan), 2) being of high and very high marginalization according to the National Council of Population 2010, and 3) having producers willing to cooperate. The selection did not follow a statistical model, but was rather decided by the researcher experience and the distribution of localities was decided to be directed according to the three criteria above indicated.
In each site we obtained a composite soil sample from a mix of six subsamples collected from the 0 to 30 cm depth, with a fertility sampling auger. The sample was reduced to approximately 2 kg by quartering. The soil was dried in the shade and at room temperature, then ground and sifted through a 2 mm mesh, to perform the chemical analyses in the laboratory. The sites from where we obtained the samples were georeferenced and the coordinates located on a thematic map of degradation. The forest soils were collected and analyzed to have a reference of the current conditions of them.
Chemical analysis
In the soil samples we determined: pH by potentiometry (soil-water ratio 1:2), organic matter (OM) by wet combustion with the Walkey and Black method (Jackson, 1976) and extractable P Olsen (Ptext) (CSTPA, 1980). The extraction of exchangeable K and Na was carried out with 1N pH7 ammonium acetate and 1N pH 8.2 sodium acetate for Ca and Mg to avoid the solubilization of free Ca carbonates, present in the soils of the area (Cano et al., 1984, Castellanos et al., 2000). Exchangeable bases were determined by atomic absorption spectroscopy. The effective cation exchange capacity (ECEC) was estimated by adding the exchangeable bases (Cottenie, 1980). The carbono (C) in the microbial biomass (CBM) was determined by fumigation and extraction with chloroform (Joergensen and Brookes, 1990). From here on these soil characteristics will be called attributes in order to maintain a terminology consistent with the soil quality articles in which this term is preferred. For each condition of the soil and attribute measured, we obtained the mean value of the repetitions. The mean comparison was made with the Tukey test (p≤0.05).
Indicators of soil quality
Soil fertility integrates physical, chemical and biological soil attributes (Pieri, 1989). In this study, only chemical, physicochemical and biological attributes were used to define indicators and quality classes. The selected attributes were: pH in water (1:2), OM, Pext Olsen, K, Ca and Mg exchangeable (Kint, Mgint, Caint), ECEC and C in the microbial biomass. We selected these variables because they are frequently used to define soil fertility. To define the SQI and the associated values, we used the methodology proposed by Cantú et al. (2007), for which it is necessary to define the maximum (Imax) and minimum (Imin) limits of the selected attributes. As there is no single way to establish these limits, agricultural and degraded soils were defined with the following criteria: theoretical concepts, type of soil, ideal soil conditions for potential crops in the study area, availability of nutrients, presence of carbonates, maximum yields according to current soil conditions, climatic conditions and the experience of researchers who have studied the area (Table 1).
Table 1 Attributes used as quality indicators of agricultural and degraded soils of the Mixteca Alta Oaxaqueña and limit values

††Imin: minimum value of the attribute; ¶Imax: maximum value of the attribute; §Pext: extractable phosphorus; ΦCaint: exchangeable calcium; ¤Mgint: exchangeable magnesium; ††Kint: exchangeable potassium; ¶¶ECEC: effective cation exchange capacity; §§CBM: carbon from microbial biomass.
The values of the indicators were normalized using a 0 to 1 scale. For the SQI these two values represent the worst and best condition from the point of view of quality, respectively (Cantú et al., 2007). In agricultural and degraded soils, the maximum value of the Imax indicator (normalized value Vn = 1) represents the ideal value which is expected to be reached or the best soil quality situation (Cantú et al., 2007). The minimum value of the same Imin (normalized value Vn = 0) represents the minimum desirable or the minimum acceptable quality. For forest soils, quality indicators were not calculated because they were only used as reference for undisturbed soils.
The calculation of the normalized value of the indicators was made in the following way:
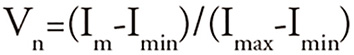
where Vn: normalized value of the indicator; Im: experimental measurement of the attribute considered as an indicator; Imin: minimum value of the attribute considered as an indicator; Imax: maximum value of the attribute considered as an indicator.
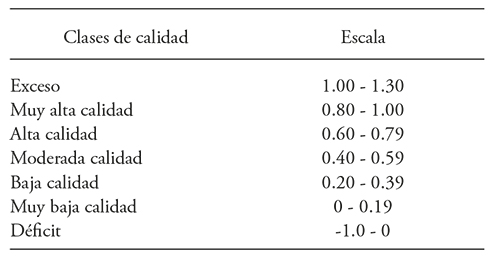
For the interpretation of the quality indicators generated for the soils of the five MAO municipalities, a modification of the scale recommended by Cantú et al. (2007) is proposed, which has only five quality classes. Our proposal considers seven quality classes for each indicator (Table 2), a class higher than one and another lower than zero, due to the wide range of values presented by the indicators generated for the MAO.
Thematic map
One of the main functions of the indicators is to evaluate conditions or trends over time (Cantú et al., 2007), for which the sites were georeferenced in a thematic map with the types of degradation for follow up changes in space and time. This meets one of the conditions required for soil quality indicators (Cantú et al., 2007). The use of a degradation map was due to the fact that this process has an intimate connection with the loss of soil capacity for production and other services. To generate this map, we used the vector information available in the layer Evaluation of Soil Degradation Caused by Man in the Mexican Republic (SEMARNAT-CP, 2002), scale 1:250 000, and the complementary document called Report on the Situation of the Environment in Mexico (SEMARNAT, 2012). From a layer of municipal demarcations scale 1: 250 000 generated by the CONABIO (2012), the municipalities corresponding to the study area were mined. Based on this new map and using the command Extract of ArcGis, version 10.1 (ESRI, 2013), we extracted the polygons from the types of soil degradation that occur in the study area. To this composition a vector layer was superimposed with the points corresponding to the coordinates of the sampling sites. The thematic map of degradation generated indicates the type and main causes of degradation of the areas where the soils selected for the study are located. To verify whether the information generated by this map corresponded with that of the study sites, we checked it with photographs and observations in the field.
Results and Discussion
Chemical analysis of soils
To interpret the chemical attributes evaluated, we used the information proposed by Castellanos et al. (2000). The agricultural MAO soils are from neutral to alkaline (pH 6.8 to 8.2). In the degraded soils of Tonaltepec, Pericón and Gavillera the pH was located in the neutral to slightly acidic range (pH 7.2 to 6.4) (Table 3). In the agricultural soils of this zone the OM varied from moderately low to medium (1.7 to 2.3 %) and in those degraded from moderately low to low (<1.4 %). In contrast, in Tonaltepec the OM was very low (< 0.7 % OM) but reached concentrations >4 % in the agricultural soils of Pericón, which is due to the contribution of organic matter to the soil (added residues and compost). The concentration of Pext in the degraded soils was low (< 10 ppm Pext Olsen), but the agricultural soils of Pericón, Nduayaco and Cerro Prieto showed higher presence of Pext Olsen (10.4 to 20.6 ppm) (Table 3). The contents of Caint were high (> 10 cmol kg-1) in both agricultural and degraded soils. The soils of the municipality of Cerro Prieto were the exception as the content of this cation was low (< 5 cmol kg-1) in them.
Table 3 Attributes evaluated in the soils of the Mixteca Alta Oaxaqueña

¶¶¶¶ Means with different letter are statistically significant (p≤0.05); DMS: minimum significant difference.
†OM: organic matter; ¶Pext: extractable phosphorus; §Caint: exchangeable calcium; ΦMgint: exchangeable magnesium; ¤Kint: interchangeable potassium; ††ECEC: effective cation exchange capacity; ¶¶CBM: carbon of the microbial biomass.
The concentrations of the other exchange bases were medium and low Mgint (1 to 5 cmol kg-1) and Kint (< 0.6 cmol kg-1) (Table 3). The exception was the degraded soil of Pericón with 16.6 cmol kg-1 of Mgint, possibly related to the mineralogy of soils (Bautista et al., 2011).
The ECEC values were defined mainly by the exchangeable Ca and Mg contents, which were high (25 to 41 cmol kg-1) in Tonaltepec and Pericón, medium (13 to 25 cmol kg-1) in Nduayaco and Gavillera, and low (4 to 8 cmol kg-1) in Cerro Prieto (for agricultural and degraded soils). The significant decrease of CBM in the degraded soils of Pericón, Nduayaco and Cerro Prieto (14.9 to 141.6 mg kg-1) indicates that the OM used by microorganisms as a C source has been lost in these soils (cf. Xu et al., 2013), which is the result of the erosion present in the area. The increase of organic C in the soil was accompanied by an increase in CBM, as observed in soils of different ecosystems and agricultural crops (Xu et al., 2013). But there were not enough experimental data to establish a correlation.
The soils of the forests presented pH values from moderately acid to neutral (5.7 to 6.8), very high OM contents (4.4 to 18.5 %) and CBM (312 to 1980 mg kg-1) but low Pext levels (2.2 at 3.7 ppm), as expected in forest soils. The exchangeable bases (Ca, Mg and K) and the ECEC were notably lower than in the agricultural and degraded sites, which is associated to an exchange complex composed of mostly organic matter, where the exchangeable bases must be low. The high content of Caint (42.8 cmol kg-1) and therefore a high ECEC (49.5 cmol kg-1) in the soil of Pericón forest denotes the presence of calcareous material more than a high cation exchange capacity.
Indicators of soil quality
The values of the indicator pH were close to 1 in most agricultural and degraded soils; this value is considered as optimum (pH ≈ Imax) for the development of potential crops in the area (Cantú et al., 2007). This chemical attribute does not seem to present a problem in the current state of soil fertility. Only the agricultural sites of Tonaltepec and Pericón, with indicators of pH quality greater than 1 (i.e. 1.28 and 1.16, respectively), require corrective management actions to lower the soil pH and avoid problems of availability of Fe, Zn, Mn and Cu (Figure 1A). These values are attributed to the presence of high levels of exchangeable Ca, coming from the calcareous material in that area. The quality indicator pH was also used by Bi et al. (2013) in their study of soil types.
The OM and Pext indicators were negative in the degraded soils of the five communities (Figures 1B and 1C). According to Cantú et al. (2007) values lower than Imin (less than zero) indicate the worst quality situation and report very low values for the soil organic carbon (SOC) indicator (0.18) in agricultural soils of Argentina. In addition, Gómez et al. (1996), Campos et al. (2007), Reynolds et al. (2009) and Bi et al. (2013) used the SOC indicator. Gregorich et al. 1997; Lal et al., 1999; Govaerts et al., 2006 and Ghaemi et al., 2014 also considered it a key indicator for soil quality. The negative values of these indicators indicate that OM and Pext Olsen levels are lower than the minimum required for the development of crops in the area, so they must be corrected. This could be partially achieved through the addition of composted manures available in the area and crop residues.
The low concentrations of Pext can be due to the fact that it is not usual to fertilize with phosphorus and to the restrictions regarding the high presence of calcareous material present in these soils. Therefore, to improve the use of phosphorus, the use of phosphate fertilizers with a low Ca/P ratio is recommended.
The value of the CBM indicator was positive but low since it varied from 0.1 to 0.5 in agricultural soils (Figure 1D). These values are explained by the low concentration of OM in these soils, a condition that does not favor the development of microbial biomass. Campos et al. (2007), Bi et al. (2013)) and Liu et al. (2013) have also used CBM as an indicator of soil quality. An exception was the agricultural land of Pericón, where the indicators of OM, Pext and CBM were 0.5, 1.0 and 1.0. The values of 1 are considered high and are the result of the addition of compost to the soil for fertilization, as we found during field visits. The Caint indicators (0.90 and 0.94) (Figure 1E) and ECEC (1.06 and 0.96) (Figure 1F) of the agricultural soils of Tonaltepec and Pericón are considered as ideal conditions to maintain an adequate soil fertility. However, the potential availability of this Ca is limited by the formation of calcium carbonates, judging by the pH values in these soils (8.2 and 7.9, respectively) (Castellanos et al., 2000). The majority of the soils in Tonaltepec correspond to Leptosols that are characterized by the presence of calcareous material. In Nduayaco and Gavillera, the value of the Caint indicator (0.5) is 50 % lower than the ideal value defined for the agricultural soils of the area, and the ECEC indicator is between 70 and 60 % lower than the ideal value. The values of the Caint and ECEC indicators were lower in the degraded soils than in the agricultural ones in both locations, which is a clear indication of a lower amount of Ca in the degraded soils. The negative values of the Caint and ECEC indicators in the agricultural and degraded soils of Cerro Prieto show that these soils require special attention to improve their quality and fertility. In this site the degraded soils also presented deficit conditions in terms of the exchangeable Mg and K contents (Figures 1G and 1H, respectively) as indicated by the negative values of the indicators of these variables. The most extreme case was the Kint indicator with values lower than 0.1 in agricultural soils, which is why it is 90% lower than the ideal value (Vn=1). This condition is worrisome because K as well as P are essential elements for crops. This defines the need to correct soil management and apply fertilizers with potassium.
The indicators that best defined the low fertility of the agricultural and degraded soils of the MAO were OM, Pext, exchangeable Mg and K. Of these indicators, Liu et al. (2013) used Kint, and Bi et al. (2013) used Pdis; in addition, Bautista et al. (2011) reported that the Mg int indicator was the best one to evaluate the quality of semiarid soils of Oaxaca, but they point out that the inclusion of this chemical attribute should be taken care of because its variations may be affected by the mineralogy of the soil. Other indicators selected by Bautista et al. (2011) are SOC, pH, CBM, Mgint, Caint, Kint, which explained most of the variability of the properties of semiarid soils. According to Bautista et al. (2011), the SOC is a very sensitive SQI and is highly associated with farming systems. Campos et al. (2007) also selected the Mgint and ECEC to monitor the quality of the soil in a transect of Cofre de Perote, Mexico.
Quality and degradation indicators
The degradation of the soils was confirmed in the field by the presence of gullies, channels or mass movement due to the removal of the soil (Figure 2). In Cerro Prieto and Nduayaco, the main cause of degradation has been associated with agricultural activity (Figure 2A and Figure 2B). In Pericón, the burning and removal of crop residues could decrease nutrients and organic matter (Figure 2C). On the other hand, in Tonaltepec (Figure 2D) degradation is considered to be the product of overgrazing and deforestation, since this municipality demands important quantities of firewood for the elaboration of mud crafts. Sixty two percent of the SQI of agricultural and degraded soils present low quality, very low, excess and deficit classes. This indicates that a considerable percentage of these soils do not have the fertility conditions required for the adequate development of potential MAO crops.

Figure 2 Sampling sites of the Mixteca Alta Oaxaqueña. (2A): Cerro Prieto, San Miguel Chicahua; (2B): Nduayaco, Santiago Apoala; (2C): Pericón, Santa María Apazco; (2D): Tonaltepec, Santo Domingo Tonaltepec.
The location in the thematic map of degradation (Figure 3) of the quality classes associated with the values obtained for the MAO soil quality index allowed to define a relationship between the current state of soil degradation, the SQI values and the quality classes associated with them. The SQI values of the agricultural soils indicated deficient quality classes (SQI < 0), moderate, low and very low (SQI < 0.5), as well as very high (Vn=1) in the sites of Gavillera, Nduayaco and Tonaltepec. The sites of Gavillera were located on the map of degradation in areas with water erosion and land deformation, caused by overgrazing, agricultural activity and overexploitation of vegetation for domestic use (Figure 3). The Nduayaco and Tonaltepec sites were located in areas of water erosion with loss of surface soil; and degradation is attributed mainly to deforestation with removal of vegetation for domestic use, overgrazing and agricultural activity (Figure 3).

Figure 3 Location of sites and soil quality classes of the Mixteca Alta Oaxaqueña in the thematic degradation map.
Information on the Pericón and Cerro Prieto sites is discussed separately. In Pericón, agricultural and degraded soils are located in areas that present degradation due to the decline of fertility and reduction of OM content, as a result of deforestation with vegetation removal and agricultural activity (Figure 3).
However, the values of the Pext and CBM indicators for the agricultural soil of this locality presented high values (SQI ~ 1), which defines a very high-quality class. This confirms that the management of agricultural soil comprising the addition of organic material is adequate. In Cerro Prieto, the SQI of agricultural and degraded soils are located in stable areas under normal conditions (Figure 3). However, in both conditions the values of the SQI were very low or negative, like the SQI of the degraded soils of Tonaltepec, Pericón, Nduayaco and Gavillera. This confers them very low quality and deficit classes, and therefore a great decline of fertility.
The previous results indicate that most of the evaluated sites coincided in the state of the soil degradation (thematic degradation map) and the values of SQI and quality classes. Only in Cerro Prieto and Pericón this coincidence was not clear. In both cases, the values of the SQI indicated different soil fertility conditions, which is deduced from the degradation map. The above is attributable to the scale of the documents used to generate the thematic degradation map (1: 250,000). Previous matches can be improved if larger scale maps are used.
However, the development of cartography at the regional level requires a considerable investment due to the large amount of field work that must be done. In addition, in the country there are considerable cartographic resources, which can be complemented with new information, as was the case with the current study. In this way, the use of current cartography can be expanded, which would allow to make recommendations at the regional level.
Conclusions
The indicators of OM, Pext, and exchangeable K and Mg defined more closely the current state of fertility of MAO soils and evidenced their degradation. The SQI values allowed to detect changes produced in the attributes used to generate these indicators. The location of quality classes on the degradation thematic map allowed to relate the change in the attributes evaluated with the use and management of the soils. This meets one of the most important criteria required for the use of quality indicators.
The monitoring of the values of the SQI within a single scale can help decision makers of the localities considered in this study (Rural Committees, etc.) to define corrective agronomic strategies at a specific site level to increase the fertility of soils. The values of the SQI obtained allow to generate a baseline or start of the quality of the MAO soils. This will serve to follow up or adjust the agricultural practices of the region in order to control the current degradation of the soil. The SQI and quality classes were generated with simple procedures and with available information, so this methodology can be used in localities with very limited economic and technical resources.
Literatura Citada
Acevedo, E., M. Carrasco, O. León, E. Martínez, P. Silva, G. Castillo, I. Ahumada, G. Borie, y S. Gonzáles. 2005. Criterios de Calidad de Suelo Agrícola. Ministerio de Agricultura. Gobierno de Chile. 205 p. [ Links ]
Alfaro, S. G. 2004. Suelos. In: García-Mendoza, A. J., M.J. Ordóñez, M. Briones-Salas (eds). Biodiversidad de Oaxaca. Instituto de Biología, UNAM-Fondo Oaxaqueño para la Conservación de la Naturaleza - World Wildlife Fundation, México. pp: 55-65. [ Links ]
Astier, M., M. Maass-Moreno, y J. Etchevers-Barra. 2002. Derivación de indicadores de calidad de suelos en el contexto de la agricultura sustentable. Agrociencia 36: 605-620. [ Links ]
Bautista, C. A., J. Etchevers B., R. del Castillo F., y C. Gutiérrez C. 2004. La calidad del suelo y sus indicadores. Ecosistemas 13 (2), mayo-agosto. Asociación Española de Ecología Terrestre, España. (Consulta: enero 2015). [ Links ]
Bautista-Cruz, A., F. De León-González, R. Carrillo-González, and C. Robles. 2011. Identification of soil quality indicators for maguey mezcalero (Agave angustifolia Haw.) plantations in Southern Mexico. Afr. J. Agric. Res. 6: 4795-4799. [ Links ]
Bautista-Cruz, A., y J. D. Etchevers B. 2014. Una Revisión sobre los Conceptos de la Calidad del Suelo: Sus Indicadores e Índices. Editorial Académica Española. ISBN 978-3-8473-6509-9. [ Links ]
Bi, C. J., Z. L. Chen, J. Wan, and D. Zhou. 2013. Quantitative assessment of soil health under different planting patterns and soil types. Pedosphere 23: 194-204. [ Links ]
Bradomín, J. M. 1992. Toponimia de Oaxaca (Crítica Etimológica). Tercera Edición. Oaxaca, Oaxaca. pp: 171-172. [ Links ]
Bravo, E. M., M. van Nieuwkoop, J. R. Contreras, J. L. Jiménez, y M. Morales Guerra. 1993. El potencial de la labranza de conservación en la Mixteca Oaxaqueña. INIFAP-CIMMYT-CEFAMOAX, Oaxaca, México. 50 p. [ Links ]
Bremer, E., and K. Ellert. 2004. Soil quality indicators: A review with implications for agricultural ecosystems in Alberta. Alberta Environmentally Sustainable Agriculture. Soil Quality Program. Alberta Agricultura, Food and Rural Development. Symbio AG Consulting. Lethbridge, Alberta. Canada. 32 p. [ Links ]
Campos, C. A., K. Oleschko L., J. Etchevers B., and C. Hidalgo, M. 2007. Exploring the effect of changes in land use on soil quality on the eastern slope of the Cofre de Perote Volcano (Mexico). For. Ecol. Manage. 248: 174-182. [ Links ]
Cano, O. M., C. Torres, M. Vargas de Calderón, H. Moreno, A. Cruzado, J. Huamaní, y I. Castilla. 1984. Manual Técnico No. 3. Análisis de suelos, tejido vegetal, aguas y fertilizantes. Dpto. de Suelos - EEA - La Molina - INIPA. Lima, Perú. pp: 47-53. [ Links ]
Cantú, M. P., A. Becker, J.C. Bedano, y H. F. Schiviano. 2007. Evaluación de la calidad de suelos mediante el uso de indicadores e índices en la Pampa Argentina. Ciencia Suelo. 25: 173-178. [ Links ]
Castellanos, J.Z., J. X. Uvalle B., A. Aguilar S. 2000. Manual de Interpretación de Análisis de Suelos. 2a. Edición. Colección INCAPA. Instituto de Capacitación para la Productividad Agrícola. San Miguel de Allende, Guanajuato, México. pp: 34-74. [ Links ]
CONABIO. 2012. Áreas Geoestadísticas Municipales 2012, escala: 1:250000. INEGI. Marco Geoestadístico 2013 versión 6.0c (Inventario Nacional de Viviendas 2012). Aguascalientes, Ags., México (, México (http://www.conabio.gob.mx ). (Consulta: enero 2012). [ Links ]
Cottenie, A. 1980. Soil and Plant Testing as a Basis of Fertilizer Recommendations. Soil Bulletin 38/2. FAO Roma. 119 p. [ Links ]
CSTPA. 1980. Handbook on Reference Methods for Soil Testing. (Revised Edition). Council Soil Testing and Plant Analysis. Athens, Georgia, USA. 247 p. [ Links ]
Doran, J. W., and T. B Parkin. 1994. Defining and assessing soil quality. In: Doran, J. W ., D.C. Coleman, D.F. Bezdicek, and B.A. Stewart (eds.). Defining Soil Quality for a Sustainable Environment. SSSA Special Publication Number 35. Soil Science Society of America. INC. Madison. Wisconsin. USA. pp: 3-21. [ Links ]
Doran, J. W., and T. B. Parkin. 1996. Quantitative indicators of soil quality: a minimum data set. In: Doran, J. W., and A. Jones J. (eds.). Methods for Assessing Soil Quality. SSSA Special Publication Number 49. Soil Science Society of America, INC. Madison. Wisconsin. USA. pp: 25-37. [ Links ]
Doran, J. W., and M. Safley. 1997. Defining and assessing soil health and sustainable productivity. In: Pankhurst, C., B. M. Doube, and V.S. Gupta (eds.). Biological Indicators of Soil Health. CAB International. Wallingford. pp: 1-28. [ Links ]
ESRI. 2013. Software ArcGIS 10.1. Redlands, CA. USA. [ Links ]
Ghaemi, M., A. R. Astaraei, H. Emami, M. Nassiri M., and S. H. Sanaeinejad. 2014. Determining soil indicators for soil sustainability assessment using principal component analysis of Astan Quds- east of Mashhad- Iran. J. Soil Sci. Plant Nut. 14: 987-1004. [ Links ]
Gomez, A. A., D. E. Kelly S., J. K. Syers, and K. J. Coughlan. 1996. Measuring sustainability of agricultural systems at farm level. In: Doran, J. W ., and A. Jones J. (eds.). Methods for Assessing Soil Quality . SSSA Special Publication Number 49. Soil Science Society of America, INC. Madison. Wisconsin. USA. pp: 401-410. [ Links ]
Govaerts, B., K. Sayre D., and J. Deckers. 2006. A minimum data set for soil quality assessment of wheat and maize cropping in the highlands of Mexico. Soil Till. Res. 87: 163-174. [ Links ]
Gregorich, E. G., M. Carter R., J. Doran W., C. Pankhurst E., and L. Dwyer M. 1997. Biological attributes of soil quality. In: Gregorich, E. G ., and M. Carter R. (eds.). Soil Quality for Crop Production and Ecosystem Health. New York. NY. pp: 81-114. [ Links ]
INEGI. 2007. Conjunto de Datos Vectorial Edafológico, Serie II, Escala 1:250000. (Continuo Nacional). México. http://www.inegi.org.mx/geo/contenidos/recnat/edafologia/vectorial_serieii.aspx . (Consulta: enero 2012). [ Links ]
IUSS Working Group WRB. 2014. World Reference Base for Soil Resources 2014. International soil classification system for naming soils and creating legends for soil maps. World Soil Resources Reports No. 106. FAO Roma. 191 p. [ Links ]
Jackson, M. L. 1976. Análisis Químico de Suelos. Omega, Barcelona. 662 p. [ Links ]
Joergensen, R. G., and P. Brookes C. 1990. Ninhydrin reactive measurements of microbial biomass in 0.5 M K2SO4 soil extracts. Soil Biol. Bioch. 22: 1023-1027. [ Links ]
Karlen, D. L., M. J. Mausbach, J. W. Doran, R. G. Cline, R. F. Harris, and G. E. Shuman. 1997. Soil quality: Concept, rationale, and research needs. Soil Sc. Soc. Am. J. 60 :4-10. [ Links ]
Karlen D. L., J. C. Gardner, and M. J. Rosek. 1998. A soil quality framework for evaluating the impact of CRP. J. Prod Agric. 11: 56-60. [ Links ]
Lal, R., D. Mokma, and B. Lowery. 1999. Relation between soil quality and erosion. In: Lal, R . (ed.). Soil Quality and Soil Erosion. Soil and Water Conservation Society. Ankeny. IO. pp: 237-258. [ Links ]
Larson, W. E., and F. J. Pierce. 1991. Conservation and enhancement of soil quality. In: Evaluation for Sustainable Land Management in the Developing World: proceedings of the International Workshop on Evaluation for Sustainable Land Management in the Developing World, Chiang Rai, Thailand, 15-21 September 1991. (Bangkok, Thailand: International Board for Soil Resources and Management (IBSRAM), 1991)., pp: 175-203. [ Links ]
Liu, Z., W. Zhou, J. Shen, S. Li, and C. Ai. 2013. Soil quality assessment of yellow clayey paddy soils with different productivity. Biol. Fert. Soils 50: 537-548. [ Links ]
NRCS-Natural Resources Conservation Service. 1996. Indicators for Soil Quality Evaluation. USDA. https://www.ncrcs.usda.gov/Internet/FSE_DOCUMENTS/nrcs142p2_053149.pdf . (Consulta: enero 2013). [ Links ]
Plan Municipal de Desarrollo. San Juan Yucuita, Nochixtlán, Oaxaca. 2010. www.elocal.gob.mx/work/templates/enciclo/oaxaca/municipios/20224a.htm-19k. (Consulta: noviembre 2016). [ Links ]
Pieri, C. 1989. Fertilité des Terres de Savanes. Ministére de la Coopération et CIRAD-IRAT. Paris, Francia. pp: 33-60. [ Links ]
Qi, Y., L. Jeremy D., B. Huang, Y. Zhao, W. Sun, and Z. Gu. 2009. Evaluating soil quality indices in an agricultural region of Jiangsu. Province, China. Geoderma 149: 325-334. [ Links ]
Ramales, O. M., M. Coronado A., y R. García J. 2014. Pobreza multidimensional y derechos humanos: situación actual en la Mixteca Oaxaqueña en el contexto de la política económica nacional. Contribuciones a las Ciencias Sociales, Septiembre 2014. http://www.eumed.net/rev/cccss/29/mixteca.html . (Consulta: noviembre 2016). [ Links ]
Reynolds, W.D., C. Drury F., C. Tan S., C. Fox A., and X. Yang M. 2009. Use of indicators and pore volume-function characteristics to quantify soil physical quality. Geoderma: 152: 252-263. [ Links ]
SARH. 1984. Guía para la asistencia técnica agrícola, Mixteca Oaxaqueña. Nochixtlan, Oaxaca, México. 138 p. [ Links ]
Singh, M.J., and K. Khera, L. 2009. Physical indicators of soil quality in relation to soil erodibility under different land uses. Arid Land Res. Manage. 23: 152-167. [ Links ]
Shukla, M. K., R. Lal, and M. Ebinger. 2004. Principal component analysis for predicting corn biomass and grain yields. Soil Sci. 169: 215-224. [ Links ]
SEMARNAT - Colegio de Postgraduados. 2002. Evaluación de la degradación del suelo causada por el hombre en la República Mexicana. Escala 1:250 000. Secretaría del Medio Ambiente y Recursos Naturales. México, D. F. México. [ Links ]
SEMARNAT, 2012. Informe de la Situación del Medio Ambiente en México. Compendio de estadísticas ambientales, SNIARN. Edición 2008. Gobierno Federal. http://app1.semarnat.gob.mx/dgeia/informe_12/index.html . (Consulta: enero 2012). [ Links ]
Seybold, C.A., M.J.Mausbach, D. L. Karlen, and H. H. Roger. 1997. Quantification of soil Quality. In: Lal, R ., J. M. Kimble, R. F. Follet, and B. A. Stewart (eds.). Soil Process and the Carbon Cycle. CRC Press, Boca Raton. Florida. USA. pp: 387-403. [ Links ]
Torres, B.E.,J.Cortés B., E. Mejía S., A. Exebio G., A. L. Santos H. y Ma. E. Delgadillo P. 2003. Evaluación de la degradación de los suelos en la cuenca “El Joselito”, Jesús María, Jalisco. TERRA Latinoam. 21:117-126. [ Links ]
Xu, X., P. E. Thornton, and W. M. Post. 2013. A global analysis of soil microbial biomass carbon, nitrogen and phosphorus in terrestrial ecosystems. Global Ecol. Biogeogr. 22: 737-749. [ Links ]
Received: August 2016; Accepted: May 2017
 Este es un artículo publicado en acceso abierto bajo una licencia Creative Commons
