


Serviços Personalizados
Journal
Artigo
 texto em
  Inglês (pdf)
 Artigo em XML
 Referências do artigo
 Enviar este artigo por email
Indicadores
-
 Citado por SciELO
 -
 Acessos
Links relacionados
-
 Similares em
SciELO
Similares em
SciELO
Compartilhar

 Permalink
Agrociencia
versão On-line ISSN 2521-9766versão impressa ISSN 1405-3195
Agrociencia vol.51 no.7 Texcoco Out./Nov. 2017
Food Science
Stability analysis of bread volume from rainfed mexican bread wheat (Triticum aestivum L.)
1Programa de Trigo y Avena, Campo Experimental Valle de México, Instituto Nacional de Investigaciones Forestales, Agrícolas y Pecuarias, 56230, Chapingo, Estado de México. (villasenor.hector@inifap.gob.mx).
Bread volume is the most important characteristic in bread quality of bread wheat (Triticum aestivum L.) and should be maintained in diverse environmental conditions, which should be taken into account in genetic breeding. The evaluation of quality in different environments is complicated, thus the objective of the present study was to determine the stability of bread volume of wheat varieties for drought conditions from a set of unbalanced data, and to determine if the MIXED procedure of SAS can be used as a tool in the selection of stable genotypes. With field experiments, under rainfall conditions and the handling of samples in the laboratory, a set of unbalanced data was obtained that was analyzed with statistical models in MIXED. In the goodness of fit tests the highest value of the information criterion of Akaike corresponded to the reduced model of the variance of stability, thus the stability of the varieties was estimated with this model. The varieties Juchi F200, Romoga F96, Náhuatl F2000 and Tlaxcala F2000 were the most stable. Furthermore, by combining the stability with the bread volume it was determined that the varieties Náhuatl F2000 and Juchi F2000 were the most desirable, given that in addition to their stability, they produced bread with volumes of 867.8 and 864.1 cm3. The estimation of the stability of genotypes using MIXED was useful when diverse environments were incorporated, as it was easy and fast. Another advantage was that when a numerical value of stability was assigned to each genotype, it was possible to categorize, compare and select.
Key words: rainfed wheat; bread wheat; bread volume; stability; mixed models
El volumen de pan es la característica más importante en la calidad panadera del trigo harinero (Triticum aestivum L.) y debe mantenerse en condiciones ambientales diversas, lo cual es necesario considerar en el mejoramiento genético. La evaluación de la calidad en ambientes diferentes es complicada, por ello el objetivo de este estudio fue determinar la estabilidad del volumen de pan de variedades de trigo para secano desde un conjunto de datos desbalanceados; y determinar si el procedimiento MIXED del SAS puede ser una herramienta en la selección de genotipos estables. Con experimentos de campo, en ambientes de secano y al manejo de muestras en laboratorio se obtuvo un conjunto de datos desbalanceados que se analizaron con modelos estadísticos en MIXED. En las pruebas de bondad de ajuste el valor mayor del criterio de información de Akaike correspondió al modelo reducido de la varianza de la estabilidad, por lo cual la estabilidad de las variedades se estimó con este modelo. Las variedades Juchi F2000, Romoga F96, Náhuatl F2000 y Tlaxcala F2000 fueron las más estables. Al combinar la estabilidad con el volumen de pan se determinó que las variedades Náhuatl F2000 y Juchi F2000 fueron las más deseables, pues además de su estabilidad, originaron pan con volúmenes de 867.8 y 864.1 cm3. La estimación de la estabilidad de genotipos mediante MIXED fue útil cuando se incorporaron ambientes diversos, ya que fue fácil y rápida. Otra ventaja fue que, al asignar un valor numérico de estabilidad a cada genotipo, se puedo categorizar, comparar y seleccionar.
Palabras clave: trigo de secano; trigo harinero; volumen de pan; estabilidad; modelos mixtos
Introduction
he bread wheat (Triticum aestivum L.) crops for drought conditions are an alternative for reducing the present deficit of Mexico, given that there are approximately one million non-irrigated hectares in which wheat cultivation seems to be an adequate option (Villaseñor y Espitia, 2000). However, wheat producers of rainfed conditions face problems for marketing their harvests, principally because the milling industry prefers to import wheat from international markets, with the argument that the Mexican varieties do not have an adequate quality for industry (Hortelano et al., 2013).
Knowledge of the genetic and environmental influence on the variation of industrial quality in bread wheat is fundamental for the production of high quality and stable harvests which favor its commercialization. The evaluation of quality in a high number of different environments is complicated, thus breeders have limited information of the variation of quality attributable to both genotype and environmental conditions (Espitia et al., 2003).
Genotype has an effect on the industrialization quality of wheat (Sánchez-García et al., 2015), but environmental conditions have a higher influence on quality (Vázquez et al., 2012; Mohan et al., 2014; Rozbicki et al., 2015). Espitia et al. (2003) indicated that in the wheat production conditions in Mexico and with local varieties bread volume is controlled by environmental effects in 74 %; although this will be determined by the variability among genotypes and among environments. The environmental conditions under which wheat is cultivated are the most important factor for the expression of its quality (Espitia et al., 2003).
The availability of N affects the protein content, which in turn affects bread volume. Temperature during grain fill (Li et al., 2013), the amount and distribution of rainfall (Aslani et al., 2013) and the presence of frosts (Martínez et al., 2015) are also environmental factors which significantly affect industrial quality (Mohan et al., 2014). The stability of quality, specifically bread volume, is a character of great importance for wheat breeding, but there are few studies (Hristov et al., 2010).
In the evaluation of genotypes in different environmental conditions there are frequently unbalanced sets of data due to diverse causes, such as lost data, variable number of replicates among environments, some genotype-environment combinations are not tested, and according to the type of experiments, there may or may not be replicates per environment. Therefore, the analysis of these experiments is complicated and demands robust computational resources. The methods for the analysis of stability depend on the availability of computational programs to manipulate unbalanced data. Many of the analyses of stability fit in the mixed model, where the environments are random effects and the genotypes are fixed. The parameters of the model can be estimated with the option of restricted maximum likelihood (REML), given that it permits the analysis of unbalanced data; besides, most of the measurements of stability can be estimated with the MIXED procedure of SAS (SAS Institute Inc., 2005).
There is a considerable amount of information about methodologies for the estimation of stability in an ample amount of random values (Lin et al., 1986; Becker and Leon, 1988; Denis et al., 1997; Piepho, 1998). The most utilized models are stability of variance (Shukla, 1972), regression models (Finlay and Wilkinson, 1963; Eberhart and Russell, 1966) and environmental variance (Lin et al., 1986).
The study of stability was limited by the availability of computational resources. But there are recent programs in statistical packages, such as SAS, for fast analysis of stability in unbalanced and balanced data.
The objective of the this study was to determine the stability of bread volume of wheat varieties for rainfed conditions from a set of unbalanced data, and to determine whether the MIXED procedure of SAS can be a tool in the selection of stable genotypes.
Materials and Methods
Genetic material and test environments
The wheat varieties Pavón F76, Gálvez M87, Temporalera M87, Batán F96, Romoga F96, Juchi F2000, Náhuatl F2000, Tlaxcala F2000 and Rebeca F2000 were evaluated. These varieties represent the genetic diversity of the germplasm used in the arid zones. The varieties were sown in the spring-summer cycles of 2010 and 2011, in 22 rainfed environments in the following locations: Juchitepec, Tecamac and Coatepec in Estado de Mexico; Nanacamilapa and Apizaco in the State of Tlaxcala; Santiago Tillo in the State of Oaxaca; Jesús in the State of Jalisco, Cuyuaco María in the State of Puebla; Roque in the State of Guanajuato; Bellavista in the State of Morelos; and Amealco in the State of Querétaro, Mexico. The 22 environments were completed with other sowing dates in Chapingo, Estado de Mexico, evaluations with and without application of fungicides in Coatepec, Chapingo, Juchitepec and Bellavista and four calendars of irrigation in Roque. The set of environments represents the environmental diversity of the Mexican regions of rainfed wheat cultivation. The genotypes were distributed in a design of complete randomized blocks with two replicates in all of the environments. The experimental plot consisted of four rows of 4 m length and 30 cm separation.
Cultivation in the experimental plots was made according to the recommendations of the National Institute of Forestry, Agriculture and Livestock Research (INIFAP) in each region. After harvest the grain was cleaned, conditioned, ground (wheat mill Quadrumat Senior, C.W. Brabender OHG, Germany) and the refined flour was obtained. This was sifted through a mesh with a pore of 129 µm diameter.
Laboratory analysis
For the laboratory analyses a sample of 800 g of grain from each plot was analyzed. Thus, the same experimental design was used in the field and in the laboratory. The protein content in grain and flour (%) was measured with the analyzer NIR infralyzer 300 (method 39-10; AACC, 1995). The bread volume (cm3) was evaluated with the direct mass method (method 10-09, AACC, 1995) considering the criteria of water absorption and kneading time, under controlled conditions of temperature and relative humidity. To 100 g of refined flour, 3 g of powdered milk were added, along with 3 g of vegetable fat, 25 mL of a yeast solution (12 %), 25 mL of a solution of sucrose-sodium chloride (20 and 4 %, respectively) and distilled water, which was calculated according to the absorption capacity (related to the protein content) and was corrected with grain hardness. The final absorption capacity was calculated with the equation Y=1.5 X+43.6, where X is the percentage of protein in the flour and Y is the percentage of water absorption. Grain hardness was measured with the perlate index in 20 g of grain (perlator type Strong Scot-USA), which indicates the facility of partially eliminating the external layers of the grain, with a standardized abrasion procedure, for 1 min. In this process, the residue was sifted through a mesh (1.25 µ), the weight of the perlated grain was weighed and classified. To the semi-soft grains, 1.2 mL of water was added and to the semi-hard and hard grains, 2.4 and 3.6 mL., respectively. The optimum kneading time was estimated based on those obtained in the Swanson mixograph (National Mfg., USA) in 10 g of refined flour with the method 54-40A (AACC, 1995). The doughs obtained were well developed, homogenous and cohesive. Fermentation time was 3 h 55 min; during this time two degasifications were performed (pressing the dough). This was carried out with the purpose of allowing the yeasts to consume the maximum amount of sugars and so that the gas bubbles remained small and uniformly distributed in the fermentation stage. The fermenter was maintained at 30 °C with a controlled relative humidity of 95 to 100 %. In the fermentation stage a cylinder was formed, which was placed in a mold and baked at 220 °C for 25 min. The breads were weighed and their volume was determined by displacement of rape seed (Brassica campestris L.) in a volumeter.
Models under study
The stability of the variation in the bread volume when changing the environmental conditions was expressed as a variance. The stable variety will be the one that presents the lowest value of this variance. The stability parameters that were used were of the models proposed by Shukla (1972) (variance of stability), Finlay and Wilkinson (1963), Eberhart and Russell (1966) (regression) and environmental variance, which are described in Piepho (1999). The model of the stability of variance (Shukla, 1972) for a design of complete randomized blocks is as follows: yijk = m +gi + rjk 1uj +(gu) ij + eijk, where yijk (i =1, ..., I; j =1, ..., J; k =1, ..., K) is the bread volume of the k th replicate of the ith genotype in the jth environment, rjk is the effect of the kth block in the jth environment, (gu)ij is the effect of the ijth interaction genotype-environment and eijk is the effect of a corresponding experimental error for yijk. It is assumed that the random effects uj, rjk, (gu)ij, and eijk are independently distributed with mean zero and variances σ2u, σ2r, σ2 gu(i) (stability of the variances) and σ2 e (Shukla, 1972).
The equation of the regression model of Finlay and Wilkinson (1963) is as follows: yijk = µ +gi +rjk + λi w j +dij +eijk, where λi is the sensitivity of the ith genotype to a latent environmental variable wj and d ij is a random deviation (the unexplained interaction). The variances of wj and d ij are σ2w and σ2 d. The regression model of Eberhart and Russell (1966) differs from the model of Finlay-Wilkinson (1963) in that the deviations have a separate variance for each genotype. These variances can be denoted by σ2d(i) and σ2f(i). The model of the environmental variance (Lin et al.., 1986) is yijk = µ +gi +rjk +hij +e ijk, where it is assumed that rjk and eijk have independent distribution with mean equal to zero and variances σ2r and σ2e. It is also assumed that the effects genotype-environment hij for the same environment j are correlated (Piepho, 1998). The structure variance-covariance of the vector hj = (h1j … h Ij)’ is completely unstructured; that is, the elements of the symmetrical matrix variance-covariance var(hj) = Ω can take any value, while the value of Ω is positive and finite. The elements of the diagonal Ω are variances corresponding to the I genotypes, which should be interpreted as measures of stability (Piepho, 1999). Placing stability in terms of variances permits the comparison among different models.
Analysis of the data
The parameters of stability that were used were those of the models proposed by Shukla (1972) (variance of stability), Finlay and Wilkinson (1963), Eberhart and Russell (1966) (regression) and environmental variance, which were described by Piepho (1999). The statistical analyses were made with the procedure MIXED of SAS, with averages genotype-environment, the environments as random factor and the varieties as fixed factor. The tests of goodness of fit of the data to the tested models were made through the statistical proportion of the value of the parameter of the restricted maximum likelihood (LLR) of the general model (environmental variance) with the respective value of the reduced models. The fitting of the models was made according to the information criterion of Akaike (AIC) to select the most adequate (Wolfinger, 1996), which is calculated through the following equality: AIC = LLR - p, where p is the number of parameters in the structure variance-covariance in each model; the higher the value of AIC, the more adequate the model in question will be. The analysis of the environments of the study was made through the transposition of the matrix genotype-environment and the bread volume was graphed with the environmental variance. The fitted average values were compared with the model selected with Tukey test (α=0.05).
Results and Discussion
Bread volume of the varieties and environments in all of the models tested showed significant differences (p ≤0.01), according to the goodness of fit tests of the tested models (Table 1). The highest value of the criterion of information of Akaike corresponded to the model of the variance of stability of Shukla (1972); thus according to Wolfinger (1996), the stability of the varieties should be determined with this model. Under the hypothesis that the reduced model is different from the complete model, the simplification of these models in relation to the complete model of the environmental variance is supported by the data of the present study. Following this criterion the model of the variance of stability is favored; therefore, it should be used to determine the stability of the varieties of the study.
Table 1 Goodness of fit test for bread volume of nine varieties of bread wheat in 22 rainfed environments in Mexico
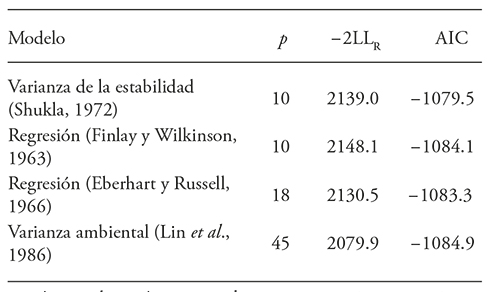
p: number of parameters in the variance-covariance structure, AIC: information criterion of Akaike, LLR: parameter of restricted maximum likelihood.
The relevant parameters for the evaluated models (Table 2) indicated that the variety Juchi F2000 was the most stable according to the model of variance of stability, corresponding the lowest value of σ2(i) , the lowest value of environmental variance (σ ii), the lowest absolute value of the regression coefficient (σi) according to the analyses of Finlay and Wilkinson (1963) and Eberhart and Russell (1966) and the lowest variance of the deviations) σ2 (ii)) according to the model of Eberhart y Russell (1966). Thus, all of the models indicated that Juchi F2000 was the most stable variety, followed by Gálvez M87 and Náhuatl F2000. Bread volume is closely related to the amount and quality of proteins. These varieties are characterized by their high protein content (127 to 139 g kg-1) (Espitia et al., 2003); besides they present alleles of glutenins of high molecular weight 17+18 and 5+10 in Glu-B1 and Glu-D1, related to good quality (Kaya and Akcura, 2014) and will be able to better cushion the environment effect (Espitia et al., 1999). Therefore, these are stable varieties for bread volume. The least stable varieties were Pavón F76, Temporalera M87 and Batán F96, as they showed the variances with highest values (Table 2), although they also showed the allele 5+10 in Glu-D1. This could be due to differences in alleles of glutenins with low molecular weight (Martinez-Cruz et al., 2010), or to the influence of other factors that will reduce quality, such as drought and diseases (Hortelano et al., 2013). The standard errors of the estimated parameters seem high in all of the varieties, which could indicate that 22 environments is an inadequate number to reliably estimate stability; this agrees with that reported by Piepho (1999).
Table 2 Estimated parameters (restricted maximum likelihood, REML) with standard errors (SE) for the variance-covariance structure of stability models for the bread volume of bread wheat

A variety should be stable and produce bread with high mean of bread volume, thus this variable is key in selection. The means of bread volume with standard errors (Table 3) estimated by the models showed that the estimated means and the standard errors are stable in all of the models. According to the model of the variance of stability, Náhuatl F2000, Juchi F2000 and Gálvez M87 showed the highest averages of bread volume, followed by Pavón F76, Tlaxcala F2000 and Temporalera M87. This is related to the high protein content (Espitia et al., 2003) and its quality (Table 4); as Náhuatl F2000, Juchi F2000 and Gálvez M87 present the allele 5+10 of glutenins of high molecular weight in Glu-D1, known to confer strength to the dough and higher bread volume (Espitia et al., 2008; Malik et al., 2013; Martínez et al., 2015).
Table 3 Estimated measurements of bread volume and standard errors for wheat varieties. Restricted maximum likelihood REML with standard errors for different models.

Table 4 Quality and content of protein of nine varieties of bread wheat in 22 rainfed environments in Mexico
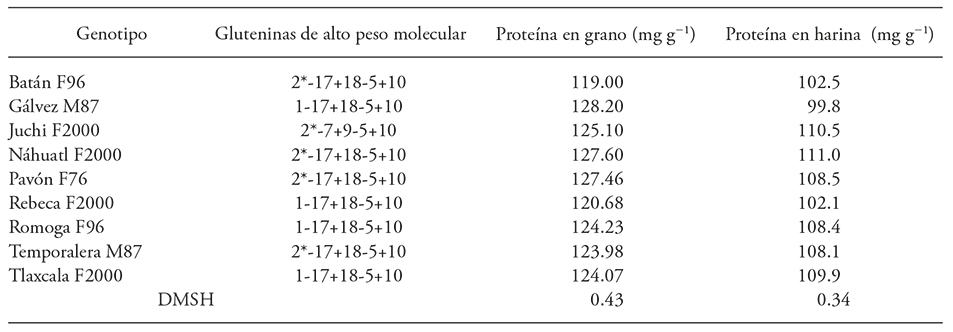
DMSH, honest minimum significant difference.
In addition to Juchi F2000, the varieties Náhuatl F2000 and Gálvez M87 showed good stability and high averages of bread volume; Tlaxcala F2000 presented high stability and intermediate bread volume. Furthermore, Rebeca F2000 and Temporalera M7 were identified with intermediate values of stability and bread volume. Rebeca F2000, Romoga F96 and Batán F96 presented low stability and bread volumes. The most adequate combination in a variety would be its stable bread-making quality, without response to the variations of the environment, and that would produce bread with high volume. According to the estimations of environmental variances and the average values estimated with the variance model of stability (Shukla, 1972), the varieties that best adhere to what was previously indicated are Náhuatl F2000, Juchi F2000 and Gálvez M87; followed by Pavón F76 and Tlaxcala F2000. This indicates that the varieties of the series 2000 have good bread-making quality; furthermore, three of them have stability and generate bread with volume comparable to Gálvez M87, which is considered in the industry as a reference variety of bread-making quality (Espitia et al., 2003).
The combination of stability and bread volume, through comparisons of the estimated average values by the model of the variance of stability (Table 5), showed that the varieties Náhuatl F2000, Juchi F2000 and Gálvez M87 are the most desirable for their higher stability and bread volume. The order of stability concurred in all of the varieties; that is, the higher the bread volume, the higher the stability. Thus, to cushion the effects of environment restrictive for bread volume, it would be convenient to use the genotypes of very good quality, which when cultivated in the restrictive environments maintain acceptable bread volume as indicated by Espitia et al. (2003).
Table 5 Desirability of genotypes combining stability and bread volume
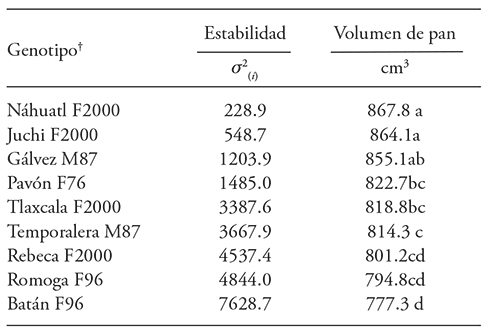
Average values with different letters are statistically different.
†The order of the genotypes indicates desirability.
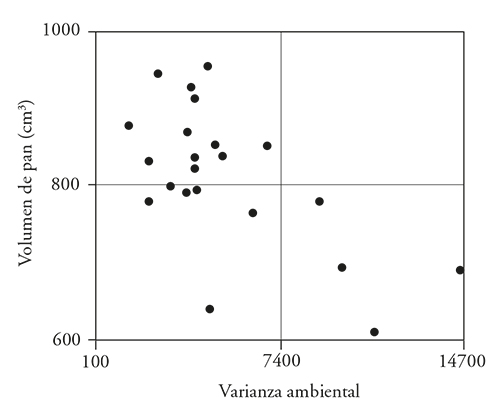
The test environments formed three groups (Figure 1). Most of them (12) in quadrant II, with higher stability and bread volume. Quadrant III contains six environments that generated higher stability and low bread volume. Quadrant IV contains four environments, which showed low stability and bread volume. None of the environments was located in quadrant I; this represents an area of low stability and high bread volume. For the evaluation of lines some of the locations in quadrant II could be dispensed with, since they represent good stability and high bread volume. This would reduce costs, as this condition would be represented with half of the environments.
With this program, stability is analyzed easily and rapidly, and allows the analysis with the averages genotype-environment (experiments without repli-cates per environment) and the computational resources are reduced. In addition, with the mixed models the analysis of unbalanced experiments is possible. This type is presented frequently for diverse reasons, such as lost data of plots, different number of replicates among experiments or lack of proof of some genotype-environment combinations. By placing the parameters of stability in terms of variances it is possible to compare between methods; furthermore, by assigning a numerical value of stability to each genotype, they can be compared, categorized and selected. In the breeding programs this methodology can be used to select lines by their stability, and by having a measurement of stability, the genotypes can be ordered from high to low.
Conclusions
The varieties Náhuatl F2000, Juchi F2000 and Gálvez M87 generate bread with higher and more stable volume when they are cultivated in most of the test environments; thus, they are the most desirable for bread-making.
The stability model of the stability variance shows the best fit to bread volume. The mixed models, because of their ease of handling, speed of analysis and lower demand of computational resources, are a tool of great usefulness in the determination of stability in diverse environments and in the selection of stable genotypes
Literatura Citada
AACC. 1995. Approved Methods of the AACC. 9th ed. American Association of Cereal Chemists. St. Paul, MN, USA. 1268 p. [ Links ]
Aslani F., M. Mehrvar R., A. Nazeri and A. Juraimi S. 2013. Investigation of wheat grain quality characteristics under water deficit condition during postanthesis stage. ARPN J. Agric. and Biol. Sci. 8: 273-178. [ Links ]
Becker H. C. and J. Leon. 1988. Stability analysis in plant breeding. Plant Breed 101: 1-23. [ Links ]
Denis J. B., H. P. Piepho, and F. Van Eeuwijk A. 1997. Modelling expectation and variance for genotype by environment data. Heredity 79: 162-171. [ Links ]
Eberhart S. A. and W. A. Rusell. 1966. Stability parameters for comparing varieties. Crop Sci. 6: 36-40. [ Links ]
Espitia R. E., C. Martínez E., R. J. Peña B., H. E. Villaseñor M., y J.Huerta E. 2008. Polimorfismo de gluteninas de alto peso molecular y su relación con trigos harineros para temporal. Agric. Téc. Méx. 34: 57-67. [ Links ]
Espitia R. E., P. Baenzinger S., R. Graybosch A., D. Shelton R., and B. Moreno-Sevilla. 1999. End-use quality performance and stability of 1A vs 1AL.1RS genotypes derived from the winter wheat Nekota. Crop Sci . 39:649-654. [ Links ]
Espitia R. E., R. J. Peña B., H. E. Villaseñor M., J. Huerta E. y A. Limón O. 2003. Calidad industrial de trigos harineros mexicanos para temporal. I. Comparación de variedades y causas de la variación. Rev. Fitotec. Mex. 26: 249-256. [ Links ]
Finlay K. W., and A. Wilkinson A. 1963. The analysis of adaptation in a plant-breeding programme. Aust. J. Agric. Res. 14: 742-754. [ Links ]
Hortelano S. R., H. E. Villaseñor M ., E. Martínez C., M. F. Rodríguez G., E. Espitia R., y L. A. Mariscal A. 2013. Estabilidad de variedades de trigo recomendadas para siembras de temporal en los Valles Altos de la Mesa Central. Rev. Mex. Cienc. Agríc. 4: 713-725. [ Links ]
Hristov N., N. Mladenov, V. Djuric, A. Kondic-Spika, A. Marjanovic-Jeromela, and D. Simic. 2010. Genotype by environment interactions in wheat quality breeding programs in southeast Europe. Euphytica. 174: 315-324. [ Links ]
Kaya Y., and M. Akcura. 2014. Effects of genotype and environment on grain yield and quality traits in bread wheat (T. aestivum L.). Food Sci. Technol, Campinas. 34: 386-393. [ Links ]
Li Y., Yu Wua, Nayelli Hernandez, and R. J. Peña. 2013. The influence of drought and heat stress on the expression of end-use quality parameters of common wheat. J. Cereal Sci. 57: 73-78. [ Links ]
Lin C. S., M.Binns R., and L. Levkovitch P. 1986. Stability analysis: where do we stand? Crop Sci. 26: 894-900. [ Links ]
Malik A. H., R. Kuktaite, and E. Johansson. 2013. Combined effect of genetic and environmental factors on the accumulation of proteins in the wheat grain and their relationship to bread-making quality. J. Cereal Sci . 57: 170-174. [ Links ]
Martínez Cruz E., H. E. Villaseñor Mir, R. Hortelano Santa Rosa, P. Pérez Herrera, y E. Espitia R. 2015. El efecto de las bajas temperaturas sobre la calidad industrial del trigo de temporal. Rev. Mex. Cienc. Agríc . 6: 793-802. [ Links ]
Martinez-Cruz E., E. Espitia R., H. E. Villaseñor, J. D. Molina-Galan, I. Benitez-Riquelme, A. Santacruz-Varela, and R. J. Peña-Bautista. 2010. Dough Rheology of recombinant lines in relation to allelic variants of Glu-1 and Glu-3 loci. Cereal Res. Comm. 39: 386-393. [ Links ]
Mohan D., A.Singh M., A. Ahlawat, and R. Gupta K. 2014. Analogy between agronomic and grain quality attributes of wheat for response to crop seasons, locations, site-year and genotype environment interactions. J. Wheat Res. 6: 126-131. [ Links ]
Piepho H., P. 1998. Methods for comparing the yield stability of cropping systems: a review. J. Agron. Crop Sci . 180: 193-213. [ Links ]
Piepho H., P. 1999. Stability analysis using the SAS System. Agron. J. 91: 160-165. [ Links ]
Rozbicki J. et al. 2015. Influence of the cultivar, environment and management on the grain yield and bread-making quality in winter wheat. J. Cereal Sci . 61: 126-132. [ Links ]
Sánchez-García M., F. Alvaro, A. Peremarti, J. A. Martín-Sanchez, and C. Royo. 2015. Changes in bread-making quality attributes of bread wheat varieties cultivated in Spain during the 20th century. Europ. J. Agron. 63: 79-88. [ Links ]
SAS Institute, Inc. 2005. The SAS system SAS online doc HTML format, version 9. SAS Inst. Cary, NC. [ Links ]
Shukla G., K. 1972. Some statistical aspects of partitioning genotype-environmental components of variability. Heredity 29: 237-245. [ Links ]
Vázquez D. et al. 2012. Influence of cultivar and environment on quality of Latin American wheats. J. Cereal Sci . 56: 196-203 [ Links ]
Villaseñor M., H. E., y E. Espitia. 2000. Características de las áreas productoras de trigo de temporal, problemática y condiciones de producción. In: Villaseñor M. H. E., y E. Espitia (eds). El trigo de temporal en México. Chapingo, México, SAGAR-INIFAP. (Libro Técnico No. 1). p: 85-98. [ Links ]
Wolfinger R., D. 1996. Heterogeneous variance-covariance structures for repeated measures. J. Agric. Biol. Environ. Stat. 1: 205-230. [ Links ]
Received: August 2016; Accepted: December 2016
 Este es un artículo publicado en acceso abierto bajo una licencia Creative Commons
