


 text in
  English (pdf)
 Article in xml format
 Article references
 Send this article by e-mail
 Cited by SciELO
  Similars in
SciELO
Similars in
SciELO 
 Permalink
Introduction
Grape (Vitis vinifera L.) is a major fruit crop in the world with many cultivars varying in characteristics, such as flavor and colour, with or without seeds, which are associated to the content of phenolic compounds and consequently with antioxidant capacity. Grapes are one of the major sources of phenolic compounds, as compared with other fruits and vegetables (Mulero et al., 2015). Phenolic compounds are an integral part of the human diet and are considered to be non-nutrients with biologically active compounds (Subramani et al., 2002; Mulero et al., 2015) and they constitute one of the most numerous and widely distributed groups of natural products in the plant kingdom. They play a very important role in the composition of grapes and wines, contributing to principal sensory properties, such as colour, astringency and bitterness (Puértolas et al., 2010). These compounds were identified and quantified in several fruits and vegetables, and show a high correlation with antioxidant activity (Soares, 2002; Einbond et al., 2004). Polyphenols are classified into two main groups: non-flavonoids (hydroxybenzoic and hydroxycinnamic acids and their derivatives, stilbenes and phenolic alcohols) and flavonoids (anthocyanins, flavanols, flavonols and dihydroflavonols) (Fanzone et al., 2012).
Biological properties of polyphenols are attributed to their powerful antioxidant, metal chelating and antiradical activities (Wu et al., 2010; Šeruga et al., 2011). Also, phenolic compounds reduce the risk of chronic diseases, eliminating free radicals that induce vascular relaxation, and they exhibit anti-inflammatory, anti-cancer, antiviral and antibacterial properties (Gris et al., 2011).
Most of the data available in literature sources on phenolic composition and antioxidant activity of grapes stem from varieties produced in France, Italy, Spain, USA, Turkey, Chile, Brazil and Argentina. In Mexico, 75 % of grape production is allotted for grapes, 22 % goes towards wine production, juices and jams and 3 % for raisin production. In 2012, Sonora produced 80 % of all grapes in Mexico whereas Zacatecas followed in second place with 7.8 %; however, there is little information about nutritional content, total phenolic content and antioxidant activity of grapes produced in Zacatecas. Mexico. Therefore, the objective of this study was to determine the total phenolic content and antioxidant activity of nonnative wine grape varieties produced in the Department of Agriculture, Autonomous University of Zacatecas.
Materials and Methods
Raw material
White grape varieties of Furmint, Palomino, Semillon, Sauvignon Vert, and red grape varieties Cabernet Sauvignon, Merlot, Rubired and Petite Syrah were harvested and used for the experiments. The plantation design allowed 3 m of separation between rows and 1.5 m between plants, with a density of 2600 plants per unit of production. Besides, a system of bilateral cordon allowed optimal sun exposure. This plantation design was used for both red and white varieties. The growing season began in March 2015 and ended in August 2015. All grapes were stored in a refrigerator (up to 12 h), were rinsed with distilled water and dried with paper towels before handling.
Analysis
All samples were analyzed for moisture content (AOAC, 2013, 1997), and soluble solids of the liquid phase of the samples (°Brix) at 20 °C (refractometer Atago NAR-3T, Tokyo, Japan). The pH was measured with a digital pH meter (Denver instruments pH Meter TP 214, Germany). Total acidity was measured by potentiometric titration with NaOH (0.1 N) and expressed in mg of the main acid (tartaric acid, TA) (AOAC, 1997).
Extraction of phenolic compounds
Phenolic compounds were extracted (Tomás-Barberán et al., 2001) by homogenizing 35 g of the grape sample for 10 min with 40 mL of methanol, 10 mL of HCl 6N and 2 mg of NaF to inactivate the polyphenol oxidases and prevent phenolic degradation. After extraction, the mixture was centrifuged (2701 x g; 4 °C) for 10 min. The supernatant obtained was stored (24 h) in opaque vials at 4 °C until analyzed.
Determination of total phenolic content (TPC)
Total phenolic content (TPC) was quantified using the Folin-Ciocalteu test (Li et al., 2006); 250 μL of extract was mixed with 15 mL deionized water and 1.25 mL of Folin-Ciocalteu phenol reagent. After 5 min 3.75 mL of Na2CO3 (7.5 %) was added and leveled to 25 mL with deionized water. Absorbance was measured at 765 nm in a spectrophotometer UV-Vis (Termo Scientifc 10S, Termo Fisher Scientifc Inc, USA). The results were reported as mg of gallic acid (mg GAE 100 g-1 fresh grape).
Antioxidant capacity (AC) ABTS+ scavenging ability
The same extract obtained for TPC quantification was used to evaluate AC. The AC was determined through a modification of the spectrophotometric technique developed by Re et al. (1999), using the ABTS+radical (Sigma) generated by 2.45 mM potassium persulfate (K2S2O8). The mixture remained in the dark at room temperature (~20 °C) for 16 h before use, and then the ABTS+solution was diluted to give an absorbance of 0.7±0.1 at 734 nm. Afterwards, 100 𝜇L of grape extract was mixed with 900 𝜇L of the ABTS+diluted solution, and the absorbance was measured at 734 nm. The results were expressed as antioxidant activity equivalent to 𝜇mol units of Trolox (TEAC) 100 g-1 fresh sample. All the experiments were replicated thrice.
Antioxidant capacity (AC) & DPPH cavenging activity
The method reported by Brand-Williams et al. (1995) was used for analyzing AC of samples, with a slight modification: 100 𝜇L of grape extract were added to 1 mL of 2,2-diphenyl-1-picrylhydrazyl (DPPH) mM (3mg 100 mL-1 in methanolic solution). The scavenging activity of the free radicals, using the free radical reaction DPPH, was evaluated by measuring the absorbance at 515 nm, after a 2.5 min reaction at 20 °C, in a spectrophotometer. Results were expressed as 𝜇mol equivalents of Trolox 100 g-1 of fresh sample.
Experimental design and statistical analysis
Experimental design was completely randomized with three replications. All analyses were carried out in triplicate and the results expressed as mean, ± standard deviation. To determine statistically significant differences between the data of the variables in the grape varieties, a one-way ANOVA was carried out and, if significant, a Tukey test was applied (p≤0.05). The values of antioxidant activity and total phenol content were analyzed using Pearson correlation and linear regression. All statistical analyses were performed using Statgraphics® Centurion XV (Statpoint Technologies Inc., Warrenton, VA, USA).
Results and Discussion
The Palomino grape had the highest moisture content and the lowest value of soluble solids (°Brix), This was due to the reproductive behavior of the plant, tending to have less fruit per grapevine, a higher density per cluster and less seed presence per grape, resulting in a lower content in soluble solids. Rubired grapes had the lowest pH value and the highest titratable acidity (tartaric acid mg 100 g-1) (Table 1). This was due to the lack of Heating Degree Days (HDD), and perhaps it required 7 d more to complete the intermediate production cycle. The pH indicates the strength of the acids present in the must (Blouin and Guimberteau, 2003), while acidity is the result of complex physiological processes in which respiration plays an important role i.e., acids are used as metabolites for respiration during growth and maturation in some fruits (Dorey et al., 2016). Other studies have attempted to link a single climatic variable to fruit acidity, e.g., temperature was linked to grape acidity (Etienne et al., 2013). In grapes, tartaric and malic acids constitute almost the totality of organic acids (Saxton et al., 2009). According to ANOVA (p>0.05), there were no significant differences in moisture content of red grape varieties. The other physicochemical variables showed significant differences (p≤0.05) for red and white grapes.
Table 1 Physical-chemical variables for white and red wine grape varieties.
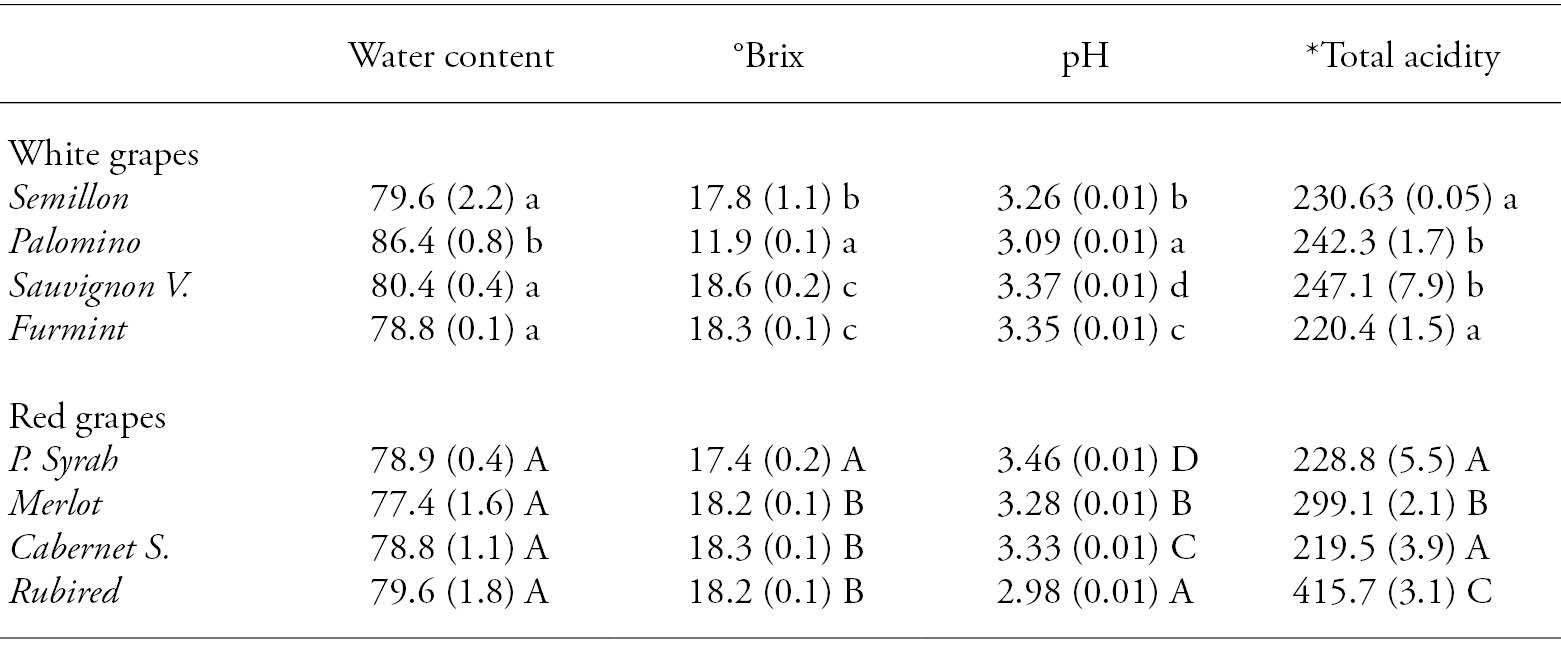
*Total acidity: mg tartaric acid 100 g-1. Different lower case letters in a column indicate statistically significant differences between white grapes (Tukey; p≤0.05). Different upper case letters indicate statistically significant differences between red grapes (Tukey; p≤0.05).
Red grapes showed higher values of TPC as compared to white grapes and the highest concentration was found in Rubired grapes (607.6 mg GAE 100 g-1), followed by Merlot (537.1 mg GAE 100 g-1), Petite Syrah (488.8 mg GAE 100 g-1) and Cabernet Sauvignon (321.9 mg GAE 100 g-1) (Figure 1).
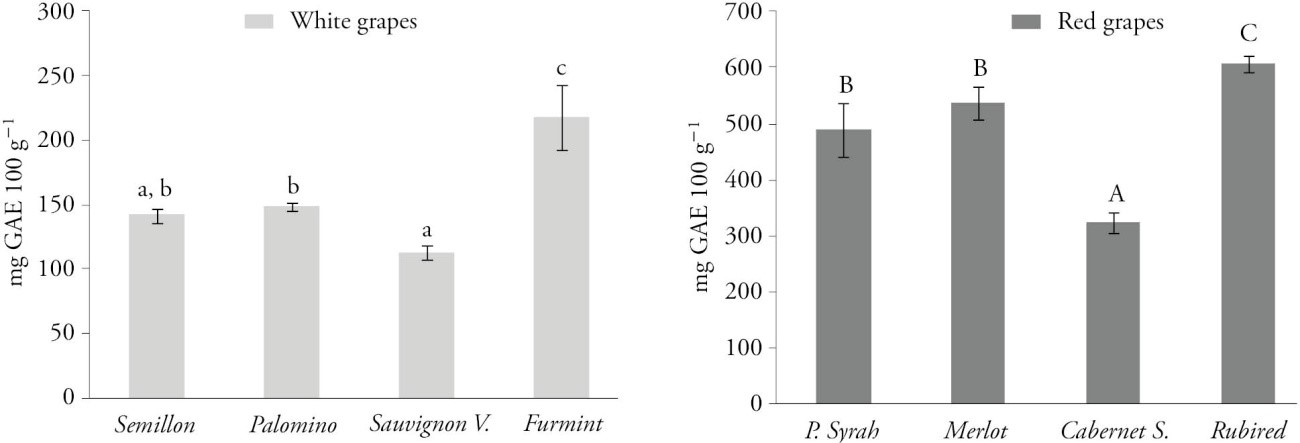
Figure 1 Values and standard deviation of the total phenol content (mg GAE 100 g-1) in white and red wine grape varieties. Data are means ± SD (n=3). Different lower case letters in bars indicate statistically significant differences between white grapes (Tukey; p≤0.05). Different upper case letters in bars indicate statistically significant difference between red grapes (Tukey; p≤0.05).
Out of the white grape varieties, the Furmint grape had the highest TPC (218 mg GAE 100 g-1) followed by Palomino (148.5 mg GAE 100 g-1), Semillon (142 mg GAE 100 g-1) and Sauvignon Vert (112.7 mg GAE 100 g-1) (Figure 1).
The phenolic composition of grape varieties depends on several factors, such as the intrinsic potential of each grape variety (Rodríguez Montealegre et al., 2006; Ruberto et al., 2007; Obreque-Slier et al., 2010; Costa et al., 2015). Due to variations among cultivars, different species of grapes show diverse phenol content (Rebello et al., 2013). The climate conditions are particularly important for grapevine cultivation, in which heat, drought and light intensity are some environmental factors that have an impact on the phenolic metabolism as well as grape development and chemical composition (Teixeira et al., 2013). In our study, the differences between the grapes of the same colour can be attributed to grape variety because there were no climatic and geographical differences. According to Mazza et al. (1999), varietal factors determine concentration, distribution and accumulation of polyphenols in grapes. Besides, total polyphenols in white grape varieties are lower than in red grapes, since white varieties do not synthesize anthocyanins and polyphenols; synthesis in grapes is influenced by factors such as temperature, water availability, sun exposure of the clusters, and time of the vintage during the berry ripening (Ivanova et al., 2011). In warmer climates, high light exposure can increase the concentration of phenolics and anthocyanins (Roubelakis-Angelakis and Kliewer, 1986). Sun exposure is considered to be of primary importance for high quality wine production. However, it is not clear whether the effect on fruit composition is due to visible light or ultraviolet light or both (Keller and Torres-Martinez, 2004; Schreimer et al., 2012). In the vineyard, e.g., any cultural practices that favor the exposure of grape brunches to sunlight boost flavonol accumulation. This occurs equally in white and red grapes (Teixeira et al., 2013).
Merlot was 37 % higher in GAE compared with those reported by Abe et al. (2007) who found 337 mg GAE 100 g-1. Panceri et al. (2014) reported 89 % less (59.28 mg GAE 100 g-1) and Burin et al. (2014) 85 % less (83.1 mg GAE 100 g-1). Also, for the Cabernet Sauvignon variety a difference of 79.1 % and 76 % was observed in total phenol content, as compared with those reported by Panceri et al. (2014) and Burin et al. (2014), 67.4 and 76.5 mg GAE 100 g-1, respectively. Regarding Petite Syrah grape, the results in our study differed by 21 % with those published by Abe et al. (2006) (388 mg GAE 100 g-1).
For AC, red grapes showed a higher capacity (𝜇mol TEAC 100 g-1) than white grapes, regardless of the method used (DPPH vs. ABTS) (Table 2). Among the red grapes, Petite Syrah showed the highest AC (𝜇mol TEAC 100 g-1), followed by Merlot, Cabernet Sauvignon y Rubired varieties. In white grapes, Palomino showed the highest AC when tested by ABTS method, and Furmint with the DPPH method. For Cabernet Sauvignon, AC values were 191.1 𝜇mol TEAC 100 g-1 with the DPPH method and 213 𝜇mol TEAC 100 g-1 with the ABTS assay (Burin et al., 2014), whereas Panceri et al. (2014) reported 182.2 𝜇mol TEAC 100 g-1 with the DPPH and 195 𝜇mol TEAC 100 g-1 with ABTS. For Merlot, AC values were 166.6 𝜇mol TEAC 100 g-1 using DPPH and 231.6 𝜇mol TEAC 100 g-1 with ABTS (Panceri et al., 2013).
It is noteworthy that lower values were quantified in AC when the ABTS method was used in all varieties. However, studies carried out by Burin et al. (2014) on red and white grapes from V. vinifera L. and V. labrusca L. varieties, Xu et al. (2010) on white and red grapes, Burin et al. (2011) on red wine, and Toaldo et al. (2013) on grape juice indicated higher values for the antioxidant activity using the ABTS method.
In our study, AC with the ABTS method shows a stronger correlation (R2=0.8304) with TPC (Figure 2), and the mathematical model proved well adjusted for TPC and AC. This goes along with the results of Tagliazucchi et al. (2010), who verified that the antioxidant capacity of grapes is dependent on the phenolic composition. However, a lower correlation between TPC with DPPH method (R2=0.415) was found.
Table 2 Values and standard deviation of antioxidant capacity (mg TEAC 100 g-1) in white and red wine grapes varieties.
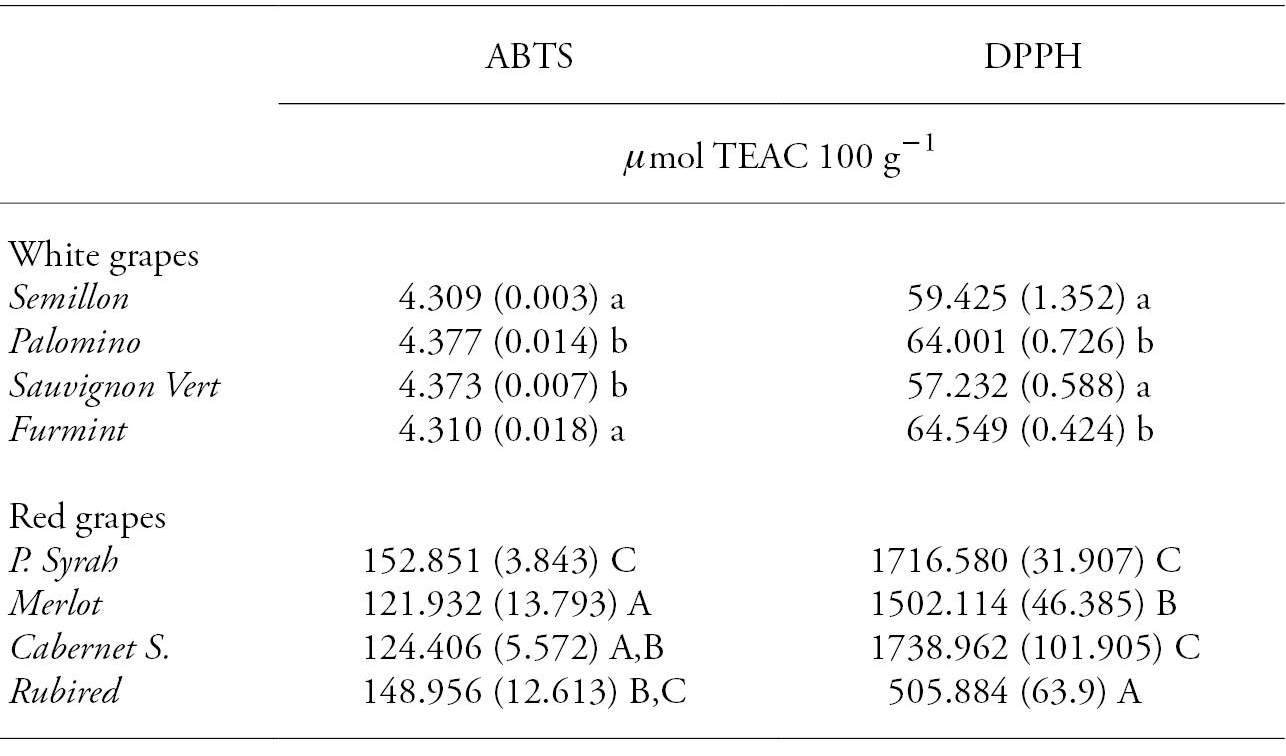
Different lower case letters in a column indicate statistically significant differences between white grapes (Tukey; p≤0.05). Different upper case letters in a column indicate statistically significant differences between red grapes (Tukey; p≤0.05).
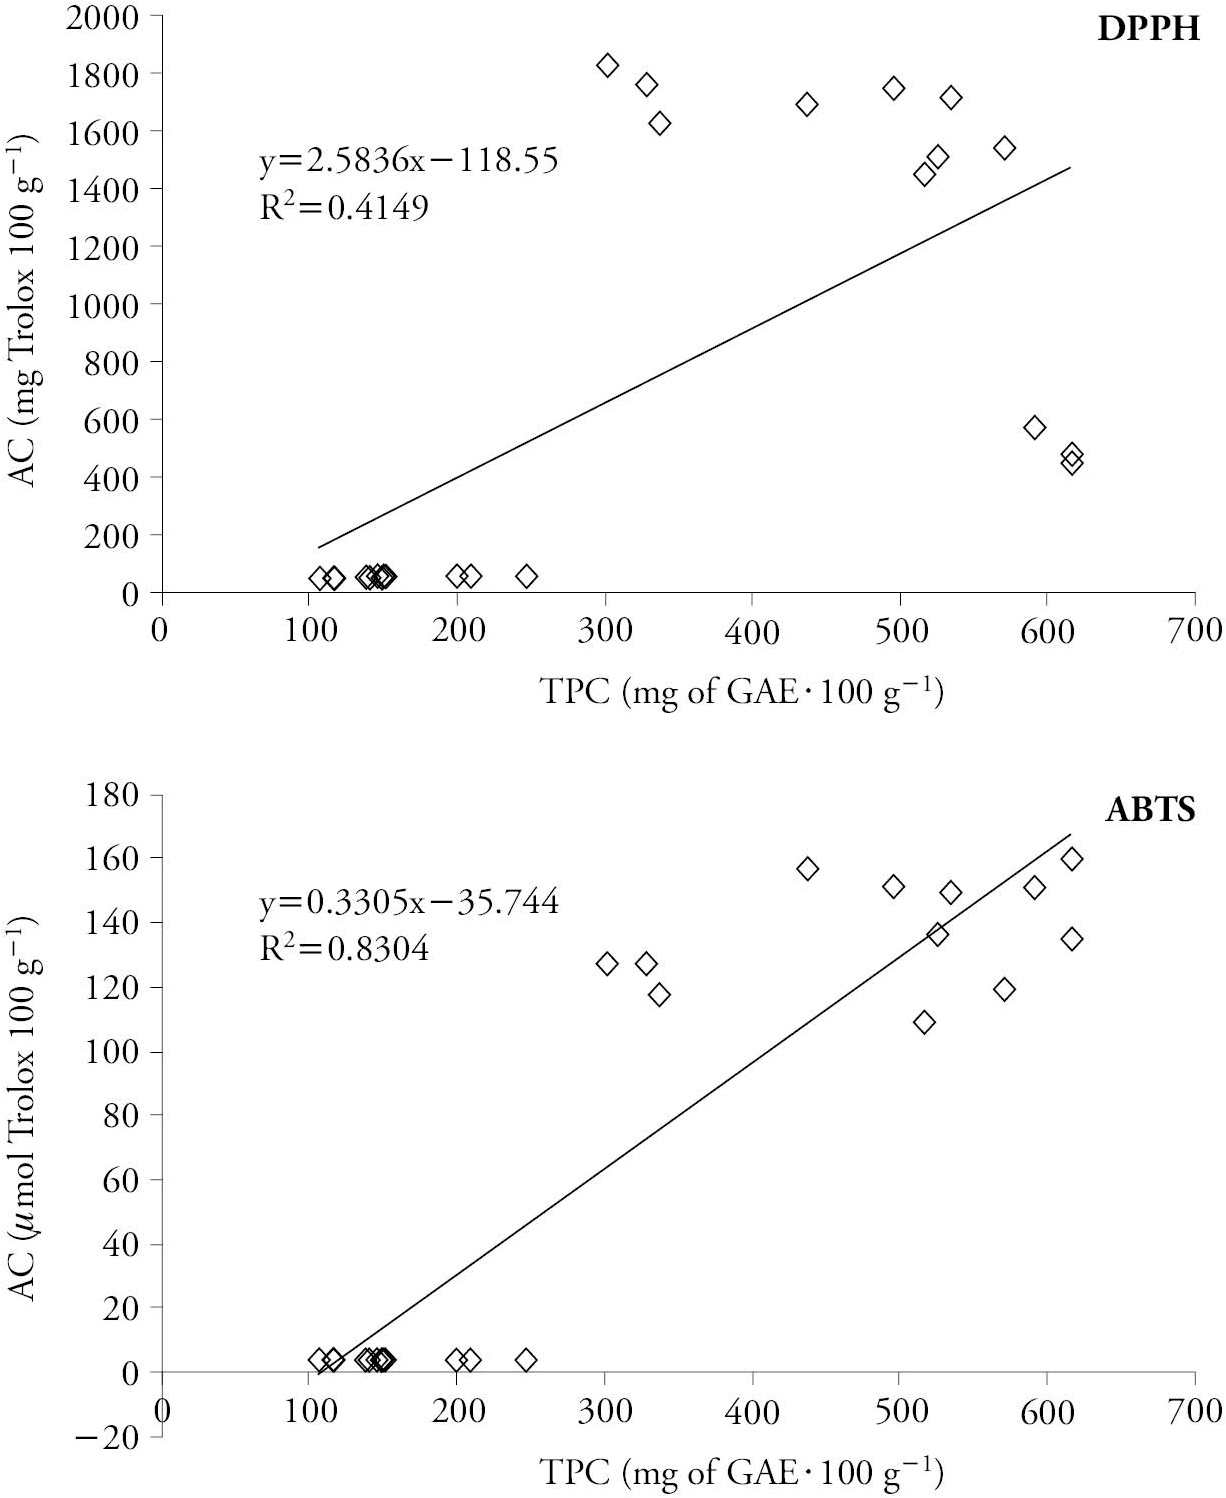
Figure 2 Relationship between antioxidant capacity (𝜇mol Trolox 100 g-1) and total phenolic compounds (mg GAE 100 g-1) of white and red wine grape varieties.
The biological properties of phenolic compounds include antibacterial, antifungal effects, as well as cardioprotective, anticancer actions. The composition of phenolics in grapes changes with variety, species, season, environmental and management factors such as soil conditions, climate and crop load. The AC of grape-derived products is affected by their total phenol content, which is influenced mainly by the grape variety (Burin et al., 2014). However, Nixdorf y Hermosín-Gutiérrez (2010) observed just the opposite, a lack of correlation and a negative correlation between total phenol content and AC.
Conclusions
Grape varieties adapted to the climatic conditions of the city of Zacatecas resulted in similar or even higher values in the total phenolic content and antioxidant activity compared to those published by other authors for grapes from other countries. The total phenol content was significantly higher in red varieties of Rubired, and white varieties of Furmint. Among all the samples, it was observed that red grape varieties, especially Petite Syrah and Rubired had a higher antioxidant potential, which is associated to their higher content of bioactive compounds. The antioxidant activity showed a good correlation with TPC. The grape varieties analyzed represent a suitable choice for cultivating wine grapes in Zacatecas. This would help to diversify the types of wines produced in that State.

