


Servicios Personalizados
Revista
Articulo
 texto en
  Inglés (pdf)
 Artículo en XML
 Referencias del artículo
 Enviar artículo por email
Indicadores
-
 Citado por SciELO
 -
 Accesos
Links relacionados
-
 Similares en
SciELO
Similares en
SciELO
Compartir

 Permalink
Agrociencia
versión On-line ISSN 2521-9766versión impresa ISSN 1405-3195
Agrociencia vol.51 no.6 Texcoco ago./sep. 2017
Water-Soils-Climate
CONSERVATION ACTIVITIES OF SOILS IDENTIFIED THROUGH INDICES KAPPA INDICES IN NORTHEAST OF DURANGO, MEXICO
1Universidad Autónoma Chapingo, Unidad Regional Universitaria de Zonas Áridas. Km. 40 Carretera Gómez Palacio-Chihuahua. 35250. Bermejillo, Durango.
2Centro Nacional de Investigación Disciplinaria en Relaciones Agua Suelo Planta Atmósfera del Instituto Nacional de Investigaciones Forestales, Agrícolas y Pecuarias (CENID-RASPA-INIFAP), Gómez Palacio, Durango.
Estimation of soil erosion based on modeling, as with the Universal Soil Loss Equation (USLE) or the revised USLE (RUSLE), considers anthropogenic action (factor C) for land uses and has limitations to detect how that influence happens. The objective of this research was to develop a procedure to identify the presence or absence of soil conservation actions based on the expert observation of evidence on lands dedicated to rainfed agriculture in northern Durango, Mexico. The study unit (UE) of 2250 km2, included San Pedro del Gallo and San Luis del Cordero (25° 21” and 25’ 59” N; -104° 29”, -104° 1” W and arid and semiarid climate). The experimental design was completely randomized on the coverage of UE agricultural plots. A questionnaire with six categories and 15 indicators was used with the Kappa-Cohen technique. The information was analyzed with descriptive statistics module contingency tables in SPSS® (IBM, NY, USA). The results showed significant (p≤0.05) and highly significant (p≤0.001) concordances, which represented substantial agreement (Kappa=0.686). This indicated that 52 % of the study cases do not perform adequate rainwater management practices to favor crops, and do not incorporate organic matter; thus, the practice for the control of soil erosion is not a priority for UE farmers.
Key words: soil conservation; water erosion; expert observation
La estimación de la erosión edáfica basada en modelación, como con la ecuación universal de pérdida de suelo (USLE) o la USLE revisada (RUSLE), considera la acción antrópica (factor C) para los usos de la tierra y tiene limitaciones para detectar cómo sucede esa influencia. El objetivo de esta investigación fue desarrollar un procedimiento para identificar la presencia o ausencia de acciones de conservación de suelos a partir de la observación experta de evidencias en terrenos dedicados a la agricultura de secano, del Norte de Durango, México. La unidad de estudio (UE) de 2250 km2, incluyó a San Pedro del Gallo y San Luis del Cordero (25° 21” y 25’ 59” N; -104° 29”, -104° 1” O y clima árido y semiárido). El diseño experimental fue completamente al azar sobre la cobertura de parcelas agrícolas de la UE. Un cuestionario con seis categorías y 15 indicadores se empleó con la técnica Kappa-Cohen. La información se analizó con tablas de contingencia del módulo de estadísticas descriptivas en SPSS® (IBM, NY, USA). Los resultados mostraron concordancias significativas (p≤0.05) y altamente significativas (p≤0.001), que representaron acuerdos sustanciales (Kappa=0.686). Esto indicó que 52 % de los casos del estudio no realizan prácticas adecuadas de manejo del agua de lluvia para favorecer los cultivos, y no incorporan materia orgánica; así, la práctica para el control de la erosión edáfica no es una prioridad para los agricultores de la UE.
Palabras clave: conservación de suelos; erosión hídrica; observación experta
Introduction
In Mexico, data on water (EH) or wind erosion (EE) have historically been contradictory. For example, López-Santos (2016) considered three sources with EH and EE values: 29.5 and 30.7 % (Garrido and Cotler, 2010), 11.8 and 9.5 % (SEMARNAT, 2011) and 35 and 20 % (CONAFOR- 2013) on the magnitude of the National Territory (1.9 million km2). EH and EE showed uncertainties of 15.2 and 13.8 %; these values obviously produce different scenarios of the same problem.
Concerning this controversy, CONAFOR-UACh (2013) mentions that the most probable cause of these divergences has to do with the most used methods, which have included field observations and the use of parametric equations, such as the universal soil loss equation (USLE), revised USLE (RUSLE) and the development of algorithms associated with satellite images.
The Kappa index is a method of discrete statistics that calculates the concordance between two observers, whose purpose is to categorically determine the state of a problem under study (van Vliet et al., 2011; Saldaña et al., 2012 Lane et al., 2014, Feng et al., 2015). Its most frequent use, as a working method, is visualization (photointerpretation) for the identification of territory features on satellite images. Van Vliet et al. (2011) utilized this method of the concordance between two groups of data obtained from two maps to evaluate changes in an environment of simulation of land uses in Europe. Feng et al. (2015) identified land use zones in Yuyao, China, using remote sensing techniques and Kappa index, with random classifiers on SPOT images of medium resolution; this is one of the statistical resources used. The Kappa index as a method for analyzing field data is analogous to the methods used to evaluate the landscape in forest contexts, as reported by Zubelzu and Hernández (2015).The latter was based on the analysis of the whole landscape, and included 718 photographs from 92 sites in order to deduce a model that would allow them to explain the preferences of the population, based on the characterization of landscape attributes. They concluded that color and spatial composition are the two attributes that most contribute to modeling the preferences of those who judge the photographs.
The state of health and condition of ecosystem services, as they are currently defined (MEA, 2005): supply, support, regulation and culture, are essentially based on subjective assessments, which are then weighted by quantitative measures. The method of the 7th USDA approach, proposed by Klingebiel and Montgomery (1961) to classify lands is based on both components. The landscape valuation method reported by Zubelzu and Hernández (2015) is based on the use of aesthetic attributes as explanatory variables of preferences, based on evaluator observations. Ramírez-Carballo et al. (2011) used a participatory methodology for the characterization of areas degraded by soil erosion in order to detect priority areas for restoration in five cattle ranches of the Mapimí Biosphere Reserve in Durango, Mexico; it was based mainly on the observation of the inhabitants and technical participants during the field trips.
The objective of the present study was to develop a procedure to identify the presence or absence of soil conservation actions based on the expert observation of evidence on lands dedicated to dryland agriculture in the north of Durango, Mexico. The hypothesis was that more than 50 % of the indicators applied in the field, distributed in six categories, comprise the necessary elements to determine the meaning of the anthropic action in the prevention of water erosion for the study unit (SU).
Materials and Methods
The UE (Figure 1a) included the municipalities of San Pedro del Gallo and San Luis del Cordero, NE of the state of Durango, Mexico, and W of the Comarca Lagunera, Durango (25° 21” and 25’ 59” N, -104° -29” -104° 1” W); it borders N with Hidalgo and Mapimí, S with Rodeo and Nazas, E with Nazas and W with Indé (INEGI, 2010). The UE presents a climatic gradient, from NW to SE, from semi-arid (BS1kw) to arid (BWhw, BSohw), average annual temperature of 18 °C, ranging from 14 to 22 °C, and annual rainfall of 200 to 400 mm (Figure 1b and 1c); altitude of 1300 to 2400 m and surface area of approximately 2550 km2 (about 1.9 % of the state territory). In the territory dry land agriculture prevails settled mainly (92 %) in Leptosoles (INEGI, 2007; INEGI, 2010).
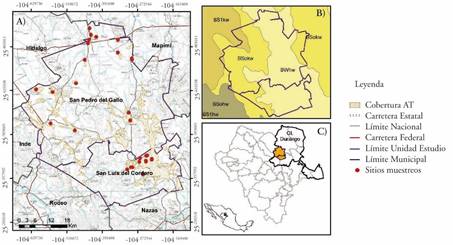
Figure 1 Geographic location (A), sub-climates, (B) and territorial integration (C) of the study unit.
Phases of research, input and pre-diagnosis information
The research was carried out in three phases, with a trans-scalar approach (from regional to local), as described by Segundo and Bocco (2012). Thus, a SU reference pre-diagnostic was established. The general characteristics of the phases were as follows.
Phase I. Preliminary data and research of the SU agricultural process. The input information included the vector sets (shp) at scale 1: 250,000 of the Soil Science Series II (INEGI, 2007) and Land Use and Vegetation (USV) series V (INEGI, 2010). From the USV vector set we obtained the polygons of dryland agricultural use (Figure 1a and 1b); while the agricultural process in the SU was documented with support from the reporting producers.
Phase II. The information from Phase I was analyzed and interpreted by contrasting it with information of higher resolution. To this end, the vector sets of the ejido coverage were used at a 1: 50 000 scale; the digital elevation model with resolution of 30 m, which was downloaded from the Mexican Elevation Continuum (Continuo de Elevación Mexicana) (CEM 3.0) of INEGI (2015) and the scene (Path/Row) 30/42 from LandSat May 8, 2014, downloaded from the United States Geological Service Portal (USGS, 2015). From the latter, we obtained sub-images consistent with the SU coverage in order to identify areas of agricultural use (Figure 3a and 3b).
Phase III. In this phase, we identified the requirements for field work, such as the technical profile of expert observers (EO) and the selection of direct and indirect factors (indicators) that contribute to the phenomenon of water erosion.
Definition of indicators
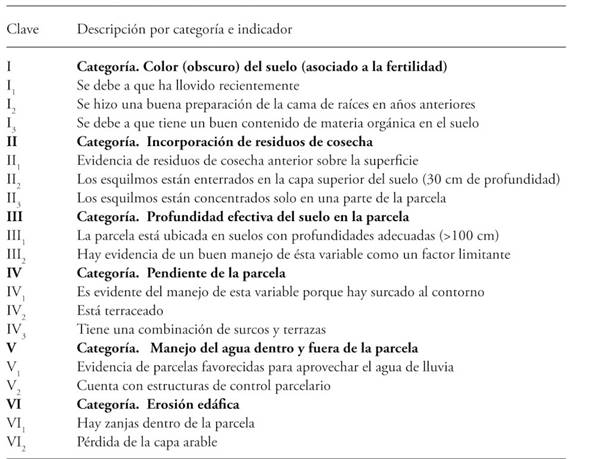
The EO, with an agronomy profile and knowledge on soil erosion, elaborated the questionnaire and created a theoretical framework to define the meaning and application of each of the 15 indicators (Ix) in order to generate categorical responses. These indicators were grouped into six categories (Table 1).
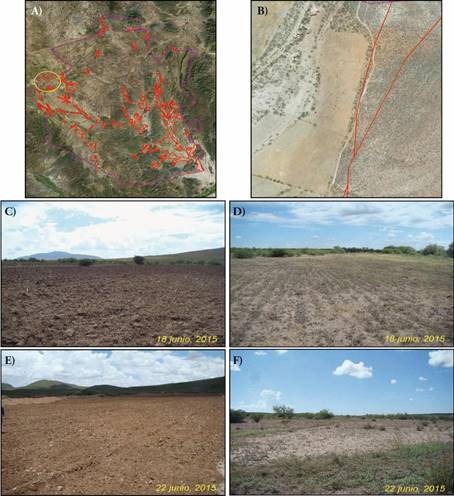
Figure 3 Images at regional (A), local (B) and plot scale in samples taken at different dates (C-F).
Statistical design and sample size
The statistical design was based on the definition of a sample size based on the total area (23 606 ha) dedicated to dryland agriculture in the SU and an average endowment (20 ha) for this use:
 ()1
()1
where
n is the sample size, t is the confidence level (at 0.95=1.96),
p is the proportion of land tenure owned by a producer relative to the total number of hectares in the producing area (20/23,606 = 0.00085), and
m is the margin of error (0.05). Although the result was n=28, in the end it was increased to 31 plots, which we visited after a completely randomly designed selection (Figure 1a) and applied the questionnaire.
Statistical analysis and hypothesis testing
We conducted the statistical analysis and hypothesis testing using the Cohen’s Kappa coefficient (1960) or Kappa concordance coefficient. In this case, the coefficient expresses the agreement between two observers, applied to two data groups, defined in six categories (I, II, III, .. c) and 15 indicators (1, 2, 3, .. ij). For its analysis, Kappa is integrated into a contingency matrix for the two data groups (a and b), represented by the responses of the two observers as A and B (Table 2).
The elements p (a=AI1 ˄ b=BI1) in Table 1 indicate the fraction that the indicator has for each category in the domain of each observer (A and B) and the diagonal line p (a=Acij ˄ b=Bcij) expresses agreement on the 15 indicators of the evaluation by both observers; and in total rows and columns p (a=Acij) and p (a=Acij) indicate the fraction corresponding to observers A and B (Table 2).
Table 2 Generic contingency matrix for the probabilistic analysis of six categories and 15 indicators.
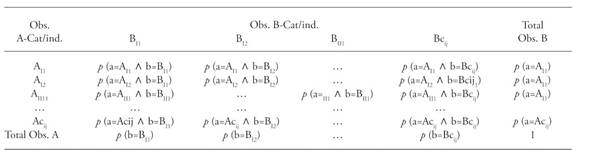
Obs: observer; Cat: category and p: proportion.
From the fractions of the contingency matrix (Table 2), the fraction of the observed agreement P o and the fraction of the expected agreement (P e ) can be calculated as follows:
 ()2
()2
 ()3
()3
where
i can be any of the 15 indicators used by both observers whose z-limit in the Contingency Table for a and b were defined as Acij and Bcij, respectively.
The P o and P e fractions were needed to calculate the degree of agreement (Yes/Yes or No/No), disagreement (Yes/No) and uncertainty (No/Don’t know) and choose the appropriate indicator, defined as:
 ()4
()4
where
k is the coefficient of agreement or Kappa index (between 0 and 1). When k tends to 1 its gradient may fall into one of the following six conditions: (i) without agreement (<0), (ii) insignificant (0 - 0.2), (iii) medium (0.21-0.40), (iv) moderate (0.40 - 0.60), v) substantial (0.61 - 0.80) or vi) almost perfect (0.81 - 1.0).
The analysis of the information was performed in the descriptive statistics module of SPSS.
Results and Discussion
Evidence observed in the field
Color of soil associated with fertility
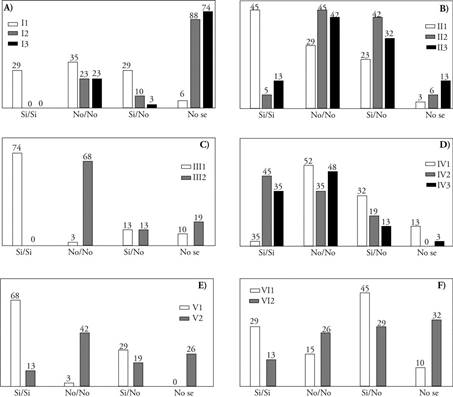
For the color of the soil associated with its fertility in its upper layer both observers showed high uncertainty, with main response “I do not know” (66 and 74 %). Questions two (I2) and three (I3) were associated with pre-sowing (fallow or subsoil) and soil organic matter content. This was in accordance with the fact that during the field study there were rains (15.8 mm and 16.4 on June 18 and 19) that caused humidity which darkened the soil in some cases (Figure 2a).
Incorporation of crop residues
The three indicators used to detect crop residues, such as mulch (II1), in part or all of the surface (II2), or buried (II3) by trawl or fallow, showed a coincidence (42 % and 45 %) between the EO, with no slashes on or below surface; only 29 % of the cases showed evidence in isolated parts (Figure 2b).
Effective depth of soil
Regarding soil depth, both observers divided their response in two senses: they agreed that 74 % of the plots were located on land with adequate depths (>100 cm) (III1) and in 68 % of the cases they indicated that there was no evidence of adequate management of this variable (III2) (Figure 2C).
Slope of the plot
For the slope variable of the plot there was certainty; since in 52 % of the cases there was no evidence of furrow contouring (IV1), and there were lands (45 %) with terrace evidence (IV2); thus, the combination of furrows and terraces (IV3) accumulated 48 % of negative responses (Figure 2D).
Water management on and off the plot
A high percentage (68 %) of evidence showed that farmers use the natural currents that form streams during the rainy seasons to drive water to their plots (V1), but in 42 % of the cases no plot control structures were located (V2 ), which increases flood risks (Figure 2E).
Soil erosion
Field inspection by both observers did not coincide, they had a Yes/No discrepancy in the indicators: presence of trenches (VI1) and laminar erosion on the arable layer (VI2), of 45 and 29 %, respectively. So the affirmative response was similar to the negative, and the combined percentages of both indicators to determine if there was erosion totaled 42 % (Figure 2F).
Analysis and interpretation of concordance
The concordance analysis allowed to obtain the specific measure on the degree of agreement between the OEs in each indicator; in six of them there were significant (p≤0.05) and highly significant (p≤0.001) agreements. These represented substantial agreements (Kappa=0.686), which indicated that more than half of the plots evaluated (52 %) presented evidence of adequate practices to manage rainwater, favor crops and improve the expectation of harvesting, but not to conserve the soil (Table 3).
Table 3 Results of Kapa statistical analysis to determine the degree of agreement among observers.
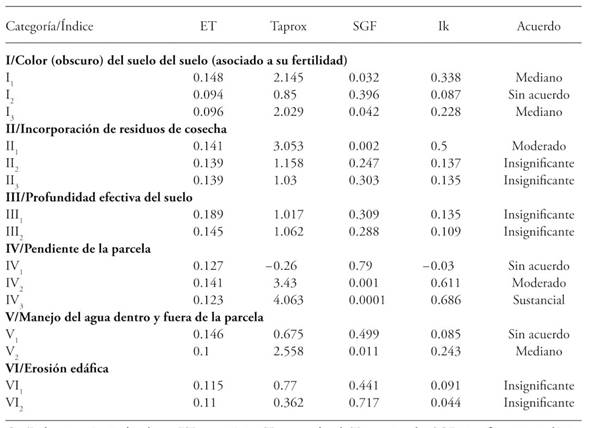
Cat/Ind: category and indicators; ET: typical error; Taprox: approximate T value; SGF: statistical significance and Ik: Kappa indez.
The results also confirm the hypothesis of independence of random agreements in 40 % (6/15) of the indicators corresponding to categories I, II, IV and V (Table 3). The interpretation of these categories is as follows.
I. Color (dark) of the soil (associated with its fertility)
The moisture content of the soil due to the rains of the first days of the study amounted to 32.2 mm in two consecutive days. On the organic matter content, the observers showed medium agreements, with Kappa indexes of 0.338 and 0.228. That is, soil color indicators I1 and I3 could not be associated with soil fertility in 35% (No/No) and 74% (I do not know) of the cases (Figure 3C and 3E).
II. Incorporation of crop residues
For the first indicator of category II1 the observers had a moderate agreement, 45 % of the cases evaluated affirmatively (Yes/Yes), with a Kappa index of 0.5 and a confidence level of 99 %; but evidence showed that the incorporation of crop residues for soil protection or increased biological fertility is not commonly performed (Figure 3C).
IV. Slope of the plot
For indicators III2 and III3 of category IV the observers had moderate to substantial agreements, with Kappa indexes of 0.611 and 0.686, and confidence level of 99 %. Thus, of the sites visited, only 45 % of the lands were terraced and in 48 % furrows and terraces are not combined (Figure 3D).
V. Water management on and off the plot
For the V2 indicator of category V the observers had a medium agreement with a Kappa index of 0.243. The confidence level was 95 %. It was revealed that 42 % of the sites visited do not have structures to control water at the plot level (Figures 3D and 3F).
Relevance of the categories used to detect soil conservation actions
Of the six categories (Table 1), only VI (edaphic erosion) was directly related to the problem studied. In the first five categories, the pertinence and approach of their application through the indicators defined in each case, and to detect the conservation actions of the case studied would be as follows. Bautista-Zúñiga et al. (2003), Doi and Ranamukhaarachchi (2007), Towhid (2013) and IUSS-WRB (2015) confirmed the relevance of using soil color (Category I) and its indicators to relate it to organic matter content and its susceptibility to water erosion, mainly because Leptosols predominate in the SU. Bautista-Zúñiga et al. (2003) mentioned that in the Mayan nomenclature color is a distinctive property for Leptosols in the henequen area of Yucatan, especially for reddish-brown colors like those in Figures 3C and 3E.
Evidence tracking concerning the incorporation of crop residues (Category II) on the surface (II1) or buried (II2), as in the previous case, allows to detect current or potential erosion problems (Figure 3C-3F).
It is documented that soil cover, such as changes in soil use, can alter the hydrological cycle at different scales through changes in runoff rates, sediment yield and infiltration (Mzezewa and Rensburg, 2011; Heo et al., 2015); so that in the absence of conservation practices such as the use of cover crops, no tillage, crop rotation and other protection measures or mulching, the problem of erosion can worsen without control (Nangia et al., 2010; Bhardwaj and Kendra, 2013).
The effective depth of the soil in the plot (Category III) and the applied indicators (III1 and III2) are also relevant in this case, since it is a fundamental variable from which it is possible to define (at least) the productive aptitude because of its close relation with efficiency in the decomposition of the crop residues that are incorporated in the soil profile (Schoeneberger et al., 2012 Zou et al., 2016).That is, both the incorporation of crop residues and soil depth are key, among others, for the evaluation of susceptibility to erosion. Zou et al. (2016) studied the return or incorporation of straw (cereals) into deep soils in a semi-arid environment (Fumeng County, China), with a precipitation similar to the SU (450 mm annually) and determined that at 15 cm depth there are the best conditions for decomposition and formation of organic C.
In all cases, the slope of the plots (Category IV) was natural, since soil management practices such as contour furrowing (IV1), terraced (IV2) or their combination (IV3) are recommended to reduce and control problems of erosion (SEMARNAT-CONAFOR, 2007; Sensoy and Kara, 2014; Khaledi et al., 2016) and to increase the availability of water in order to improve agricultural productivity (Nangia et al., 2010). Şensoy and Kara (2014) studied the shape of the slope (uniform, concave and convex) and found that uniform slope, such as that prevailing in the SU (1 to 5%), for fine textured shallow soils (5 to 30 cm), had maximum sediment production levels between 3.1 and 5.5 t ha-1; these values coincide with those by López-Santos et al. (2012) in the north of Durango, Mexico.
Water (Category V) and applied indicators (V1 and V2), just like the previous ones, were relevant because due to the water deficit for crops like maize and some forages that do not thrive with rains such as those regularly occurring in the SU (-450 mm); so to increase the availability of water the structures of conduction, diversion and land distribution are indispensable for successful crops.
Rashid et al. (2016) showed that through terracing in agricultural lands located in a semi-arid climate in Pakistan (33.55° N, 72.58° E) moisture availability improved by 16 %, sediment yield decreased as well as nutrient loss, leading to a 20 % increase of wheat production.
Conclusions
The present hypothesis is accepted since the procedure described allowed to discover, with little more than half of the indicators used, (52 %), that the anthropic action on the utilitarian-extractive type of soil resource predominates over the conservationist. Evidence showed that the SU farmers do not carry out continuous protection and conservation practices, such as terracing, contouring or their combination, or the incorporation of crop residues from their own land. In any case, farmers are likely to be more interested in tapping the water from runoff from seasonal rains for minor deviation and plot works.
The six categories (I) and 15 indicators (x) revealed critical aspects of the problem of water erosion, such as rainfall erosivity on bare soil, runoff formation and soil management. This demonstrate that the procedure is feasible to generate categorical information in order to reinforce priority areas, justify the implementation of land reclamation and restoration practices and feedback modeling-based assessments such as USLE and RUSLE
Literatura Citada
Bautista-Zúñiga F., J. Jiménez-Osornio, J. Navarro-Alberto, A. Manu y R. Lozano. 2003. Microrelieve y color del suelo como propiedades de diagnóstico en Leptosoles cársticos. Terra 21: 1-11. [ Links ]
Bhardwaj R. L., and K. V. Kendra. 2013. Effect of mulching on crop production under rainfed condition. A review. Agri. Rev. 34: 188-197. [ Links ]
Cohen J. A. 1960. Coefficient of agreement for nominal scales. Educ. Psychol. Meas. 20: 37-46. [ Links ]
CONAFOR-UACh (Comisión Nacional Forestal y Universidad Autónoma Chapingo). 2013. Línea base nacional de degradación de tierras y desertificación. Informe final. Comisión Nacional Forestal y Universidad Autónoma Chapingo. Zapopan, Jalisco, México. [ Links ]
Doi R. and S. L. Ranamukhaarachchi. 2007. Soil colour designation using Adobe PhotoshopTM in estimating soil fertility restoration by Acacia auriculiformis plantation on degraded land. Curr. Sci. 92: 1604-1609. [ Links ]
Feng Q., J. Gong, J. Liu and Y. Li. 2015. Flood mapping based on multiple endmember spectral mixture analysis and random forest classifier: The case of Yuyao, China. Remote Sens. 7: 12539-12562. [ Links ]
Garrido, A. y H. Cotler. 2010. Degradación de suelos en las cuencas hidrográficas de México. In: H. Cotler-Ávalor , A. Garrido Pérez, N. Luna González, C. Enríquez Guadarrama y M. L. Cuevas-Fernández (eds.). Las cuencas hidrográficas de México, diagnóstico y priorización. PLURALIA. México, D. F. pp: 104-107. [ Links ]
Heo J., J. Yu, J. R. Giardino, and H. Cho. 2015. Water resources response to climate and land-cover changes in a semi-arid watershed, New Mexico, USA. Terr. Atmos. Ocean. Sci. 26: 463-474. [ Links ]
INEGI, 2007. Conjunto de datos vectorial Edafológico escala 1: 250 000 Serie II (Continuo Nacional). http://www.inegi.org.mx/geo/contenidos/recnat/edafologia/vectorial_serieii.aspx (Consulta: mayo, 2015). [ Links ]
INEGI, 2010. Conjunto de datos vectoriales de Uso del Suelo y Vegetación escala 1:250 000 Serie V, capa unión. http://www.inegi.org.mx/geo/contenidos/recnat/usosuelo/Default.aspx . (Consulta mayo, 2015). [ Links ]
INEGI, 2015. Continuo de Elevaciones Mexicano, CEM-3.0, 2015. http://www.inegi.org.mx/geo/contenidos/datosrelieve/continental/Descarga.aspx . (Consulta mayo, 2015). [ Links ]
IUSS (Working Group) WRB. 2015. World reference base for soil resources 2014, update 2015 International soil classification system for naming soils and creating legends for soil maps. World Soil Resources Reports No. 106. FAO, Rome. 203 p. [ Links ]
Khaledi A. D., V. Homayounfar, and S. H. Sadeghi. 2016. The impact of standard preparation practice on the runoff and soil erosion rates under laboratory conditions. Solid Earth 7: 1293-1302. [ Links ]
Klingebiel, A.A.; Montgomery, P.H. 1961. Land capability classification. USDA Agricultural Handbook 210, Washington, DC: US Government Printing Office. 21 p. [ Links ]
Lane, R. C.; H. Liu; B.C. Autrey; O. A. Anenkhonov; V. V. Chepinoga; Q. Wu. 2014. Improved wetland classification using eight-band high resolution satellite imagery and a hybrid approach. Remote Sens 6: 12187-12216. [ Links ]
López-Santos A. 2016. Neutralizar la degradación de las tierras, una aspiración global. ¿Es posible lograrlo en México? Terra Latinoam. 34: 239-249. [ Links ]
López-Santos A., I. Sánchez-Cohen, G. Esquivel-Arriaga, and J. L. González-Barrios. 2012. Soils vulnerability assessment for the State of Durango, Mexico within the context of climate change. Rev. Agrociencia Uruguay 3: 117-127. [ Links ]
MEA (Millennium Ecosystem Assessment). 2005. Ecosystems and Human Well-being: synthesis. Island Press, Washington, DC. 155 p. [ Links ]
Mzezewa J., and L. D. Rensburg. 2011. Effects of tillage on runoff from a bare clayey soil on a semi-arid ecotope in the Limpopo Province of South Africa. Water SA 37: 165-172. [ Links ]
Nangia V., M.Ahmad , D.Jiantao , Y.Changrong, G. Hoogenboom, M. Xurong, H. Wenqing, L. Shuang, and L. Qin. 2010. Modeling the field-scale effects of conservation agriculture on land and water productivity of rainfed maize in the Yellow River Basin, China. Int J Agric. Biol. Eng. 3: 1-13. [ Links ]
Ramírez-Carballo, H., A. Pedroza-Sandoval, J. G. Martínez-Rodríguez, y R. D. Valdez-Cepeda. 2011. Evaluación participativa de la degradación del suelo en la Reserva de la Biosfera Mapimí. Rev. Chapingo Ser. Cien. Forestales Amb. 17: 1-9. [ Links ]
Rashid, M., O. Rehman, S. Alvi, R. Kausar and M. I. Akram. 2016. The effectiveness of soil and water conservation terrace structures for improvement of crops and soil productivity in rainfed terraced system. Pak. J. Agri. Sci. 53: 241-248. [ Links ]
Saldaña R. N., J. Á. G. Flores, S. B. García, A. S. Zavala y R. G. Kristian. 2012. Discriminación y estimación del área con labranza de conservación empleando imágenes SPOT 4. Rev. Mex. Cienc. Agríc. 3: 847-862. [ Links ]
Schoeneberger, P.J., D.A.Wysocki, E.C.Benham and W.D.Broderson. 2012. Field Book for describing and sampling soils, versión 3.0. Natural Resources Conservation Service, National Soil Survey Centre. Lincoln, NE. 300 p. [ Links ]
Segundo I., y G. Bocco. 2012. Usando datos censales desde un enfoque geográfico. El caso del despoblamiento de pequeñas localidades rurales en México (2000-2010). Realidad, datos y espacio. Rev. Int. Est. Geog. 3: 114-131. [ Links ]
SEMARNAT (Secretaría de Medio Ambiente y Recursos Naturales). 2011. Estrategia nacional de manejo sustentable de tierras. Secretaría de Medio Ambiente y Recursos Naturales. México, D. F. [ Links ]
Şensoy H., and Kara Ö. 2014. Slope shape effect on runoff and soil erosion under natural rainfall conditions. iForest 7: 110-114. [ Links ]
Towhid O. K. 2013. Soils. Principles, Properties and Management. First ed. Ed. SPRINGER, Dordrecht Heidelberg New York London. 286 p. [ Links ]
USGS (United States Geological Service). 2015. LandSat misions. Landsat Project Description. https://landsat.usgs.gov/ . (Consulta septiembre, 2015). [ Links ]
van Vliet J., A. K. Bregt and A. Hagen-Zanker. 2011. Revisiting Kappa to account for change in the accuracy assessment of land-use change models. Ecol. Model. 222: 1367-1375. [ Links ]
Zou H. et al. 2016. Effects of straw return in deep soils with urea addition on the soil organic carbon fractions in a semi-arid temperate cornfield. PLoS ONE 11: 1-10. [ Links ]
Zubelzu S; HernándezA . 2015. Método de valoración de paisajes forestales basado en el uso de atributos estéticos como variables explicativas de las preferencias. Madera Bosques 21: 45-62. [ Links ]
Received: April 2016; Accepted: January 2017
 Este es un artículo publicado en acceso abierto bajo una licencia Creative Commons
