


Servicios Personalizados
Revista
Articulo
 texto en
  Inglés (pdf)
 Artículo en XML
 Referencias del artículo
 Enviar artículo por email
Indicadores
-
 Citado por SciELO
 -
 Accesos
Links relacionados
-
 Similares en
SciELO
Similares en
SciELO
Compartir

 Permalink
Agrociencia
versión On-line ISSN 2521-9766versión impresa ISSN 1405-3195
Agrociencia vol.51 no.5 Texcoco jul./ago. 2017
Water-Soil-Climate
Design of an underground irrigation system to decrease soil evaporation, as compared with two conventional methods
1Programa de Agricultura en Zonas Áridas, Centro de Investigaciones Biológicas del Noroeste. Calle Instituto Politécnico Nacional 195. 23096. La Paz, Baja California Sur, México. etroyo04@cibnor.mx.
2Departamento de Agronomía, Universidad Autónoma de Baja California Sur. Carretera al Sur, Km. 5.5. 23080. La Paz, Baja California Sur. México.
The underground irrigation system is an alternative to increase water productivity in agriculture since it minimizes surface evaporation and increases water supply efficiency in the root zone. The objective of this study was to evaluate the amount of water lost by evaporation in three irrigation systems, two of them through surface supply and an underground irrigation system. Three irrigation systems were evaluated in, September 2015 and January 2016, by irrigation located in ditches (RZ), underground irrigation by diffusers (RSD) and drip irrigation with tape (RGC). The RZ system consisted of 1 m of ditch with 15 cm deep. The RSD was a sanitary PVC pipe of 5.08 cm inner diameter and 1 m long with side grooves located every 8.2 cm, placed horizontally at 20 cm deep, which is exposed to the ground surface by means of an elbow and tube segment of 30 cm long and the same diameter. The diffuser is filled with gravel from 3 to 7 mm to prevent ingress of fine particles. The RGC was 1 m of drip irrigation tape of 1.1 L h-1 every 20 cm. To measure moisture and evaporation, 10 L were applied to each irrigation system. We took samples of 150 g of soil at depths of 0 to 5, 5 to 10, 10 to 15 and 15 to 20 cm; moisture was determined with the gravimetric method, the first sampling was performed 15 min after irrigation and the following samples 24, 72 and 120 h. The RSD system showed the lowest evaporation; the difference between RSD and RZ was 30 % in 2015 and 41 % in 2016; the difference between RSD and RGC was 44 %, similar in both dates.
Key words: irrigation; water supply; sub-surface irrigation
El sistema de riego subterráneo es una alternativa para incrementar la productividad del agua en la agricultura, en virtud de que minimiza la evaporación superficial e incrementa la eficiencia de aportación hídrica en zona de raíz. El objetivo de este estudio fue evaluar la cantidad de agua perdida por evaporación en tres sistemas de riego, dos de ellos mediante aporte superficial y un sistema de riego subterráneo. Tres sistemas de riego se evaluaron en septiembre de 2015 y enero de 2016, mediante riego localizado en zanjas (RZ), riego subterráneo por difusores (RSD) y riego por goteo con cinta (RGC). El sistema RZ fue 1 m de zanja con 15 cm de profundidad. El RSD fue un tubo de PVC sanitario de 5.08 cm de diámetro interior y 1 m de longitud con ranuras laterales cada 8.2 cm, colocado horizontalmente a 20 cm de profundidad, el cual se expone a la superficie del suelo mediante un codo y segmento de tubo de 30 cm de longitud del mismo diámetro. El difusor se rellena con gravilla de 3 a 7 mm para evitar el ingreso de partículas finas. El RGC fue 1 m de cinta de riego con goteros de 1.1 L h-1 cada 20 cm. Para medir la humedad y evaporación se aplicaron 10 L a cada sistema de riego. Las muestras de 150 g de suelo se tomaron a profundidades de 0 a 5, 5 a 10, 10 a 15 y 15 a 20 cm; la humedad se determinó con el método gravimétrico, el primer muestreo se realizó 15 min después del riego y los siguientes a 24, 72 y 120 h. El sistema RSD mostró la menor evaporación; la diferencia entre RSD y RZ fue 30 % en 2015 y 41 % en 2016; la diferencia entre RSD y RGC fue 44 %, similar en ambas fechas.
Palabras clave: irrigación; aporte hídrico; riego sub-superficial
Introduction
Underground irrigation systems originated as an alternative to mitigate drainage problems and losses due to high rates of evaporation of irrigation water, whose formal research began in California, USA, more than 30 years ago (Ayars et al., 2015) . Now there are several types of underground irrigation, technology developed to reduce soil direct evaporation and achieve maximum control over the moisture content in the most active area of the root. In this way, a considerable saving of water for irrigation is obtained, an important aspect because the main constraint for agricultural production in arid zones is the availability of water (Montemayor et al., 2012). In the world, 72 % of the available water is destined to agriculture through various irrigation systems (FAO, 2007), and underground drip irrigation (RGS) faces several technical problems, including fine particle obstruction or clogging or by organic matter and damage by rodents (Payero et al., 2005).
According to Molden et al. (2010), there is a wide margin to improve water productivity in crops, with irrigation systems that can be implemented, such as supplementary irrigation, deficit irrigation, precision irrigation, hydroponic crops, aquaponics, irrigation with cover crops, greenhouses, soil-water conservation practices and underground irrigation. The application of organic residues or mulch-type covers, consisting of rice stubble on the soil surface where the drip hose is located, is satisfactory in grape crops and enhances the efficient use of water (Zhang et al., 2014).
Regarding RGS, Ayars et al. (1999), after 15 years of research, report a significant increase in yield and efficiency in the use of water in cotton, maize and melon. In addition, the same system maintains soil surface dry, which contributes significantly to the control of arable plants, reduces NO3 leaching compared to surface irrigation and higher yields are obtained because water and nutrients reach the most active root zone part (Thompson et al., 2009). According to Camp et al. (1993), the installation of micro-irrigation hoses under the tillage area and with wide spacing makes the additional irrigation of vegetables more profitable. In Brazil, Dos Santos et al. (2016) conducted an experiment in sugarcane cultivation with underground irrigation systems where the irrigation line was 0.20 and 0.40 m deep; this RGS system installed at 0.20 m provided the best moisture content conditions in the soil layers, which favors an adequate balance of water and oxygen in the roots. In Mexico, an underground irrigation system saved 27.4 % of irrigation water, compared to a surface one (Montemayor et al., 2006).
On this account and based on the results of the aforementioned researches, the objective of our study was to evaluate the amount of water that is lost by evaporation in three irrigation systems, two of them through surface irrigation and an underground irrigation system.
Materials and Methods
Description of the experimental site
The experiment was conducted at the Experimental Agricultural Field of the Center for Biological Research of Northwest Mexico (CIBNOR) in the Comitán, Baja California Sur, Mexico, 17 km west of the City of La Paz, at 24° 8’ 9.47” N, and 110° 25’ 41.35” W. The experiment was performed in two periods at the same site; the first was from 24 to 29 September 2015 and the second from 18 to 23 January 2016. Three open field irrigation systems (Montemayor et al., 2006) were used to evaluate the direct evaporation of bare soil with two surface systems and one underground. The experimental design was completely randomized set in strips, with three treatments and three replicates, where each repetition corresponds to 1 m length. The separation between irrigation systems was 2 m and between replicates 1 m (Figure 1).
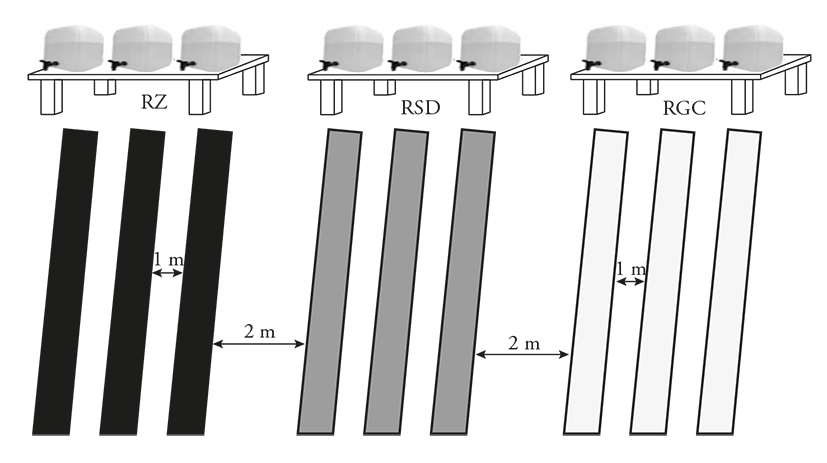
Figure 1 Spatial installation sketch of three irrigation systems in the Experimental Field of the Center for Biological Research of Northwest Mexico; La Paz, Baja California Sur, Mexico.
Climate of the study area
The climate is arid, the climatic classification according to García (2004) is BW (h’) w, which corresponds to a very dry and warm climate, with rains in summer. Climatic conditions indicate a maximum monthly temperature of 39.8 °C in August, minimum of 11.2 °C in January and annual average of 23.7 °C; the maximum monthly evaporation potential is 248.3 mm in July, minimum 96.0 in December and annual accumulated 2,084.5 mm. The total annual precipitation is 169.2 mm, with maximum 37.2 and 58.4 mm in August and September, respectively (SMN, 2016).
Installation of irrigation systems
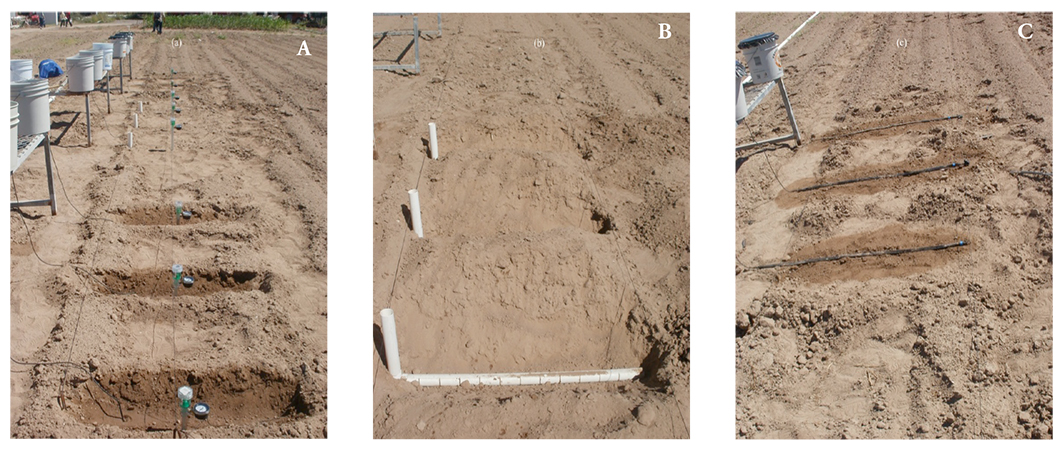
The separation between irrigation lines or emitters was 1 m and the separation between the irrigation systems was 2 m. Irrigation was provided by adding water to a reservoir installed on a platform placed 1 m high, from where it was distributed through a hose connected to each emitter. Figure 2 shows the three systems after the first irrigation.
Irrigation located in ditches (RZ)
The first irrigation system was 1 m of trench or groove with a 0.5 % slope; the interior of the trench was traced in the form of a triangle with slopes of 19.6 cm, 5.0 cm strap and 38 cm at the top, which is the base of the triangle. Water was applied in the highest part of the trench by means of a micro-tube of black PVC of 3 mm in internal diameter and 5 mm in external diameter, which contributed a flow of 12 L h-1. The RZ system simulates the conventional drip irrigation applied with buttonhole drippers (independent drippers), in which farmers use a smooth hose of 16 to 20 mm in internal diameter where they place drippers with separations set by them, usually with 3 to 4 emitters per tree (Figure 2A).
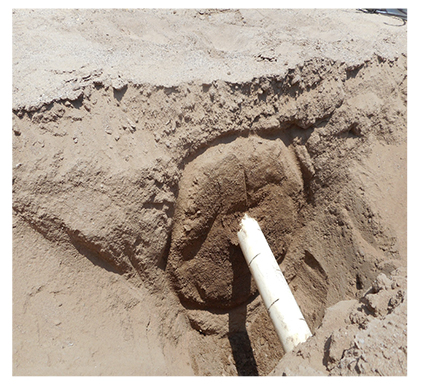
Underground irrigation by diffusers (RSD)
For the RSD irrigation system, a sanitary PVC pipe with a 5.08 cm inner diameter and 1 m length was placed horizontally at 20 cm depth. At one end of the tube we placed a plug with a vertical 4 cm slot, and on the other end a 90° sanitary elbow of the same diameter was attached to connect the underground section of the horizontal diffuser with the soil surface and the atmosphere by means of a tube segment 30 cm long of the same type and diameter. Through the exposed diffuser segment water was supplied through a 3 mm inner diameter tube (Figure 2B). The horizontal segment of the diffuser was 1 m long and had 4 cm slots every 8.2 cm on both sides, so that when placed on the floor the slots are exposed vertically; from the hydraulic point of view, the lower part of the tube functions as a channel. For its operation, the interior of the tube is filled with gravel of 3 to 7 mm in diameter to favor the water flow and prevent the entrance of fine soil particles to the diffuser. The RSD system is compared to conventional irrigation systems to show its advantages on minimizing direct soil evaporation.
Drip irrigation with tape (RGC)
The third irrigation system (RGC) was a segment of 1 m of Netafim® model streamline tape 16060 with drippers every 20 cm made for a maximum flow of 1.1 L h-1. The dropper flow rate was calibrated at 0.40 L h-1, lower than the nominal flow rate because the pressure provided to the irrigation belt was 1 m of water column (MCA) equivalent to 0.1 kg cm-2 (1.42 PSI), which is less than the nominal pressure, indicated in 10 MCA. This method simulates the system of drip irrigation with tape, which is the most used by farmers who have pressurized irrigation, who use tapes or hose with drippers installed equidistantly (Figure 2C).
In order to relate the direct water evaporation of the soil with the elements of the climate, we recorded data of ambient temperature, soil and potential evaporation (Eo) with type “A” evaporimeter in both periods of the experiment. The climate data were obtained from a Davis® automatic weather station model Vantage Pro2 (USA), installed in the Experimental Agricultural Field of CIBNOR. Soil temperature was taken with a Yokogawa® portable digital thermometer model 2455 (Japan); this instrument has an electronic device that interprets the signal emitted by a thermocouple type sensor supported by a stainless steel rod of 4.8 mm in diameter. After installing the irrigation systems, irrigation of 10 L m-1 was applied to moisten the soil at field capacity (CC); when considering a distance of one meter between furrows, this unit volume corresponds to an irrigation sheet of 10 mm (equivalent to 100 m3 ha-1). The first soil sample was taken 15 min after irrigation and the second sample was taken 24 h later. At the end of the second sampling, two additional samplings were performed every two days, for a total of four samplings. This process was similar on both dates, September 2015 and January 2016.
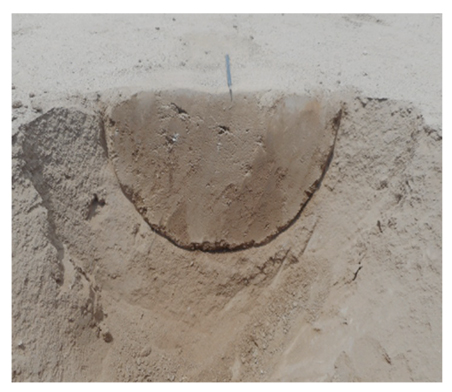
Soil sampling
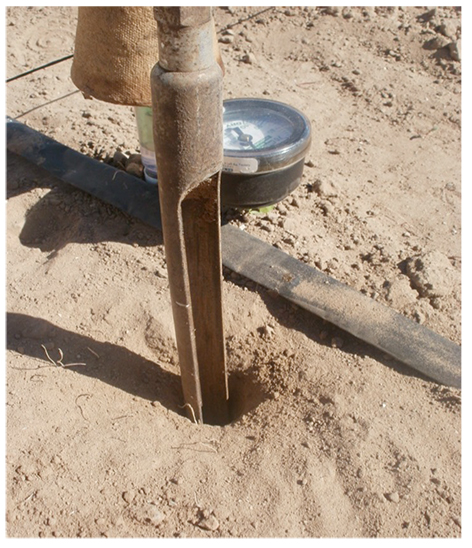
To take soil samples, a half-auger bit (Figure 3) was used to extract a 2.5 cm diameter soil core, which allows the sample to be separated into 5 cm fractions; each section of the sample was placed in a heavy, labeled glass jar. Each sampling was performed at depths of 0 to 5, 5 to 10, 10 to 15 and 15 to 20 cm to determine the moisture content; 4 samples were obtained per replicate and 12 samples per treatment, for a total of 36 samples per sampling date. After each sampling, the moisture content of each sample was obtained by means of the gravimetric method, which consists of weighing the wet sample, drying it in an oven for 24 h at 105° C, weighing the dry sample and obtaining the humidity percentage taking as reference the weight of dry soil. Through this process we determined the percentage of humidity of each system of irrigation and repetition.
Soil caracterization
The soil texture was determined using the Horiba (Japan) laser analyzer according to the grain size method described by Lewis (1984); the organic matter (OM) was quantified using the AS-07 method of the Official Mexican Standard NOM-021-SEMARNAT-2000 (DOF, 2002), according to Walkley and Black (1934); the pH was determined using the AS-02 method, and electrical conductivity (EC) by the AS-18 method of the aforementioned NOM. The field capacity (FC), permanent wilt point (PMP), and bulk density (Da) were determined according to the methods suggested by Ortiz-Villanueva and Ortiz-Solorio (1990).
Determination of soil moisture
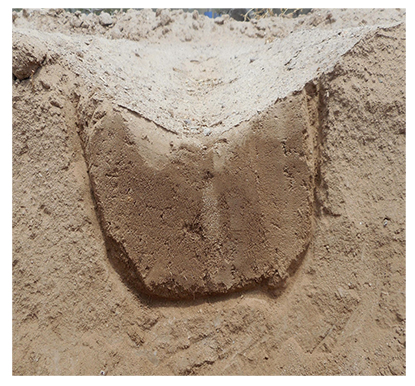
The water content expressed as L per depth for each irrigation system was calculated from the soil moisture and bulk density percentage data. To this end, we took into account the wet bulb shape (Figures 4, 5 and 6). The images were digitized with the measurements made in the field, for which we used the program Autocad 2005 (Yarwood, 2005). Whith these images we obtained a graph of contour of the humid bulb fractionated by air of equal humidity percentage.
Statistical analysis
The moisture loss data were statistically analyzed using the Excel 2007 program and we used the one-way ANDEVA with the PAST program (Hammer, 2001). The differences between means of treatments were determined using the least significant difference (DMS) with p≤0.01 and p≤0.05.
Results and Discussion
The soil of the study area is of a sandy loamy texture, with 81.6, 17.5 and 0.9 % of sand, silt and clay. The 0 to 40 cm profile consists of a soil containing 0.7% OM, 8.8 alkaline pH, CE 0.4 dS m-1 and Da 1.40 g cm-3; the values of FC and PMP were 13 and 4%, respectively.
The potential evaporation (Eo) values for the first and second dates were 6.32 and 2.82 mm d-1, respectively. The soil moisture content expressed as a percentage is shown in Tables 1 and 2, where the results correspond to four depths and four dates for each experiment. The accumulated moisture loss in the periods observed appears at the bottom of each table. The evaporation of bare soil after the first irrigation occurred with greater intensity during the first 24 h and then gradually decreased (Figures 7 and 8).
Table 1 Percentage of soil moisture at each depth, irrigation system and date, with accumulated moisture loss; 24-29 September 2015l
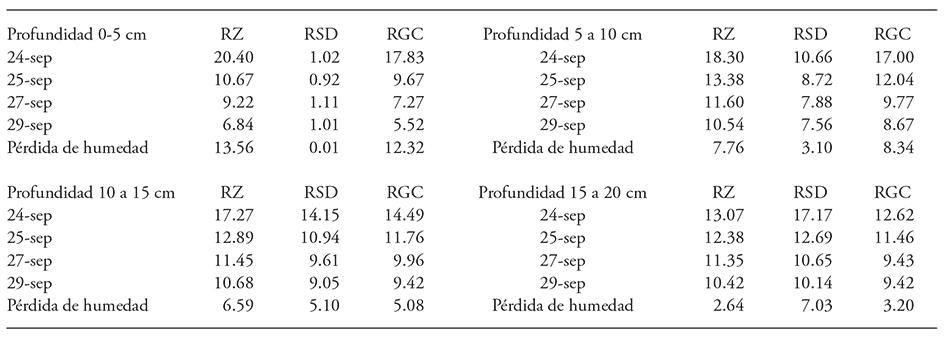
Table 2 Soil moisture content at each depth, treatment and date, with accumulated moisture loss; 18-23 January 2016.
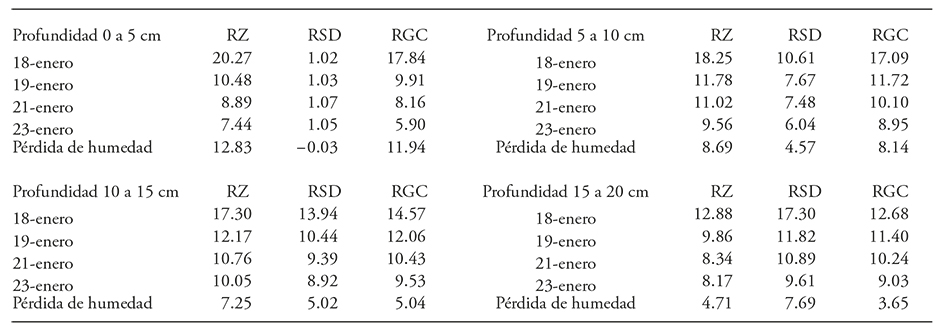
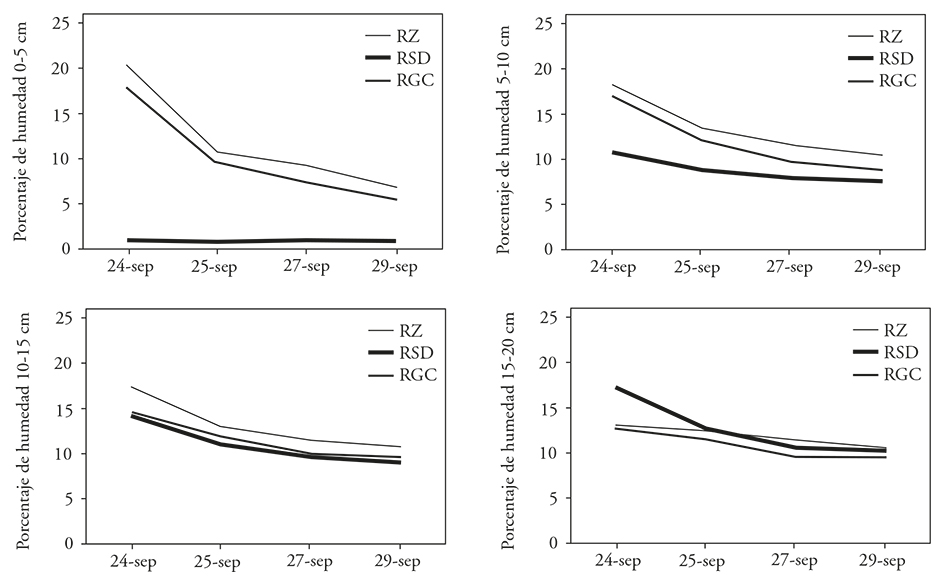
Figure 7 Percentage of soil moisture at four depths after applying 10 L per m in each experimental unit; 24-29 September 2015.
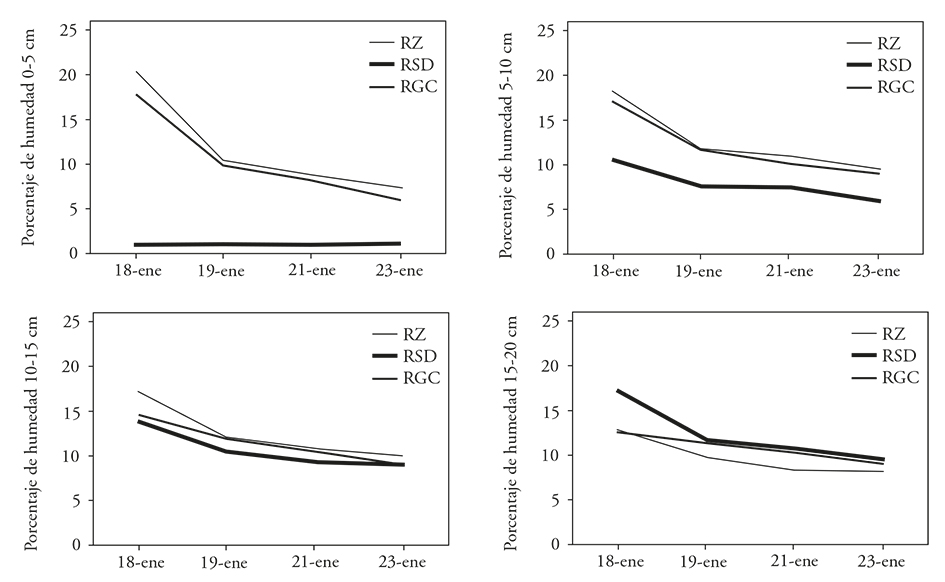
Figure 8 Percentage of moisture in the soil at four depths after applying 10 L per m in each experimental unit; 18-23 January 2016.
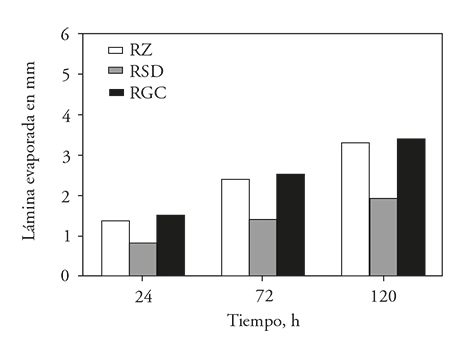
Because the wet bulb is dynamic, its geometric shape and moisture content gradually change as the soil loses water, so the images were different for each day of sampling. The evaporated sheet for each irrigation system evaluated during the experiment was calculated considering a distance between water lines of 1 m (Figures 9 and 10).
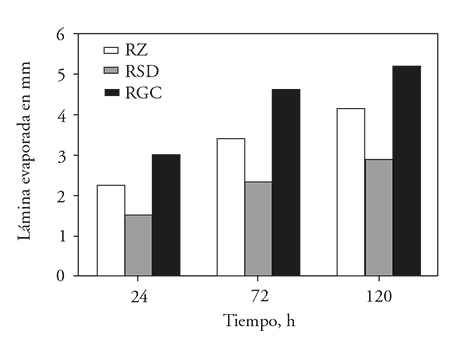
When estimating bare soil evaporation relative to potential evaporation taking as reference the wet bulb area, we found that evaporation was greater during the first 24 h after irrigation, which corresponds to 85 % of the potential evaporation in the RZ system, 50 % for RSD, and 90 % for RGC. In addition, the percentages were similar in both dates of the experiment (September 2015 and January 2016). When evaporation was expressed in m3 h-1 and considering a distance of 1 m between furrows for the period from 24 to 29 September 2015, we observed that during the first 24 h evaporation was 22.80 m3 ha-1 in the RZ system, 15.10 in RSD and 30.30 in RGC.
As the evaporation loss gradually decreased until the last day observed, the evaporation between day 4 and 5 after irrigation was 3.75 m3 ha-1 for RZ, 2.95 for RSD and 3.10 for RGC. In the period from January 18 to 23, 2016, during the first 24 h after irrigation, evaporation was 13.3 m3 ha-1 in RZ, 8.0 in RSD and 14.5 in SRG. Then the evaporation loss for the last day observed between day 4 and 5 after irrigation was 4.45 m3 ha-1 for RZ, 2.50 for RSD and 4.40 for RGC, which is shown in Table 3.
Table 3 Loss from direct evaporation of bare soil with three irrigation systems after an irrigation of 10 L m-1 equivalent to 100 m3 ha-1
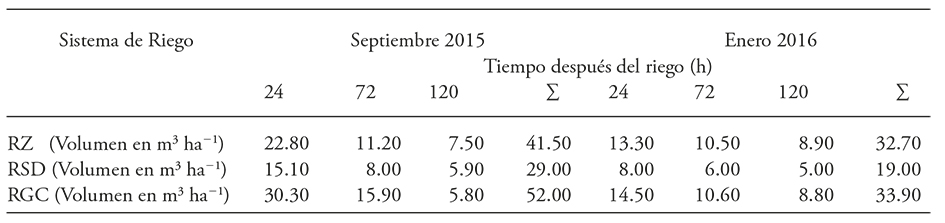
In all cases evaporative loss was lower in RSD; the difference between RSD and RZ was 30 % in September 2015 and 41 % in January 2016. The difference between RSD and RGC was 44 %, and the result was similar in both periods of experimentation. These data are similar to those by Meshkat et al. (2000), who compared the RGC with an underground drip system that consisted of placing a tube in the soil, removing the core of soil and filling it with coarse sand, which allowed to place the water under the surface, and the evaporation difference between the surface and underground systems was 39.8 %. Montemayor et al. (2006) used forage maize to compare irrigation by surface and underground drip irrigation and found that underground irrigation allows to save 27.4 %. This result is lower than that found in our research and also that reported by Meshkat et al. (2000). This difference can be due to the fact that maize cultivation casts shade on the soil surface, which favors the reduction of direct evaporation of the soil, a more marked effect in the last stages of cultivation. Godoy et al. (2005) compared underground drip irrigation with 6 sides for each line of trees against gravity irrigation (flood) in walnut pecan, in Matamoros, Coahuila, and reported a 30.6 % saving of water volume compared to the underground system.
The distribution of water in the layered soil profile is shown in Figures 11 and 12 for each irrigation system during the period observed (120 h after irrigation). The highest amount of water in the soil was deposited in the first layers, from 0 to 10 cm, in the surface systems, and 10 to 30 cm deep in the underground system. The layered water distribution can explain the evaporation difference between the surface systems and the underground supply system because in the underground water is less exposed to the climate elements and more sheltered. The location and size of the wet bulb of the RSD is greater with respect to the surface systems, since the movement of the water in the soil is radial, reason why the bulb is of greater volume but with less content of humidity with the same amount of water, which makes the soil achieve a better balance between water and oxygen for cultivation.
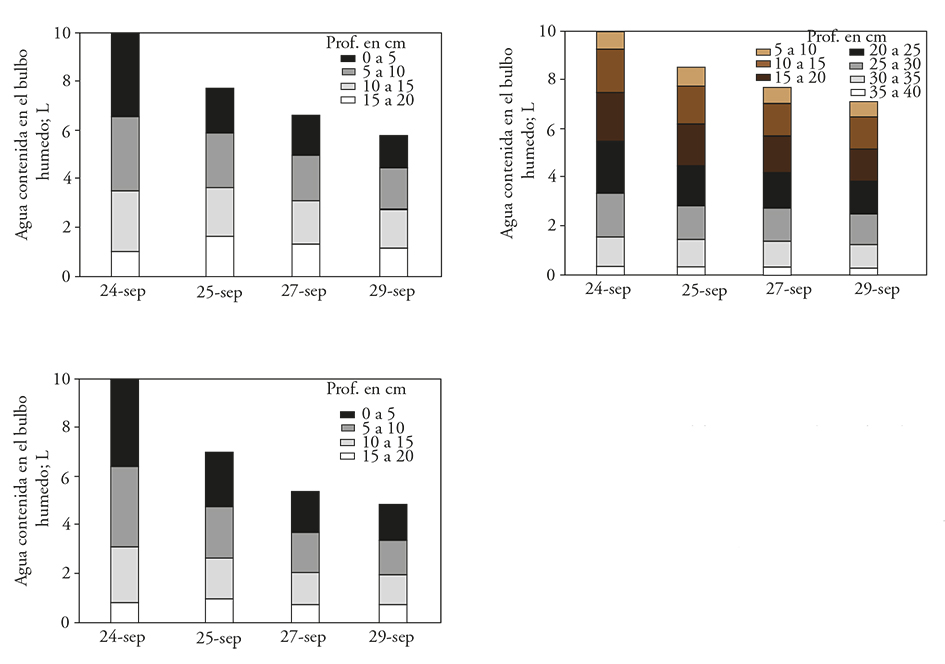
Figure 11. Distribution of water contained in the soil by measuring depth levels in three irrigation systems, September 2015. A: RZ; B: RSD; C: RGC.
Statistical analysis
The moisture loss was calculated by the difference between the first and last samples of each layer from the original data. The data were grouped by layers, forming four groups, and for the statistical analysis we considered the data of the three replicates for each treatment. Soil moisture data were analyzed by depth (0-5, 5-10, 10-15 and 15-20 cm). We applied the Barlett’s normality test to the four data groups and found they corresponded to a normal population, whereby the null hypothesis (Ho) of similarity of variance was accepted for all the groups analyzed. After this test, the data were analyzed with Excel and the sum of total squares and the sum of squares of treatments were calculated. With this information the single-track ANDEVA were performed with p≤0.05 and p≤0.01 and means were compared with DMS (p≤0.05 and p≤0.01) (Tables 4 y 5).
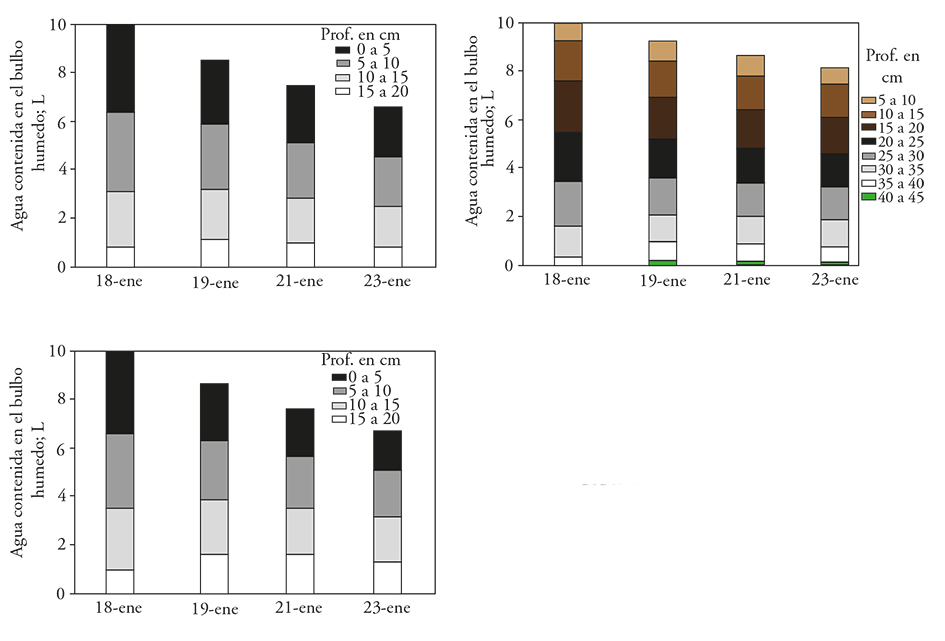
Figure 12. Distribution of water contained in the soil by depth in three irrigation systems, January 2016. A: RZ; B: RSD; C: RGC.
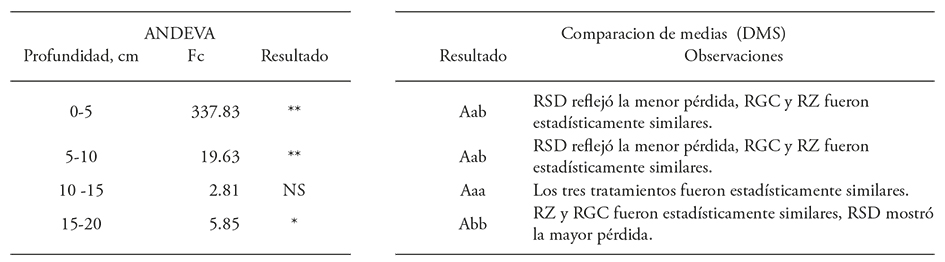
Table 4 Summary of ANDEVA and comparison of means of humidity loss; period from 24 to 29 September 2015
*p≤0.05; **p≤0.01
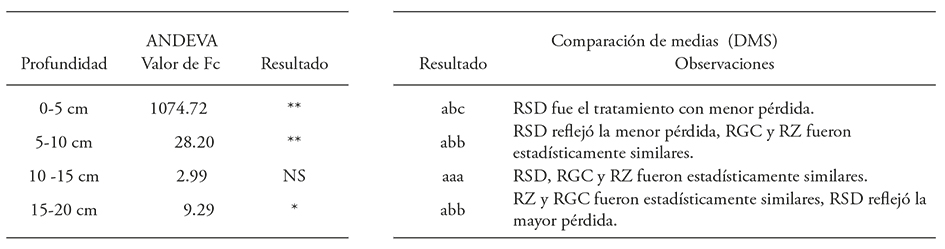
Table 5 Summary of ANDEVA and comparison of means of humidity loss; period from 18 to 23 January 2016.
*p≤0.05; **p≤0.01
For the period September 2015, from 0 to 5 cm the differences were highly significant (p≤0.01): the treatment with less evaporation was RSD and the one with the highest evaporation was RZ. From 5 to 10 cm the differences were also highly significant (p≤0.01): the treatment with lower evaporation was RSD, while RZ was similar to RGC (p> 005). From 10 to 15 cm, the results were similar (p>005). From 15 to 20 cm the results showed significant differences (p≤0.05), where RZ and RGC had less evaporation, but similar to each other (p>0.05), and irrigation with greater loss was RSD (p≤0.05).
In January 2016, at 0 to 5 cm deep the results showed highly significant differences (p≤0.01): the treatment with lower evaporation was RSD, and RZ was similar to RGC (p>0.05). From 5 to 10 cm there was a significant difference (p≤0.01), and the treatment with lower evaporation was RSD, while RZ was statistically similar to RGC. In turn, from 10 to 15 cm the three systems were similar (p>0.05). In contrast, from 15 to 20 cm deep there were significant differences (p≤0.05), and the systems with lower evaporation and statistically similar were RZ and RGC, while the larger loss was observed in RSD.
Allen et al. (2006) estimated losses by direct soil evaporation of 28.95 % of the total volume of water for perennial crop irrigation, according to the annual quantitative distribution of evapotranspiration, according to FAO (2007). As an example, when applying the results obtained in the three irrigation systems in a crop that requires 7000 m3 ha-1 in a year, the estimated soil evaporation losses would be 2026.5 m3. In this case, on considering a contribution of 7000 m3 ha-1 calculated for an RGC system, the RSD and RZ systems would require 6106 and 6712 m3, with an estimated water saving of 44 % for RSD and 14 % for RZ in relation to the fraction of the water lost by direct evaporation of the soil.
Soil temperature
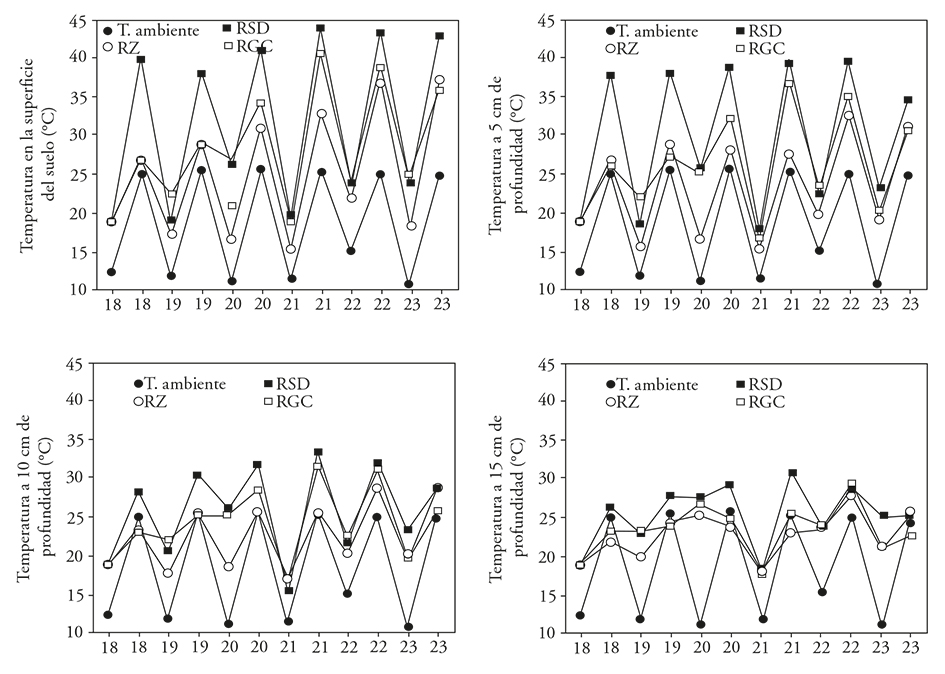
During the experiment, we measured soil temperature in irrigation systems at three depths (5, 10 and 15 cm) and ambient temperatures (maximum and minimum) for each day at 8:30 AM and 2:00 PM. The maximum and minimum environmental values were 36.1 and 24.9 °C in September 2015, which fell to 26.2 and 10.4 °C in January 2016; in both periods the maximum temperature was observed from 14:00 to 16:00 h (Figures 13 and 14). The variation of soil temperature at different depths reflected a trend similar to the moisture content in them. In September 2015, the highest soil surface temperature (57.7 °C) was observed in RSD and the lowest (44.1 °C) in RZ, which is expected because of the humidity provided by this system, and RGC showed an intermediate value ( 51.9 °C); at 5 cm deep temperature was higher in RGC (47.4 °C) than in RSD (46.5 °C) and RZ (35.0 °C). At 10 cm the soil temperature difference between systems decreased markedly, and the maximum (35.1 °C) was observed in RGC and the minimum (32.0 °C) in RZ. Similarly, at 15 cm RGC showed the maximum (32.6 °C) and RZ the minimum (29.3 °C). At both depths of 10 and 15 cm, RSD showed intermediate values (33.9 and 32.2 °C). In January 2016 RSD had the maximum in surface (42.8 °C) and at 5 cm deep (34.9 °C), where RZ and RGC recorded similar temperatures. At 10 and 15 cm the soil temperature differences between the three systems reduced considerably: RSD and RZ recorded similar temperatures, averages of 28.9 and 125.0 °C, and RGC had minimum temperatures of 25.9 and 22.4 °C.
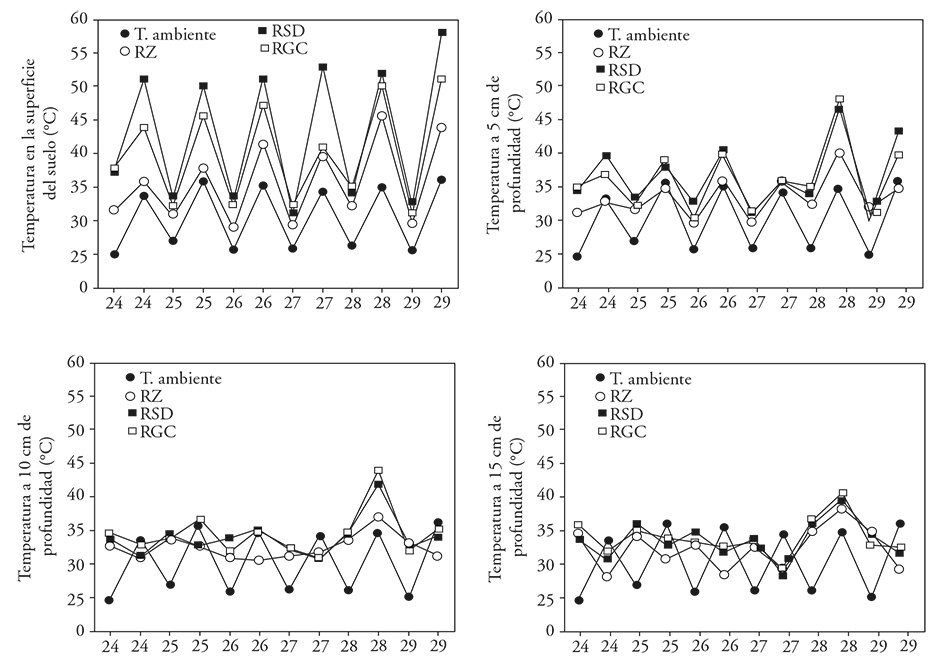
Soil temperature is important as an indicator of the soil moisture content and the amount of water the soil gives to the atmosphere. In a 12-hectare vineyard irrigated with surface drip irrigation, Kerridge et al. (2013) compared the temperature of the soil surface between rows (dry soil) and within rows of plants (wet soil) by means of a method used for estimating soil evaporation. This method is based on a linear function of the temperature change of the soil surface; they concluded that the application of soil surface temperature is a promising method to estimate the direct evaporation of the soil through the use of permanent sensors distributed in the vineyard for the systematic recording of daily data.
Conclusions
When comparing the three irrigation systems, the evaporation of the underground irrigation by diffusers was the smallest, and the difference is considerable in the loss of water by evaporation of bare soil between underground irrigation and surface systems. The greatest difference in temperature was in the depths of 0 to 10 cm in the surface systems compared to the underground irrigation, which confirms the results because with greater evaporation the change of temperature is bigger. Our study shows a clear advantage of underground irrigation over conventional drip irrigation for water conservation in arid zone agricultural systems
Acknowledgements
The authors thank CONACYT for the doctoral scholarship awarded to the first author; CONAGUA-CONACYT Fund for the financial support through the project 0249265 in 2014; the staff of the Laboratory of Irrigation, Álvaro González, Juan E. Vega and Arturo Cruz; of Soils, Manuel S. Trasviña; Plant Physiotechnology, Lidia Hirales and Carmen Mercado; likewise, technicians of the Experimental Field, Adrián Jordán, Raymundo Ceseña, Pedro Luna and Saúl Briseño, for their fruitful collaboration
REFERENCES
Allen, R. G., L. S. Pereira, D. Raes, y M. Smith. 2006. Evapotranspiración del cultivo - Guías para la determinación de los requerimientos de agua de los cultivos. Organización de las Naciones Unidas para la Agricultura y la Alimentación (FAO). Roma, Italia. 298 p. [ Links ]
Ayars, J. E., C. J. Phene, R. B. Hutmacher, K. R. Davis, R. A. Schoneman, S. S. Vail, and R. M. Mead. 1999. Subsurface drip irrigation of row crops: a review of 15 years of research at the Water Management Research Laboratory. Agric. Water Manage. 42: 1-27. [ Links ]
Ayars, J.E., A. Fulton, and B. Taylor. 2015. Subsurface drip irrigation in California - Here to stay?. Agric. Water Manage . 157: 39-47. [ Links ]
Camp, C.R., J. T. Garrett, E. J. Sadler, and W. J. Busscher. 1993. Microirrigation management for double-cropped vegetables in a humid area. Trans. ASAE 36: 1639-1644. [ Links ]
DOF (Diario Oficial de la Federación). 2002. Norma Oficial Mexicana NOM-021-SEMARNAT-2000. Segunda Sección. 31 de diciembre de 2002. México, D.F. [ Links ]
Dos Santos, L.N., E.E. Matsura, I.Z. Goncalves, E.A.A.Barbosa , A.A.Nazário , N.F.Tuta, M.C.L.Elaiuy, D.R.C.Feitosa, and A.C.M. deSousa. 2016. Water storage in the soil profile under subsurface drip irrigation: Evaluating two installation depths of emitters and two water qualities. Agric. Water Manage . 170: 91-98. [ Links ]
FAO (Food And Agriculture Organization of The United Nations). 2007. Information System on Water and Agriculture - Aquastat. 263 p. [ Links ]
García, E. 2004. Modificaciones al sistema de clasificación climática de Köppen. Instituto de Geografía, Universidad Nacional Autónoma de México. Quinta edición. México, D.F. 91 pp. [ Links ]
Godoy A., C., I. Reyes J., y C. A. Torres E. 2005. Riego por goteo subsuperficial en nogal pecanero (Carya illinoensis K.) con diferente número de laterales de riego. Agric. Téc. Méx. 31: 203-212. [ Links ]
Hammer, Ø., D. A. T. Harper, and P. D. Ryan. 2001. PAST: Paleontological statistics software package for education and data analysis. Palaeontologia Electronica 4(1): 9pp. http://palaeo-electronica.org/2001_1/past/issue1_01.htm [ Links ]
Kerridge, B.L., J.W. Hornbuckle, E.W. Christen E., and R.D. Faulkner. 2013. Using soilsurface temperature to assess soil evaporation in a drip irrigated vineyard. Agric. Water Manage . 116: 128-141. [ Links ]
Lewis, D.W. 1984. Practical Sedimentology. Edit. Van Nostrand Reinhold Company Inc. New York, USA. 217 p. [ Links ]
Meshkat, M., R.C.Warner, and S.R.Workman. 2000. Evaporation reduction potential in an undisturbed soil irrigated with surface drip and sand tube irrigation. Trans. ASAE 43: 79-86. [ Links ]
Molden, D., T. Oweis, P. Steduto, P. Bindraban, M. A. Hanjra, and J. Kijne. 2010. Improving agricultural water productivity: Between optimism and caution. Agric. Water Manage . 97: 528-535. [ Links ]
Montemayor T., J. A., J. L. Lara M., J. L. Woo R., J. Munguía L., M. Rivera G., y R. Trucíos C. 2012. Producción de maíz forrajero (Zea mays L.) en tres sistemas de irrigación en la Comarca Lagunera de Coahuila y Durango, México. Agrociencia 46: 267-278. [ Links ]
Montemayor T., J. A., A. O. Gómez M., J. Olague R., A. Zermeño G., E. Ruiz C., M. Fortis H., E. Salazar S. y R. Aldaco N. 2006. Efecto de tres profundidades de cinta de riego por goteo en la eficiencia de uso de agua y en el rendimiento de maíz forrajero. Téc. Pecu. Méx. 44: 359-364. [ Links ]
Ortiz V., B. y C. A. Ortiz. 1990. Edafología. Edit. Universidad Autónoma Chapingo. 7ª Edición. Texcoco, Estado de México. México. 394 p. [ Links ]
Safi, B., M. R. Neyshabouri, A. H. Nazemi, S. Massiha, and S. M. Mirlatifi. 2007. Water application uniformity of a subsurface drip irrigation system at various operating pressures and tape lengths. Turk. J. Agric. For. 31 (2007): 275-285. [ Links ]
SMN (Servicio Meteorológico Nacional). 2016. Normales Climatológicas - Baja California Sur. Servicio Meteorológico Nacional. http://smn1.conagua.gob.mx/index.php?option=com_content&view=article&id=162&tmpl=component . (Consulta: Noviembre 2016). [ Links ]
Thompson, T. L., P. Huan-cheng, and L. I. Yu-yi. 2009. The Potential Contribution of Subsurface Drip Irrigation to Water-Saving Agriculture in the Western USA. Agric. Sci. China 8: 850-854. [ Links ]
Walkley, A., and I. A. Black. 1934. An examination of Degtjareff method for determining soil organic matter and a proposed modification of the chromic acid titration method. Soil Sci. 37:29-37. [ Links ]
Yarwood, A . 2005. Introduction to AutoCAD 2005: 2D and 3D Design. Ed. Elsevier. Linacre House, Jordan Hill, Oxford OX2 8DP. UK. 321 p. [ Links ]
Zhang, Q., S. Wang, L. Li., M. Inoue, J. Xiang, G. Qiu, and W. Jin. 2014. Effects of mulching and sub-surface irrigation on vine growth, berry sugar content and water use of grapevines. Agric. Water Manage . 143: 1-8. [ Links ]
Received: August 2016; Accepted: December 2016
 Este es un artículo publicado en acceso abierto bajo una licencia Creative Commons
