


Services on Demand
Journal
Article
 text in
  English (pdf)
 Article in xml format
 Article references
 Send this article by e-mail
Indicators
-
 Cited by SciELO
 -
 Access statistics
Related links
-
 Similars in
SciELO
Similars in
SciELO
Share

 Permalink
Agrociencia
On-line version ISSN 2521-9766Print version ISSN 1405-3195
Agrociencia vol.51 n.4 Texcoco May./Jun. 2017
Natural renewable resources
Explicit and implicit timber growth projection of Pinus patula Schiede ex Schltdl. et Cham. in commercial plantations
1Instituto Tecnológico Superior de Venustiano Carranza. Avenida Tecnológico SN, Colonia El Huasteco, Venustiano Carranza, Puebla. 73049.
2Postgrado en Ciencias Forestales. Colegio de Postgraduados, Campus Montecillo. 56230. Montecillo, Estado de México. hmsantos@colpos.mx
3División Ciencias Forestales. Universidad Autónoma Chapingo. 56230.
In Zacualpan, Veracruz, Mexico, there are 3500 ha of commercial forest plantations of Pinus patula, but until now no evaluations of growth have been made that would allow an adequate programming of harvest. The objective of the present study was to evaluate growth and yield of timber, using an explicit and an implicit system with diametric distribution, both constructed with data of permanent forestry measurement plots. The hypothesis proposes that permanent observation plots, of different ages re-measured over time, will make it possible to obtain an explicit and implicit projected system of timber growth and yield. The first system is comprised of the polymorphic Schumacher-Korf type non-linear model in dominant height, of compatible equations of prediction-projection for basal area, total volume and mortality. The explicit system utilizes the Weibull probability distribution function of three parameters. For this study 50 sites of 400 m2 were randomly selected, distributed in age classes of three to 21 years, which were established in 2011 and were re-measured in 2012 and 2015. Results showed four site indices (SI): 10, 15, 20 and 25 m at the base age of 15 years. The technical rotation in volume for the average condition (SI of 20 m) was at 14 years, age at which 251 m3 ha-1 are produced as expected total volume and a mean yield of 17.9 m3 ha-1 year-1. The diametric distribution projected a total volume of 242 m3 ha-1 at the age of technical rotation, and also made it possible to know that the proportion of trees with normal diameter -30 cm is presented prior to 10 years in rich sites and afterwards is incremented exponentially.
Key words: site index; diametric class; Weibull; yield
En Zacualpan, Veracruz, México, existen 3,500 ha de plantaciones forestales comerciales de Pinus patula, pero hasta el momento no se han realizado evaluaciones de crecimiento que permitan programar adecuadamente la cosecha. El objetivo del estudio fue evaluar el crecimiento y rendimiento maderable, compuesto por un sistema explícito y uno implícito con distribución diamétrica, ambos construidos con datos de parcelas permanentes de medición forestal. La hipótesis propone que parcelas de observación permanente, de diferentes edades entre ellas y remedidas en el tiempo, permitirán obtener un sistema de crecimiento y rendimiento maderable proyectado en forma explícita e implícita. El primer sistema consta del modelo no lineal en altura dominante tipo Schumacher-Korf polimórfico y de ecuaciones compatibles de predicción - proyección para área basal, volumen total y mortalidad. El sistema implícito utilizó la función de la distribución de probabilidad Weibull de tres parámetros. Para el estudio se eligieron al azar 50 sitios de 400 m2 cada uno, distribuidos en clases de edad de tres hasta 21 años, se establecieron en el 2011 y se remidieron en 2012 y 2015. Los resultados mostraron cuatro índices de sitio (IS): 10, 15, 20 y 25 m a la edad base de 15 años. El turno técnico en volumen para la condición promedio (IS de 20 m) fue de 14 años, edad a la que se producen 251 m3 ha-1 como volumen total esperado y un rendimiento medio de 17.9 m3 ha-1 año-1. La distribución diamétrica proyectó un volumen total de 242 m3 ha-1 a la edad del turno técnico y, además, permitió conocer que la proporción de árboles con diámetro normal -30 cm se presenta antes de los 10 años en sitios ricos y después se incrementa exponencialmente.
Palabras clave: índice de sitio; clase diamétrica; Weibull; rendimiento
Introduction
Timber yield projection over time makes it possible to plan forest management, especially with intensive forest production. The projection models are useful in projects of commercial forest plantations, to establish the valuation over time and foresee the supply in each market (Clutter et al., 1983; Burkhart and Tomé, 2012).
The firm Agroproductores Forestales de Zacualpan, S. P. R. de R. L. has established 3500 ha in 15 years. At first the purpose was to restore degraded areas, and later the objective was to convert them to commercial forestry plantations. Presently there is no quantitative information in the Zacualpan region for efficient forest management, and forestry activities are carried out based on day to day experience. Furthermore, the local market of timber products is based on a diameter size selection, thus it is important to have a robust projection system that will make it possible to make opportune decisions.
To model the BA, mathematical structures are used, influenced by dominant height (A), the number of trees per surface unit, the age (E) and on occasions the site index (SI) (Gonzalez-Benecke et al., 2012; Santiago-García et al., 2013). The variable number of residual trees (NA) is explained as a function of the age (E) (Rose et al., 2004), along with state indicators of the site. In addition, the volume (V) can be explained by considering as independent variables the basal area, dominant height of site index and age (Magaña et al., 2008).
The systems of timber growth and yield (SCRM) are explicit or implicit. An explicit system can be fitted simultaneously or individually, and the implicit system is a complement of the explicit system and makes it possible to estimate state-variables by diameter class in a dynamic form (Torres-Rojo et al., 1992). Both procedures are good, and this will depend on the species, place and type of data used for the fitting.
The function used for the implicit system is the Weibull model of three parameters (Weibull 3P). This was implemented to project stand conditions in Pinus rudis (Magaña et al., 2008), P. patula (Santiago-García et al., 2014) and P. arizonica, P. duranguensis, P. teocote, P. leiophylla, P. lumholtzii, P. ayacahuite (Quiñonez et al., 2015a). In other studies distribution models are used such as that of Burr, logistic distribution, and free percentiles or tabulated stand projection (Stand-Table-Projection) (Borders et al., 1987; Knowe et al., 1997; Lindsay et al., 1996; Wang and Rennolls, 2005).
The percentiles method is used to predict the parameters of the Weibull 3P model (location, scale and form) and to describe the distribution of the diametric categories. The percentile utilizes as dependent variable the mean square diameter (Dq, cm) (Torres-Rojo et al., 1992; Santiago-García et al., 2014; Quiñonez et al., 2015a).
The SCRMs are tools to program the harvest plan, supply of raw material to industry, implement thinning, estimate future economic income, and their uses have been expanded to quantify biomass and carbon (Clutter et al., 1983; Pienaar and Rheney, 1993, Galán et al., 2008).
The objective of the present study was to construct a dynamic SCRM that incorporates models of stand and diameter distribution. The hypothesis was that permanent observation plots re-measured over time describe the pattern of growth and yield, which integrated to probability density function makes it possible to project the timber volume by diameter class (Kiviste and Kiviste, 2009; Gonzalez-Benecke et al., 2012).
Materials and Methods
Study area and dasometric data
The study area pertains to the municipality of Zacualpan, Veracruz, Mexico (20° 25’ and 20° 31’ N, 98° 24’ and 98° 25’ W, with 1670 m altitude). The climate is temperate humid with an average temperature of 18 °C and mean annual rainfall of 1900 mm; soil is Feozem.
In 2011 50 permanent observation plots were established, which were re-measured in 2012. Of these, in 2015 14 cleared plots were found, 26 with partial mortality (intra-specific competition), seven with total use and three with total death of the plants by dominance of weeds. The plots are square, 20x20 m (400 m2). In each period normal diameter of all of the trees was measured (DN in cm) and the height of the 5 dominant trees (A in m) and the age of the plantation was measured (E in years).
The state-variables by hectare were: average dominant height (A, m), total volume (V, m3), squared diameter (Dq, cm), basal area (AB, m2) and number of residual trees (NA), all referred to the site index (SI) as criteria for classifying the site quality (Clutter et al., 1983).
Explicit growth system
The explicit SCRM was structured by integrating models of prediction and projection for the variables A, AB, V and NA). The results were models of estimating future yield per hectare and by station quality determined through a site index (Clutter et al., 1983; Burkhart and Tomé, 2012). The construction of the system initiated with the selection of a generic model for dominant height and afterwards using the algebraic difference method (ADA) a future condition was derived as a function of an initial situation (Pienaar and Rheney, 1993; Jordan et al., 2006). Dominant height was fitted with non-linear regression independently and the AB, V and NA as a compatible system (Santiago-García et al., 2013).
Dominant height
In the fitting of the models in dominant height (A) and site index (SI) 76 pairs of non-overlapping data were used that correspond to the average of the dominant heights with their ages, which varied from 3 to 21 years. From the prediction model, the models of projection and site index were derived. The algebraic difference method (ADA) generates families of anamorphic and polymorphic curves of the form A 2 = f (A 1, E 1, E 2, β) where: A 2 is the projected dominant height or site index at age E 2 (projection age), A 1 is dominant height (at a base age of 15 years) measured at the initial age (E 1) and β is the vector of regression parameters (De los Santos-Posadas et al., 2006; Quiñonez-Barraza et al., 2015). The expression of Schumacher-Korf was used in its form of guide curve (1) and polymorphic-2 (2) with growth hypothesis in the parameter α2 of the generic model (1) (Schumacher, 1939).
 (1)
(1)
 (2)
(2)
where A: dominant height of prediction, A1: dominant height at the initial age, A 2: dominant height at the projected age, α0, α1, α2: regression parameters, E1: Initial age or base age (15 years), E 2: Projection age, e: exponential function and ln: Napierian logarithm.
Basal area
Twenty four permanent observation plots were segregated from the sample of 2015 due to thinning, definitive cuts or total death. A total of 73 pairs of non overlapping data were used for the fitting of the basal area, volume and number of trees per hectare. The proposed model of basal area (3) is a function dependent on the dominant height, age and number of trees per hectare. With this expression the model (4) was generated for estimating the basal area at the projected age (AB 2) (Gonzalez-Benecke et al., 2012). The expressions are as follows:
 (3)
(3)
 (4)
(4)
where AB1, A1, E1, NA2: basal area, dominant height, age and number of trees per ha at the initial age, AB2, A2, E2, NA 2: basal area, dominant height, age and number of trees per ha at the projected age and β0, β1, β2, β3: parameters to be estimated.
Volume
For the volume the pair of equations (5 and 6) was used which describe the volume of prediction and of projection, respectively:
 (5)
(5)
 (6)
(6)
where V1, AB1, A1, are volume, basal area and dominant height in their initial condition, V2, AB2, A2: volume, basal area and dominant height in the projected condition and γ0, γ1, γ2: parameters to be estimated.
Number of residual trees
Outstanding in the model for the number of residual trees, is a parameter that represents the mortality rate (ω1); this parameter multiplies at the age of reference. The survival can be expressed in terms of prediction (7) and projection (8) in the following form:
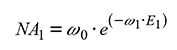 (7)
(7)
 (8)
(8)
where NA1 , E1, NA2, E 2: Number of trees per ha and age in the initial and projected condition, respectively and ω1, ω2: parameters of the regression.
System of implicit growth using the fdp Weibull
Weibull (1951) published a probability density function (fdp) and its power is such that it has even been widely applied in dasonomy (Villaseñor-Alba and Villanueva-Morales, 2000). To fit the Weibull function and model the distribution of diameter classes there are methods such as that of linear and non-linear regression, percentiles and maximum likelihood (Torres-Rojo et al., 1992; Torres-Rojo et al., 2000). The method of estimation of parameters through percentiles has shown good results (Santiago-García et al., 2014).
The state-variables proposed were: basal area per hectare (AB, m2 ha-1) and mean squared diameter (Dq, cm) given by:
 (9)
(9)
The height of the unmeasured trees was obtained indirectly with the equation H i =0.880151xA 1.026997x(1-e (-1.075746xDN) ) that relates dominant height (A) and normal diameter (DN) to estimate the individual total height. Total tree height with bark was obtained with the Schumacher model: Vi=0.000114×DN 1.718158 ×H 0.939592 (Uranga-Valencia et al., 2015) where H=total tree height and DN its normal diameter. The proposed percentiles were as follows:
 (10)
(10)
 (11)
(11)
 (12)
(12)
where p0, p63, p95 correspond to the zero percentile, 63 and 95, Dq: mean squared diameter, AB: basal area and A: dominant height, φ0, φ1, φ2, ω0, ω1, ξ0, ξ1, ξ2 are the parameters to be estimated in the percentiles system. The Weibull 3P probabilities distribution function is given by the probabilistic function:
 (13)
(13)
(a≤x≤∞); =0, otherwise, where a is the parameter of location, b of scale and c of form. The function defines the value of probability density associated to a random variable, which for this study was normal diameter (x=DN) (Santiago-García et al., 2014). The accumulated distribution in its closed form is:
 (14)
(14)
(a≤x≤∞); =0, otherwise.
The values of the parameters b and c are positive, whereas a can be negative, zero or positive. However, in the modeling of distribution of diameter classes, a should not be negative (Clutter et al., 1983). Knowing the parameters, the density function for a given interval can be obtained with:
 (15)
(15)
where P is the proportion of trees of the assigned diametric class, L and U are the lower and upper limit of the diameter class respectively, e is the exponential function and X is the center of the diametric category.
The parameters were estimated by the moments method (Pienaar and Rheney, 1993), which has been tested with satisfactory results (Santiago-García et al., 2014; Quiñonez-Barraza et al., 2015b), utilizing the following equations:
Parameter a of location was determined with:
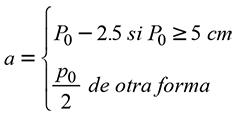 (16)
(16)
Parameter c is given by c=ln [((-ln(1-0.95))/(-ln(1-0.63)))/ln(p95-a)/p63-a))]. For the parameter b the following expression of the second moment of the Weibull distribution was used:
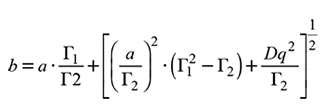 (17)
(17)
where Γ1= Γ(1+1/c), Γ2= Γ(1+2/c), Γ(.) is the Gamma function, the other variables were previously defined already.
Variables of state by diametric category
The number of trees per diametric class was obtained as follows: NA (CD) =P(L<X<U)xNAHA is the function of density of probability for the interval of this same category (CD) and NAHA: number of trees per hectare residuals at a determined age. The volume per hectare per diametric category was obtained with the expression V (CD) =NA (CD) xVi, where NA (CD) is the number of trees of the distribution of the diameter class.
Technique and test of goodness of fit
The fitting of the dominant height model and site index was done using non-linear progression with the MODEL procedure of the software SAS/ETS® (SAS, 2014). The coefficient of determination fitted by the number of parameters (R2 adj), the sum of squares of the error (SCE), the mean square of the error (CME), the level of significance of the parameters (Pr>|t|), and the logical modeling of the curves with respect to the graph of data observed in the field were the criteria of goodness to validate the model (De los Santos-Posadas et al., 2006).
The compatible models of basal area, volume and mortality were fitted simultaneously with seemingly unrelated regression (SUR); this technique assumes that the variables are independent from each other. The test of Kolmogorov-Smirnov (KS) was used to qualify the goodness of fit of the percentiles. To discard plots a significance level of α=0.05 and 0.1 was used (Santiago-García et al., 2014; Quiñonez et al., 2015a).
Results and Discussion
Dominant height and explicit yield
For dominant height the models of Hossfeld IV, Schumacher-Korf and Chapman-Richards have the best fits and from them are derived families of site index (SI) (De los Santos-Posadas et al., 2006; Quiñonez-Barraza et al., 2015). Model (2) fitted to predict dominant height coherently describes the growth pattern of the permanent observation plots (Figure 1). This made it possible to derive four site qualities labeled by the site index (SI, m) at a base age of 15 years, with SI=10 for low productivity stands and SI=25 for stands with higher production potential. SI=20 was considered the most representative condition. The estimator of the parameter α0 related to the asymptote has a rejection value for the model (1); this would imply that the height of the trees would reach 125 m. In contrast, model (2) has a projected value of 30.8 m height (Table 1).

Figure 1 Family of growth curves for dominant height by site quality with polymorphic pattern vs the growth pattern of the data observed in permanent plots.

Basal area, volume and number of residual trees
Pienaar and Rheney (1993), Galán et al. (2008) and Magaña et al. (2008) generated systems of knowledge and timber yield (SCRM) relating models of dominant height (AB, m2 ha-1), volume (V, m3 ha-1) and mortality or number of trees (NA) with different statistical techniques, with good results. The system of equations of the present study generated adequate results. The criteria of goodness of fit (Table 2) are acceptable and with high levels of significance in their parameters (Table 3). With the system of equations and the estimated parameters in combination with the family of polymorphic curves, the table of timber yield was constructed for station quality and average quality (Table 4). The value of R2 of the volume model is low, which implies a very high variation among the values of initial density. At year-one the parameter α0 was fixed at 1100 trees per hectare, which is the initial density of most of the plantations of P. patula in Zacualpan, Veracruz. The projection of the growth curves congruently describes the pattern observed in the permanent observation plots (Figure 2A).
Table 2 Goodness of fit statistics under seemingly unrelated regression (SUR) of the system of equations of prediction-projection for basal area, volume and mortality.

Table 3 Estimated parameters and significance level of the parameters with seemingly unrelated regression (SUR) of the prediction-projection system of equations for basal area, volume and mortality.

Pr>|t|: test of significance of parameters; <0.001 is highly significant. β0, β1, β2, γ0, γ1, ω0, ω1. Parameters of regression.
Table 4 Table of growth and yield AB, V, and NA for site quality, generated by the implicit method and non-linear seemingly unrelated regression.

NA †: number of trees per hectare, SI: site index in meters at the base age of 15 years and age in years.
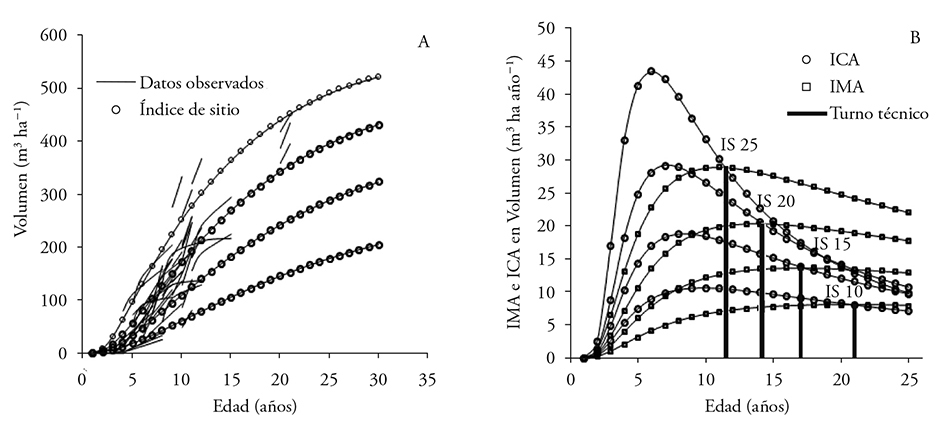
Figure 2 (A) Explicit modeling of growth in volume for different site quality superimposed over the trajectory of the data of re-measured plots. (B) Mean Annual Increment and Current Annual Increment (IMA and ICA) for site quality.
The technical turn for site quality with SI 10, 15, 20 and 25 occurs at 21, 18, 14 and 11 years, respectively. The mean annual increment for these qualities is of 7, 12, 18 and 26 m3 ha-1 year-1 (Figure 2B).
Having three measurements of the same sampling unit and having plots with representative ages in the plantations resulted in a good fit of the models. Consequently it made it possible to adequately describe the growth pattern of the variables of interest.
In forests of the municipality of Zacualtipán, Hidalgo, regenerated naturally with P. patula, at the age of 20 years a yield in volume of 10.2 m3 ha-1 year-1 has been registered in site qualities of SI 26 m at a base age of 40 years (Santiago-García et al., 2013). The above means that the plantations show a better yield when compared with natural forests.
The rate (parameter) that translates in mortality of the number of trees per hectare is the result of the intra-specific competition of the stand. In Zacualtipán a parameter of -0.0337 (Santiago-García et al., 2013) was reported and in our investigation it was a little higher (-0.04). Growth in basal area in combination with a thinning sequel is useful for simulating models of response to thinning.
System of growth and implicit yield with the fdp Weibull
The statistics of goodness of fit and the estimated values in each parameter make it possible to apply the proposed models. The KS test with α=0.05 [C(α)=1.36] indicated the rejection of four of the 50 plots (8 %) and with α=0.1 [C(α)=1.22] a rejection of five (10 %). These results are similar to those of Quiñonez et al. (2015a) and Santiago-García et al. (2013), the latter with 1.58 and 3.96 % of rejection for α=0.05 and α=0.1, respectively. The KS test confirms that the data of plots has a Weibull distribution. To this respect, at a higher level of significance the contrast of the deviations is reduced (Santiago-García et al., 2014).
The SUR procedure utilizes the correlations of the errors of the models to improve the fit. To model Weibull 3P at least two percentiles are required, and their selection depends on the sample (Borders et al., 1987; Santiago-García et al., 2014). The efficiency of the percentile 63 and 95 is shown in Tables 5 and 6. By being centered the bias of prediction is reduced. Similar studies have used percentiles 50 and 90, 40 and 24 and 93 (Santiago-García et al., 2014).
Table 5 Statistics of goodness of fit of the models of percentiles for the Weibull function.

p0, p63, p95: percentile zero, 63 y 95.
Table 6 Statistical parameters of the models of percentiles for the Weibull function.

φ0, φ1, φ2,
The diameter distribution at the age of 20 years indicates that stands with average site quality (SI 20) will have 23 % more trees for saw-timber (DN>25 cm) compared to sites of poor quality (SI 10), which is reflected in the value of production, the larger the diameter, the higher the sale price of the product (Figures 3 and 4). In SI 25 at the age of 10 years it is projected to obtain 51 trees with DN<30 cm; for poor site class zero trees are projected with this same diameter class.
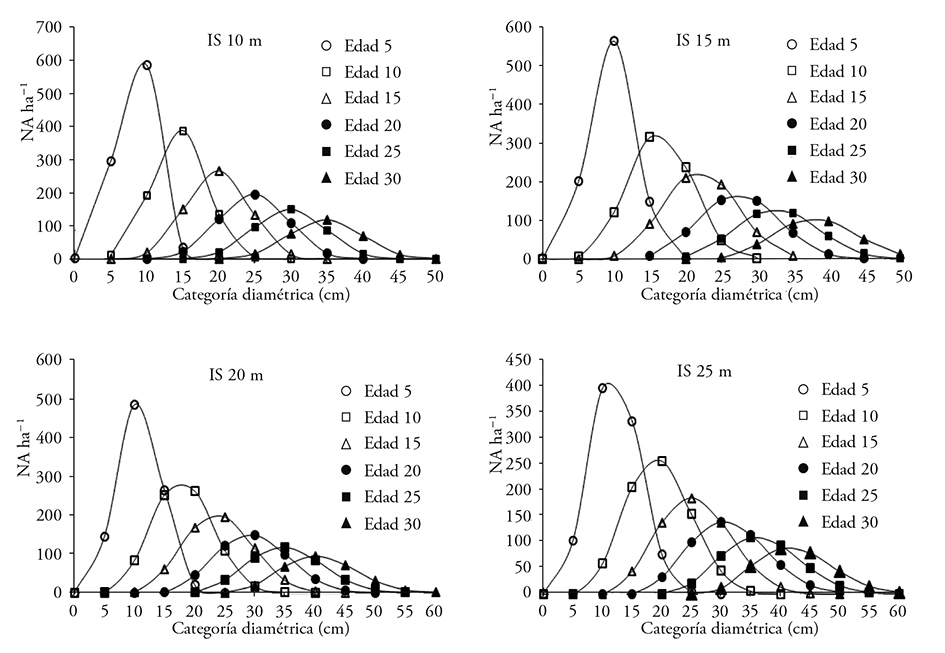
Figure 3 Diameter distributions estimated at different ages of the stand by station quality with the Weibull probability distribution function. SI: 10, 15, 20 and 25 m, Age 5, 10, 15, 20, 25 and 30: is the plantation age in years, NA ha-1: number of live trees per hectare, diametric category in intervals of 5 cm.

Figure 4 Timber yield (m3 ha-1) by site quality: SI 10, 15, 20 and 25, against the age of the plantation. <15: total volume of wood in trees less than 15 cm of DN. >30 : total volume in trees with DN higher than 30 cm. Sum: accumulated volume integrating all of the diameter classes
Promising results are expected for SI of 20 m; because at the age of 15 years 429 trees ha-1 are predicted with DN<30 cm and 151>30 cm ha-1, which corresponds to a volume of 155 and 103 m3 ha-1, respectively. Santiago-García et al. (2014) present for the same species (average site) but with natural forest management of Zacualtipán, Hidalgo, a projection at 20 years of 70 trees with DN<30 cm and 750 individuals with DN<30 cm.
Results show a wide variation in the state-variables, which is motivated by site quality. In SI 10 the technical rotation is projected at 21 years with similar timber production.
Conclusions
From the projections by site quality the final harvest can be programmed at a known age. The SCRM makes it possible to generate zonification of the areas already planted in the region to establish priorities in the expansion plans of this productive activity, and also makes it possible to have technical elements with which to carry out financial analyses of the projects of plantations in the region of Zacualpan, Veracruz. The explicit modeling projects the volume without considering diametric categories. The implicit form groups by diameter classes, therefore the volume will be greater in the former system than in the latter. The volume per hectare at 30 years in SI 25 will produce 522 and 740 m3 ha-1 with explicit and implicit yield, respectively. Free growth (without intermediate cuts) expressed in the growth systems provides tools for management such as estimated rotation, future volume and diameter distribution to accurate estimate income from the sale of wood.
Literatura Citada
Borders, B. E., R. A. Souter, R. L. Bailey, and K. D. Ware. 1987. Percentile-based distribution characterize forest stand tables. For. Sci. 33: 570-576. [ Links ]
Burkhart, H. E., and M. Tomé. 2012. Modeling Forest Trees and Stands. Springer, New York. 457 p. [ Links ]
Clutter, J. L., J.C. Forston, L. V. Pienaar, G. H. Brister, andR. L. Bailey . 1983. Timber Management: A Quantitative Approach. John Wiley & Sons, Inc. New York. 333 p. [ Links ]
De los Santos-Posadas, H. M., M. Montero-Mata, y M. M Kanninen. 2006. Curvas dinámicas de crecimiento en altura dominante para Terminalia amazonia (Gmel.) Excell en Costa Rica. Agrociencia 40: 521-532. [ Links ]
Galán, L. R., H. M. De los Santos-Posadas, y J. I. Valdez H. 2008. Crecimiento y rendimiento de Cedrela odorata L. y Tabebuia donnell-smithii Rose en San José Chacalapa, Pochutla, Oaxaca. Madera y Bosques 14: 65-82. [ Links ]
Gonzalez-Benecke, C. A., S. A. Gezan, D.J. Leduc, T. A. Martin, W.P. Cropper, and L. J. Samuelson. 2012. Modeling survival, yield, volume partitioning and their response to thinning for longleaf pine plantations. Forests 3: 1104-1132. [ Links ]
Jordan, L., R. Souter, B. Parresol., and R. F. Daniels. 2006. Applications of the algebraic difference approach for developing self-referencing specific gravity and biomass equations. For. Sci. 52: 81-92. [ Links ]
Kiviste, A., and K. Kiviste. 2009. Algebraic difference equations for stand height, diameter, and volume depending on stand age and site factors for Estonian state forests. Math. Comput. Nat. - Res. Sci. 1: 67-77. [ Links ]
Knowe, S. A., G. R. Ahrens., and D. S. De Bell. 1997. Comparison of diameter-distribution-prediction, stand-table-projection, and individual-tree-growth modeling approaches for young red alder plantations. For. Ecol. Manag. 98: 49-60 [ Links ]
Lindsay, R. S., G. R. Wood, and R. C. Wollons. 1996. Modelling the diameter distribution of forest stands using the Burr distribution. J. Appl. Stat. 23: 609-619. [ Links ]
Magaña, T. O. S., J. M. Torres R., C. Rodríguez F., H. Aguirre D., y A. M. Fierros G . 2008. Predicción de la producción y rendimiento de Pinus rudis Endl. en Aloapan, Oaxaca. Madera y Bosques 14: 5-13. [ Links ]
Pienaar, L.V., and J. W. Rheney. 1993. Yield prediction for mechanically site- prepared Slash pine plantations in the southeastern coastal plain. South. J. Appl. For. 17: 163-173. [ Links ]
Quiñonez B., G., H. M. De los Santos P., F. Cruz C., A. Velázquez M., G. Ángeles P., y G. Ramírez V. 2015a. Modelación dinámica de distribuciones diamétricas en masas mezcladas de Pinus en Durango, México. Madera y Bosques 21: 59-71. [ Links ]
Quiñonez B., G., H. M. De los Santos P., F. Cruz C., A. Velázquez M., G. Ángeles P., y G. Ramírez V. 2015b. Índice de sitio con polimorfismo complejo para masas forestales de Durango, México. Agrociencia 49: 439-454. [ Links ]
Rose, C. E., M. L. Clutter, B. D. Shiver, D. B. Hall, and B. Borders. 2004. A generalized methodology for developing whole - stand survival models. For. Sci. 50: 686-695. [ Links ]
SAS Institute Inc. 2014. SAS/ETS® 9.3 User´s Guide. SAS Institute Inc., Cary, NC. 2861 p. [ Links ]
Santiago-García, W., H. M. De los Santos-Posadas , G. Ángeles-Pérez, J. R. Valdez-Lazalde, y G. Ramírez-Valverde. 2013. Sistema compatible de crecimiento y rendimiento para rodales coetáneos de Pinus patula. Rev. Fitotec. Mex. 36: 163-172. [ Links ]
Santiago-García, W., H.M. De los Santos-Posadas, G. Ángeles-Pérez, J.J. Corral-Rivas, J.R. Valdez-Lazalde, y D.H. Del Valle-Paniagua. 2014. Predicción del rendimiento maderable de Pinus patula Schl. et Cham. a través de modelos de distribución diamétrica. Agrociencia 48: 87-101. [ Links ]
Schumacher, F. X. 1939. A new growth curve and its applications to timber yield studies. J. For. 37: 819-820. [ Links ]
Torres-Rojo, J. M., M. Acosta-Mireles, y O. S. Magaña-Torres. 1992. Métodos para estimar los parámetros de la función Weibull y su potencial para ser predichos a través de atributos del rodal. Agrociencia 2: 57-76. [ Links ]
Torres-Rojo, J. M., O. S. Magaña-Torres, y M. Acosta-Mireles . 2000. Metodología para mejorar la predicción de parámetros de las distribuciones diamétricas. Agrociencia 34: 627-637. [ Links ]
Uranga-Valencia, L. P., H. M. De los Santos-Posadas , J. R. Valdez-Lazalde , J. López-Úpton, y H. Navarro-Garza. 2015. Volumen total y de ahusamiento para Pinus patula Schiede ex Schltdl. et Cham. en tres condiciones de bosque. Agrociencia 49: 797-801. [ Links ]
Villaseñor-Alba, J. A., y Villanueva-Morales, A. 2000. Dos pruebas de hipótesis basadas en estimadores para el parámetro de forma de la distribución Weibull. Agrociencia 35: 197-209. [ Links ]
Wang, M., and K. Rennolls. 2005. Tree diameter distribution modelling: introducing the logit-logistic distribution. Can. J. For. Res. 35: 1305-1313. [ Links ]
Weibull, W. 1951. A statistical distribution function of wide applicability. J. Appl. Mech. 18: 293-297. [ Links ]
Received: June 2016; Accepted: November 2016
 Este es un artículo publicado en acceso abierto bajo una licencia Creative Commons
