


Servicios Personalizados
Revista
Articulo
 texto en
  Inglés (pdf)
 Artículo en XML
 Referencias del artículo
 Enviar artículo por email
Indicadores
-
 Citado por SciELO
 -
 Accesos
Links relacionados
-
 Similares en
SciELO
Similares en
SciELO
Compartir

 Permalink
Agrociencia
versión On-line ISSN 2521-9766versión impresa ISSN 1405-3195
Agrociencia vol.51 no.2 Texcoco feb./mar. 2017
Natural Renewable Resources
Growth and timber yield of Pinus chiapensis
1Postgrado en Ciencias Forestales, Campus Montecillo, Colegio de Postgraduados. 56230. Carretera México-Texcoco km 36.5. Montecillo, Texcoco, Estado de México, México.
2Instituto Tecnológico de el Salto, Durango.
A Timber Growth and Yield System (TGYS) is a set of models that quantitatively describe the growth and yield of forest stands over time. The aim of this study is to build a TGYS as a support tool for decision-making in the management of Pinus chiapensis (Martínez) Andresen. Data were collected from 44 plots established in 2013 at Tlatlauquitepec, Puebla, Mexico, and measured again in 2014. The components of the system were generated by the algebraic difference approach. The fitting was done with the seemingly unrelated regression technique (SUR) as a system of simultaneous equations. For the dominant height, Hossfeld IV polymorphic model was the most appropriate. Models for the basal area, number of trees and volume explained between 80.9 % and 99.9 % of the total variation. The yield table indicates that in low productivity sites (site index of 10 m), the maximum current annual increment (CAI) in volume occurs at 14 years, with a potential volume of 25.18 m3 ha-1 and an average yield of 196.84 m3 ha-1. In sites of mean index (14 m), the maximum CAI in volume takes place at 11 years, which has a potential volume of 32.73 m3 ha-1 and an average yield of 199.21 m3 ha-1. In high productivity areas (18 m), maximum CAI takes place at 9 years, with a potential volume of 40.66 m3 ha-1 and yield of 200.97 m3 ha-1. The estimated volume rotation at these sites occurs at 17 years, with a yield of 472.39 m3 ha-1. On average sites, the absolute volume rotation occurs at 20 years with yields of 453.54 m3 ha-1. At low productivity sites, this rotation is close to 25 years with a yield of 441.64 m3 ha-1.
Keywords: Algebraic difference; Pinus chiapensis (Martínez) Andresen; dominant height; performance chart; prediction; projection
Un Sistema de Crecimiento y Rendimiento Maderable (SCRM) es un conjunto de modelos que describen cuantitativamente el crecimiento y rendimiento de los rodales a través del tiempo. El objetivo del presente estudio fue construir un SCRM como herramienta de apoyo para la toma de decisiones en el manejo de plantaciones de Pinus chiapensis (Martínez) Andresen. Los datos se tomaron de 44 sitios establecidos en 2013 en Tlatlauquitepec, Puebla, México, y medidos nuevamente en 2014. Los componentes del sistema se generaron mediante el método de diferencia algebraica. El ajuste se realizó con la técnica de Regresión Aparentemente no Relacionada (SUR) como un sistema de ecuaciones simultáneas. Para la altura dominante, el modelo de Hossfeld IV polimórfico fue el más apropiado. Los modelos para el área basal, número de árboles y volumen, explicaron entre 80.9 % y 99.9 % de la variación total observada. La tabla de rendimiento indicó que en sitios de productividad baja (índice de sitio de 10 m), el Incremento Corriente Anual (ICA) máximo en volumen ocurre a los 14 años, con volumen potencial de 25.18 m3 ha-1 y rendimiento medio de 196.84 m3 ha-1. En índices de sitio promedio (14 m), el ICA máximo en volumen sucede a los 11 años, con volumen potencial de 32.73 m3 ha-1 y rendimiento medio de 199.21 m3 ha-1. En sitios de productividad alta (18 m) el ICA máximo sucede a los 9 años con volumen potencial de 40.66 m3 ha-1 y rendimientos de 200.97 m3 ha-1. El turno absoluto en volumen estimado en estos sitios sucede a los 17 años con rendimientos de 472.39 m3 ha-1. En sitios promedio el turno absoluto es a los 20 años con rendimientos de 453.54 m3 ha-1. En sitios de baja productividad este turno se acerca a los 25 años con rendimientos de 441.64 m3 ha-1.
Palabras clave: Diferencia algebraica; Pinus chiapensis (Martínez) Andresen; altura dominante; tabla de rendimiento; predicción; proyección
Introduction
Sustainable forest management includes estimating timber growth and yield of forest stands through predictive modeling and projections. Therefore, forest managers should have forestry tools that allow to properly estimate the changes in a stand, to define forest management strategies, and thus achieve sustained performance (De la Fuente et al., 1998). On intensively managed forests it is necessary to have growth and yield models that adequately describe the behavior of the forest stands variables throughout time, and at the same time, include different management conditions in order to support their investment through intensive silviculture (García, 1994; Zepeda and Acosta, 2000).
Growth and yield prediction models facilitate decision making because they allow harvest planning, evaluation of alternative managing or handling regimes and can be used as basic tools for financial evaluation. Without these tools it is difficult to develop effective forest management plans (Valdez and Lynch, 2000; Torres and Magaña, 2001). Thus, the Site Index (SI) allow forest managers to classify and project the stand growth, which is a simplified and effective way to assess forest productivity (Torres and Magaña, 2001; De los Santos et al., 2006).
The implementation of timber growth and yield systems (TGYS) takes place in Mexico in even-aged natural forests and plantations aimed to produce and harvest timber (Zepeda and Dominguez, 1998; Galán et al., 2008; Magaña et al., 2008). The role of TGYS is to predict the change over time of the state variables of a forest stand: dominant height (DH), basal area (BA), number of trees (NT) and volume (V) (Santiago et al., 2013; Tamarit et al., 2013). The equations that make up the system describe the relationships between the variables of interest, based on the assumption that all relationships occur simultaneously. The models that make the TGYS can have various features; one of the most desirable is time compatibility that depends on the simultaneous relationships that the variables present (Borders and Bailey, 1986).
Buckman (1962) initiated the development of compatible systems and established that the growth components are interrelated. Alternatively, Clutter (1963) developed equations expressed in the form of algebraic difference. This technique can generate dynamic prediction and projection equations that, due that they are obtained from the same base model, are compatible as they share the same estimators of the parameter values (Garcia, 1988; García, 1994; Tamarit et al., 2013).
The aim of this study was to develop an explicit TGYS prediction modeling that allows to simulate scenarios for forestry management and estimate the potential timber volume in fast-growing plantations of P. chiapensis Martinez Andresen, at Tlatlauquitepec, Puebla, Mexico. The woods of this species is valued in the area but scarcely found in the natural forests of the region, which is the reason why this species is under special protection.
Materials and Methods
Data was chronologically obtained from 44 permanent sample plots of 400 m2, set in 105 hectares of P. chiapensis plantations at Tlatlauquitepec municipality. These plantations are located 19° 36’ 24’’ N and 97° 14’ 42’’ W at a mean altitude of 1900 m. The climate in the region is temperate-humid with abundant rain in summer, mean temperature of 15.6 °C and 1435 mm of mean annual rainfall.
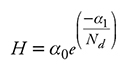
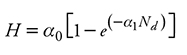
Plots covered growth conditions, such as age (1 to 8 years), density and site quality. The dasometric information obtained from the sites was: dominant height (DH m) of 10 dominant and codominant trees, in order to optimize the proportionality and equivalence of sampling 100 trees ha1 on average (Alder, 1980); normal tree diameter with bark of all trees (Nd in cm) and number of live trees within sites (NT). Measured heights were assumed as a subsample of the population and were used to estimate the total height of each tree, using a height model based on the normal diameter (Nd). Set functions were: the Schumacher model (1) and the Chapman-Richards model for two parameters or mono-molecular model (2).
 (1)
(1)
 (2)
(2)
where H is the total tree height in m Nd is the diameter expressed in cm αi are the estimated parameters.
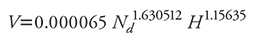
To obtain standing volume, we used the equation for total bole volume with bark generated for this species. The equation is the result of the data analysis of 31 tree stem analyses, this equation contains three specific parameters and the following structure:
 (3)
(3)
where V is the volume with bark in m3, the rest was already defined.
With the above, variables were estimated to characterize growth conditions per hectare: average height of dominant trees (DH in m), basal area (BA in m2), number of living trees (NT) and total volume (V in m3).
The TGYS was formulated with prediction equations and projection for the plantation state variables. The first step to generate the TGYS was set DH models, the model that defined the family of curves of the site index (SI, is the dominant height of the stand at a base reference age) had the structure:
Table 1 Dominant height models structure fitted by algebraic difference.
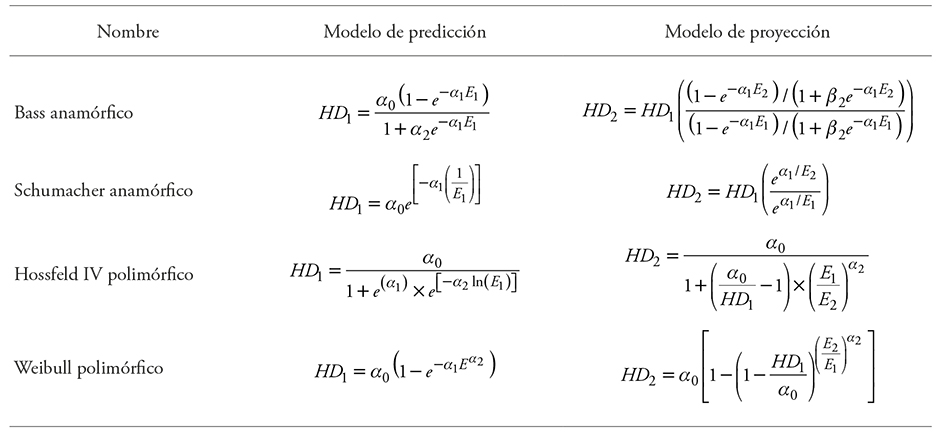
DH2 and DH1: dominant height at E2 and E1 ages, ln: natural logarithm, e: exponential function y α1: parameters to be estimated.
The anamorphic curves hypothesis is that growth rates between sites are constant but their maximum potential (asymptote) varies. On the contrary, the polymorphic curves hypothesis is based on growth variability in all sites, and the maximum potential to be common (constant asymptotes) (Bailey and Clutter, 1974).
The next step was to fit the prediction models and projection in the basal area variable, which is of high importance for its correlation with the total volume, which directly measures the stand density and allow to evaluate the forestry practices effects, such as thinning, which can be, both, in population level and at individual trees (Santiago et al., 2013). The fitted models were developed by Torres and Magaña (2001) for the prediction model (4) and projection (5):
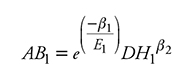 (4)
(4)
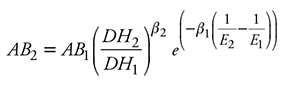 (5)
(5)
where AB1 is the basal area in m2 ha-1 at age E1 AB2 is the future basal area at E2 ß1 are the parameters to be estimated; the rest were defined above.
Mortality by which the number of trees NT is defined is the most difficult variable to model in the TGYS because they are risk functions; still, they are modeled as continuous variables (De los Santos et al., 2006). Mortality models are derived from change rates in the number of individuals, they assume that the change rate in the number of individuals over time is constant. To evaluate the NT, models with exponential structure were fitted, these were proposed by Torres and Magaña (2001) for the prediction model (6) and projection (7):
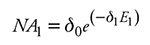 (6)
(6)
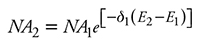 (7)
(7)
where NA1 is the number of trees per hectare in the initial age E1 NA2 is the number of trees at the age of projection E2 δ1 is the parameter to be estimated.
In order to predict the yield volume of the plantation at stand level, volume models proposed by Tamarit et al. (2013) were used. The most appropriate included: basal area, dominant height, age and number of trees, for the prediction (8) and projection (9) models:
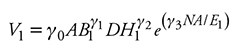 (8)
(8)
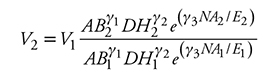 (9)
(9)
where V1 is the volume in m3 ha-1 at age E1 V2 is the volume per hectare at the projection age E2 γ1 model parameters to be estimated; the rest was already been defined.
With the variables that include the fitted models, the timber volume of the plantations was calculated. All TGYS elements were simultaneously fitted using the Seemingly Unrelated Regression technique (SUR) in the SAS/ETS® software (SAS Institute Inc., 2008). Besides, this technique allowed a better gain in the estimation parameters, because error components were correlated in the equations system (Rose and Lynch, 2001); this also allowed full compatibility between the model of average estimate (prediction) and the projection, in a way that the estimated parameters acquired the same values with the minimization of squared residuals criterion (Galán et al., 2008).
The statistical goodness of fit criteria taken into account when fitting the models in DH were: the sum of squares error (SSE), the mean squared error (MSE), and the coefficient of determination adjusted to the number of parameters (R2Adj).
Results and Discussion
Using the best fitted diameter-height model the heights of the remaining trees at the plot were estimated, which allowed estimating the precise volume per tree to build the TGYS. The results of the fitting indicated that the two models were good candidates for making estimates (Table 2). The values of the obtained results show little difference in the fit of the models.
Table 2 Obtained statistics, estimated parameters and significance of height models based on normal diameter.
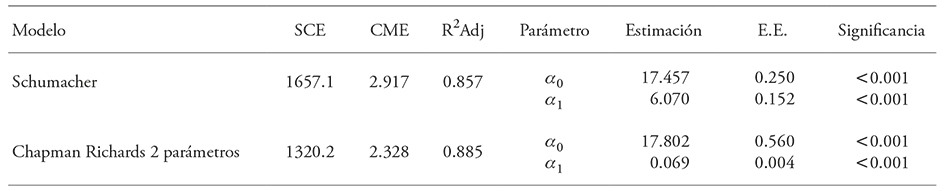
SSE sum of squared error, MSE: mean square error, R2Adj: coefficient of determination adjusted for the number of parameters; EE: Standard Error.
Results show small difference for fitting the models. The two parameters Chapman-Richards model showed a slight superiority in the adjustment statistics, it is therefore considered the best model. Both equations generated an asymptote close to 18 m.
For the dominant height growth models, the statistical criteria for the goodness of fit equation system explained 88.2 % in the prediction and 94.9 % in the projection of the total observed variation in DH (Table 3).
Table 3 Statistics obtained from the adjusted models in algebraic difference for dominant height in function of the age.
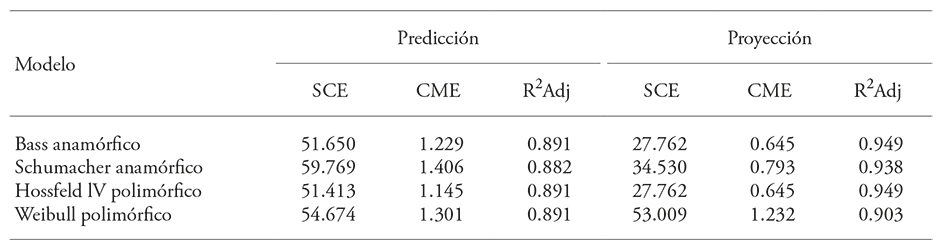
Statistical tests values were similar in SSE, and MSE; additionally standard errors were reduced. This contrasts with the results of the study by Rodriguez et al. (2005) in even-aged forest stands of P. chiapensis in the states of Veracruz and Puebla, Mexico, in which fittings were made by using the algebraic difference approach with data obtained from stem analysis; fitted models accounted for 65.8 % to 98.3 % of the DH variation.
Pinus chiapensis is a fast growing species; therefore, the trend of the dataset has a sigmoidal shape, more vertical than other species and reaches its maximum development at an earlier age (Rodriguez et al., 2005). As the age difference is reduced, the growth curves are more efficient. This indicates that if the prediction interval of the site index is small, the changes in the form are more important than the changes in the general trend of the curve and vice versa. When the interval is large, the general trend of the curve has greater importance (Torres, 2001). In our study, the estimated parameters of the DH models were significant (Table 4).
Table 4 Estimated parameters, standard error and significance of adjusted models in algebraic difference for dominant height in function of the age.
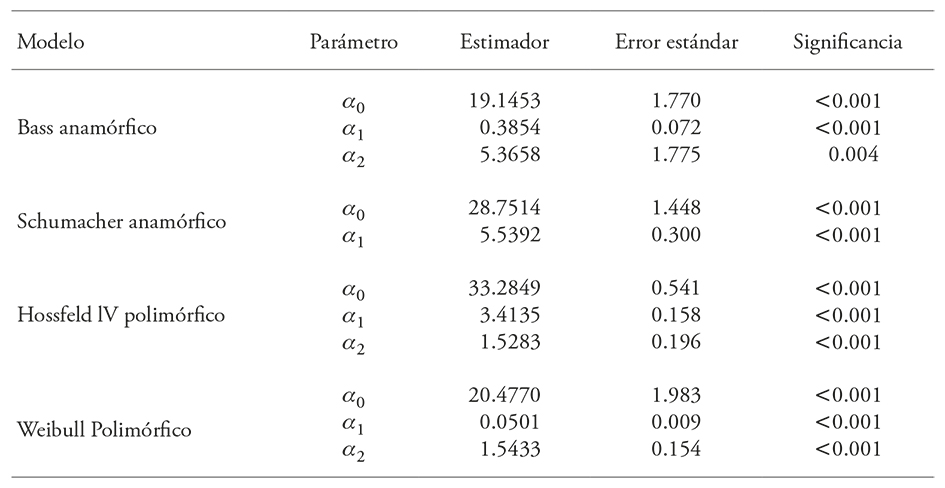
The statistical analysis showed that the Hossfeld IV polymorphic model was the most appropriate because, besides presenting a high R2Adj in the prediction equations and projection, it generated low values in the SSE. In the parameter estimations, the maximum asymptote stands out at a height of 33 m, which is similar to the asymptotes of 31.53 m to 37.03 m identified by Rodriguez and Arteaga (2005). This is consistent with a study of the same species in El Rincón, Oaxaca, Mexico, which found that in pure forest stands the asymptotic relationship between height and age, in which a rapid initial growth is observed, occurs during the first 30 years (Sanchez and Del Castillo, 2001).
Based on the above and in the graphical evaluation of their behavior regard the trajectory of the data, the Hossfeld IV model was chosen for the construction of growth curves in dominant height (Figure 1).
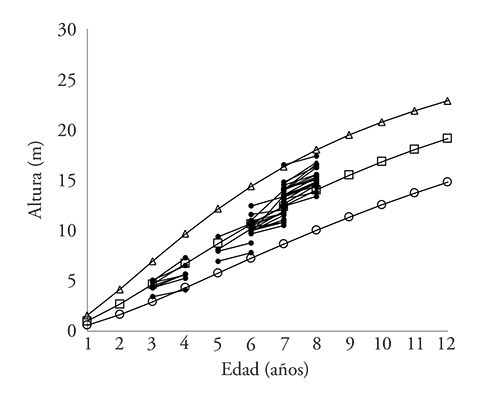
Figure 1 Behavior of polymorphic curves of site index (SI) for P. chiapensis at base age of 8 years superimposed on the observed data of dominant height.
If the dominant growth height in these plantations is compared with natural forests of the same species, it is evident that plantations have better SI, because forestry treatments such as pruning, weeding and light thinning are applied. In this case, at the average projected rate, reaches a height of 19 m in 12 years. In the study by Rodriguez and Arteaga (2005), in 12 years, trees did not reach a 10 m height.
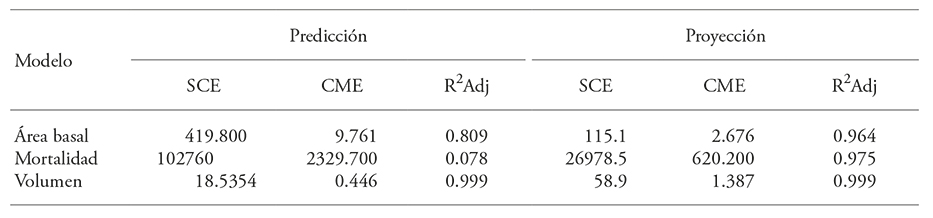
Santiago et al. (2013) adjusted site index curves implementing the Hossfeld IV model in anamorphic form in even aged forest stands of Pinus patula Schl. et Cham. The found out that the most appropriate had constant growth rates with variable asymptotes. On the contrary, in our study, families with polymorphic curves are the most appropriate to describe the growth pattern of the plantation (Bailey and Clutter, 1974). The projections of the curves show that trees will continue to grow as time goes by, because the change from concave to convex is still not observed. For the variables that represent density and volume, the adjustment and estimated parameters show high accuracy, explaining 80.9 % in the mean prediction and 99.9 % in the variation of the projection (Table 5).
Table 5 Goodness-of-fit statistics obtained from the adjusted algebraic difference approach for basal area, mortality and volume.
The high parameter significance (<0.001) and small standard errors denote the robustness and reliability of the proposed growth models (Table 6).
Table 6 Estimated parameters, standard error and significance of the prediction models and projection of basal area, mortality and volume.
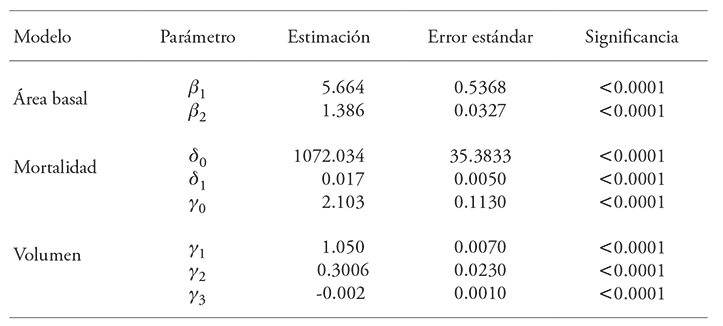
The NT model allows to simulate forestry regimes for different SI. However, if there is a lack of fit to predict the number of trees, it has to do with young ages of the plantation, because at a young age the mortality is low. When simultaneously fitting, the projection model of NT gives an estimation that explains 97.5 % of this variability, with an estimated annual mortality of 1.7 %.
These models are consistent with that reported by Magaña et al. (2008), who proposed a mortality function for Pinus rudis Endl, in which the proportional mortality rate depends on the age and site index. To make yield forecasts, a minimum asymptotic value has to be defined, because the mortality model calculates to obtain zero trees ha-1, but in a managed forest it is unlikely for this to happen (De los Santos et al., 2006). The estimated values of the state variables of the stand condition in a future state from an initial state must be equal, regardless of the number of steps used in its prediction (Diéguez et al., 2005).
Volume equations (models 8 and 9) incorporate the explanatory variables BA, DH, age and NT. Similarly, these variables are used to model the timber yield of: Pinus arizonica Engl. (Zepeda and Dominguez, 1998), P. rudis Endl. (De la Fuente et al., 1998; Magaña et al., 2008), P. patula Schiede (Valdez and Lynch, 2000), P. montezumae Lamb. (Zepeda and Acosta, 2000), Cedrela odorata L. and Tabebuia donnellsmithii Rose (Galán et al., 2008).
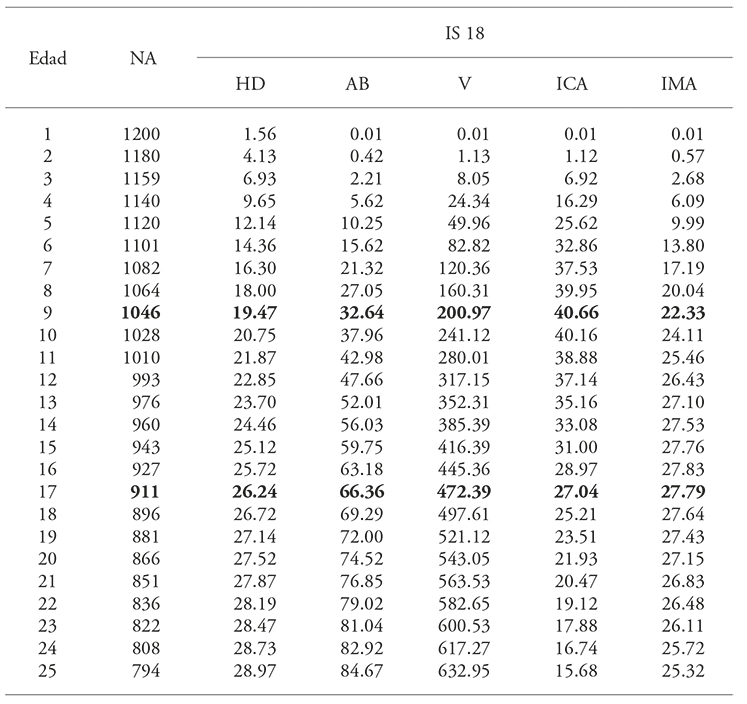
The TGYS can represent in measurable terms the life of a stand through a yield table generated for the species, which shows the differences in the variables of interest as age changes (De los Santos et al., 2006). Tables 7 and 8 show a yield table of P. chiapensis forest stands in the SI of 10, 14 and 18 m of DH at a base age of 8 year. The yield table shows the expected growth of the stand variable of interest for each site quality and allows to distinguish several levels of CAI and MAI in volume, and thus define the age at which the absolute volume rotation CAI=IMA occurs.
Table 7 Growth and timber yield prediction for SI of 10 and 14 m, with an initial density of 1200 trees ha-1.
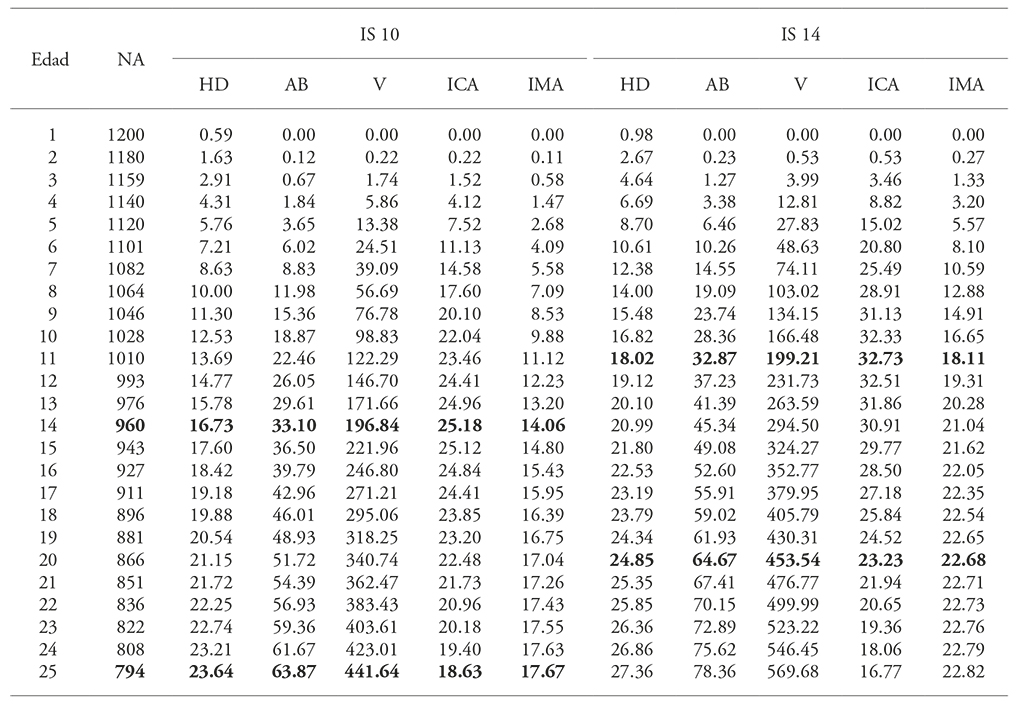
NT: number of trees per hectare; DH: dominant height in m; IS: site index in m; AB: basal area in m2 ha-1; V: volume in m3 ha-1; CAI: current annual increment in m3 ha-1 year-1; MAI: mean annual increment in m3 ha-1 year-1.
Table 8 Prediction of growth and timber yield for 18 m SI, with an initial density of 1200 trees ha-1.
The plantation is young and is still in growing stage. The carried out work, such as pruning, and thinning will greatly help to stimulate further growth.
Given that the selected DH model is of polymorphic type, growth rates are variable in the three site indexes (Figure 2).
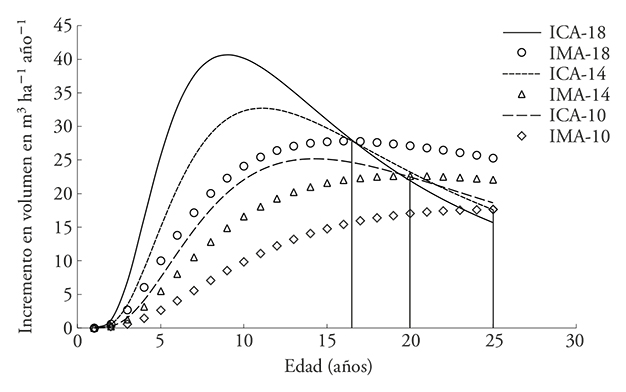
Figure 2 Mean annual increment curves (MAI) and current annual increment (CAI) by site index, at a base age of 8 years.
The production potential of the sites is evident, the plantation is young and changes in absolute volume rotation are expected in short term; this is variable, it depends on the quality of the site and in the most productive sites, the rotation occurs at a younger age. By contrast, in the less productive sites, the rotation takes longer to happen. The fact that in sites of average productivity the technical volume rotation is estimated to be close to 20 years, suggests that the application of intensive forestry treatments such as weeding, fertilizing and pruning should be done before 20 years of age in order to promote the growth of a high economic value forest mass in the shortest possible time.
Conclusions
The developed Timber Growth and Yield System allows us to simulate forestry scenarios for the management of Pinus chiapensi forest stands, and may be used as a decision making tool.
Accurate predictions and projections of the stand’s variables of interest are obtained with the TGYS. However, to validate long-term studies it is desirable to monitor the established of measurement plots, whereby the obtained results should not be extrapolated beyond 20 years.
The system suggests the application of strong clearings before 20 years to promote the growth of a mass of high economic value in the shortest possible time and thus shorten the absolute volume rotation
Literatura Citada
Alder, D.. 1980 Estimación del volumen forestal y predicción del rendimiento con referencia especial a los trópicos. Estudio FAO. Montes 22/2. Organización de las Naciones Unidas para la Agricultura y la Alimentación. Roma, Italia. 118 p. [ Links ]
Bailey, R. L., and J. L. Clutter. 1974. Base-age invariant polymorphic site curves. For. Sci. 20: 155-159. [ Links ]
Borders, B. E., and R. L. Bailey. 1986. A compatible system of growth and yield equations for slash pine fitted with restricted three-stage least squares. For. Sci. 32: 185-201. [ Links ]
Buckman, R. 1962. Growth and yield of red pine in Minnesota. USDA Forest Service, Tech. Bull. 1272. 50 p. [ Links ]
Clutter, J. L. 1963. Compatible growth and yield models for loblolly pine. For. Sci. 9: 354-371. [ Links ]
Clutter, J. L., J. C. Forston, L. V. Pienaar, G. H. Brister, and R. L. Bailey. 1983. Timber Management: A Quantitative Approach. John Wiley & Sons, Inc. New York. 333 p. [ Links ]
De la Fuente, E. A., A. Velásquez M., J. M. Torres R., H. Ramírez M., C. Rodríguez F., y A. Trinidad S. 1998. Predicción del crecimiento y rendimiento de Pinus rudis Endl., en Pueblos Mancomunados, Ixtlán, Oaxaca. Rev. Ciencia Forest. Mex. 23: 3-8. [ Links ]
De los Santos, P. H. M., M. Montero, y M. M. Kanninen. 2006. Curvas dinamicas de crecimiento en altura dominante para Terminalia amazonica (Gmel.) Excell en Costa Rica. Agrociencia 40: 521-532. [ Links ]
Diéguez, A. U., F. Castedo D., y J. G. Álvarez G. 2005. Funciones de crecimiento en área basimétrica para masas de Pinus sylvestris L. procedentes de repoblaciones en Galicia. Invest. Agr. Sist. Recur.For. 14: 253-266. [ Links ]
Galán, L. R., H. M. De los Santos P., y J. I. Valdez H. 2008. Crecimiento y rendimiento maderable de Cedrela odorata I. y Tabebuia donnellsmithii Rose en San Jose Chacalapa, Pochutla, Oaxaca. Madera y Bosques 14: 65-82. [ Links ]
García, O. 1988. Growth modelling -a (re)view. N. Z. For. 33: 14-17. [ Links ]
Garcia, O. 1994. The state-space approach in growth modeling. Can. J. For. Res. 24: 1894-1903. [ Links ]
Magaña, T. O. S., J. M. Torres R., C. Rodríguez F., H. Aguirre D., y A. M. Fierros G. 2008. Predicción de la producción y rendimiento de Pinus rudis Endl. en Aloapan, Oaxaca. Madera y Bosques 14: 5-19. [ Links ]
Rodríguez, A. M., y B. Arteaga M. 2005. Índice de sitio para Pinus chiapensis (Martínez) Andresen, en los estados de Veracruz y Puebla, México. Rev. Chapingo. Serie Ciencias Forestales y del Ambiente. 11: 39-44. [ Links ]
Rose, Jr. C. E., and T. B. Lynch. 2001. Estimating parameters for tree basal area growth with a system of equation and seemingly unrelated regressions. For. Ecol. Manage. 148: 51-61. [ Links ]
Sánchez, V. N. M., y R. F. Del Castillo S. 2001. Calidad de estación para Pinus chiapensis (Mart.) Andresen en el Rincón, Oaxaca, México. Rev. Forest. Veracr. 3: 9-12. [ Links ]
Santiago, G. W., H. M. De los Santos P., G. Ángeles P., J. R. Valdez L., y G. Ramírez V. 2013. Sistema compatible de crecimiento y rendimiento para rodales coetáneos de Pinus patula. Rev. Fitotec. Mex. 36: 163-172. [ Links ]
SAS (Statistical Analysis System). 2008. SAS/STAT® 9.0 User’s Guide. SAS Institute Inc. Raleigh, NC USA. 248 p. [ Links ]
Tamarit, U. J. C., H. M. De los Santos P., A. Aldrete., J. R. Valdez L., H. Ramírez M., y V. Guerra de la C. 2013. Ecuaciones dinámicas de índice de sitio para Tectona grandis en Campeche, México. Agrociencia 48: 225-238. [ Links ]
Torres, R. J. M. 2001. Curvas de índice de sitio de forma y escala variables en investigación forestal. Agrociencia 35: 87-98. [ Links ]
Torres, R. J. M., y O. S. Magaña. 2001. Evaluación de Plantaciones Forestales. Limusa Noriega Editores. México, D. F. 472 p. [ Links ]
Valdez, L. J. R., y T. B. Lynch. 2000. Ecuaciones para estimar volumen comercial y total en rodales aclareados de pino patula en Puebla, México. Agrociencia 34: 747-758. [ Links ]
Zepeda, B. E. M., y A. Domínguez P. 1998. Niveles de incremento y rendimiento maderable de poblaciones naturales de Pinus arizonica Engl., de El Poleo, Chihuahua. Madera y Bosques 4: 27-39. [ Links ]
Zepeda, B. E. M ., y M. Acosta M. 2000. Incremento y rendimiento maderable de Pinus montezumae Lamb., en San Juan Tetla, Puebla. Madera y Bosques 6: 15-27. [ Links ]
Received: March 2016; Accepted: September 2016
 Este es un artículo publicado en acceso abierto bajo una licencia Creative Commons
