


Servicios Personalizados
Revista
Articulo
 texto en
  Inglés (pdf)
 Artículo en XML
 Referencias del artículo
 Enviar artículo por email
Indicadores
-
 Citado por SciELO
 -
 Accesos
Links relacionados
-
 Similares en
SciELO
Similares en
SciELO
Compartir

 Permalink
Agrociencia
versión On-line ISSN 2521-9766versión impresa ISSN 1405-3195
Agrociencia vol.51 no.2 Texcoco feb./mar. 2017
Water-Soils-Climate
Effect of vegetation cover management on water erosion in shade coffee plantations
1Red de Ecología Funcional. Instituto de Ecología, A.C. 91070. Xalapa, Veracruz.
2Posgrado en Ciencias. Instituto de Ecología, A.C. 91070. Xalapa, Veracruz.
Studies on management of weed cover have shown that chapeo (cutting with a machete) helps control soil erosion in coffee plantations located on slopes. However, a growing number of coffee producers prefer to use herbicides to lower the cost of weed control, not knowing whether this change in practice may increase soil erosion and decrease long-term productivity. Therefore, the objective of this study was to analyze the relationship between plant cover (trees, coffee bushes, herbaceous plants, and litterfall) and soil erosion rates, and to quantify the effects of both chapeo and herbicides in four shade coffee plantations in central Veracruz, Mexico. On each farm, three blocks, each with three rectangular 8×4 m plots were established. Soil erosion was measured with seven stakes per plot from May 2012 to April 2013. Negative values were assigned to soil loss and positive values to sedimentation. The degree of tree cover was measured in July 2012 and that of herbaceous plants, litterfall, and bare soil in March 2013. Average annual net erosion was -33.5±38.6 Mg ha-1 in the control plots, -34.1±33.8 Mg ha-1 in chapeo plots, and -20.0±32.1 Mg ha-1 in herbicide treated plots. A mixed linear model through maximum likelihood indicated that only the herbaceous plant cover had a reducing effect on the net erosion rate, while tree cover had the opposite effect. Herbicide application increased erosion on only two farms, and therefore its effect was not conclusive. The study contributed to understanding erosion in shade coffee plantations with variable management of plant cover.
Key words: Agroforestry; coffee; erosion; mixed linear model
Estudios sobre el manejo de la cobertura herbácea mostraron que el chapeo (corte con machete) controla la erosión del suelo en cafetales ubicados sobre pendientes. Sin embargo, un número creciente de productores prefiere utilizar herbicidas para bajar el costo del chapeo, sin saber si este cambio de práctica incrementa la erosión del suelo y disminuye la productividad a largo plazo. Por lo tanto, el objetivo de esta investigación fue analizar la relación entre la cobertura vegetal (arbórea, arbustiva, herbácea y de hojarasca) y la tasa de erosión, y cuantificar los efectos del chapeo y del herbicida, en cuatro cafetales de sombra del centro del estado de Veracruz, México. En cada finca se instalaron tres bloques con tres parcelas rectangulares de 8×4 m cada uno. Los tratamientos chapeo, herbicida y testigo se distribuyeron al azar entre las parcelas de cada bloque. La erosión del suelo se midió con siete estacas por parcela, de mayo 2012 a abril 2013. La pérdida de suelo tuvo valores negativos y la sedimentación valores positivos. El grado de cobertura arbórea se midió en julio 2012 y los de cobertura herbácea, hojarasca y suelo desnudo en marzo 2013. La erosión neta promedio anual fue -33.5±38.6 Mg ha-1 en las parcelas testigo, -34.1±33.8 Mg ha-1 en las de chapeo y -20.0±32.1 Mg ha-1 en las tratadas con herbicida. Un modelo lineal mixto por máxima verosimilitud indicó que solo la cobertura herbácea tuvo un efecto reductivo sobre la tasa de erosión neta, mientras que la cobertura arbórea tuvo el efecto opuesto. La aplicación de herbicida aumentó la erosión sólo en dos fincas, por lo cual su efecto no fue concluyente. El estudio contribuyó al entendimiento de la erosión en cafetales de sombra con manejo variable de la cobertura vegetal.
Palabras clave: Agroforestería; café; erosión; modelo lineal mixto
Introduction
In Mexico, shade coffee production systems, categorized qualitatively as rustic, traditional polyculture, commercial polyculture and monoculture (Moguel and Toledo, 1999; 2004), cover 90 % of the area planted in coffee, and almost two thirds are under traditional management (Manson et al., 2008). The state of Veracruz is the second largest coffee-producing state of the country (SIAP-SAGARPA, 2015) and most plantations are located on steep slopes (15° to 35°) with risk of water erosion and soil degradation (Rosas-Arellano et al., 2008; Pérez-Portilla and Geissert-Kientz, 2006). Because of the crisis in the Mexican coffee sector, many growers are seeking ways to intensify production, improve yields and reduce labor costs. One intensive management practice is the use of herbicides for weed control, which could increase soil erosion (Ataroff and Monasterio, 1997; Arellano, 2000). The main effects of erosion on a plantation are degradation of hydrophysical, chemical, and biological properties of the soil, to the detriment of crop production, while effects outside the plantation include sedimentation in rivers and reservoirs, deterioration of water quality, and changes in hydrological patterns (Sidle et al., 2006).
The rate of soil loss in coffee plantations is comparable to that in natural forests or grasslands on steep slopes (0.01 to 5 Mg ha-1 year-1), but differs from that in farmland (0.1 to 400 Mg ha-1 year-1) (Pimentel and Kounang, 1998). The general trend is 0.38 to 0.79 Mg ha-1 year-1 in shade coffee plantations and 0.31 to 1.57 Mg ha-1 year-1 in sun coffee plantations (Ataroff and Monasterio, 1997; Arellano, 2000; Afandi et al., 2002 ). Although soil loss in coffee plantations does not generally surpass 5 Mg ha-1 year-1, the diversity of the vegetation vertical structure and the variants in management of the herbaceous plant cover can modulate this rate (Quiroz-Marín and Hincapié-Gómez, 2007; Pérez-Nieto et al., 2012). Under different levels of soil cover, loss rates oscillate between 0.0 and 2.7 Mg ha-1 year-1 in sun coffee (Afandi et al., 2003 ; Quiroz-Marín and Hincapié-Gómez, 2007) and between 0.42 and 2.02 Mg ha-1 year-1 in shade plantations (Arellano, 2000; Pérez-Nieto et al., 2005). However, in the former, the absence of herbaceous plant cover can cause erosion of up to 22 Mg ha-1 year-1 (Afandi et al., 2002 ).
These values, obtained from measurements in runoff plots equipped with collectors, vary in terms of measurement periods, plot size, number of replications, and types of management, making comparison of the results of the effect of plant cover in erosion control difficult. According to Boix-Fayos et al. (2006) other sources of variation affecting these results include the long term depletion of the material available for erosion in closed plots, erosive processes acting at different spatial and temporal scales, the heterogeneity, continuity and connectivity of detonating factors, and different measurement methods in the field. Of the two existing groups of methods (de Ploey and Gabriels, 1980; Hudson et al., 1993), volumetric methods use stakes and profilers to measure erosion indirectly, as the consequence of microtopographic wearing and sedimentation. Their main advantages are that they provide measurements with minimal error, cause little disturbance of the terrain, are easy to use in an experimental design with replications, and are cheap. In contrast, dynamic methods measuring the processes of runoff directly in runoff plots or micro-watersheds equipped with a system of collection tanks and dividers, cause more disturbance and require costly installations (Marín and Desir, 2003).
Management of cover near the soil in shade coffee plantations can reduce erosion from 19-185 Mg ha-1 year-1 to 0.0-3.4 Mg ha-1 year-1 (Sidle et al., 2006). Consequently, it is reasonable to suppose that chapeo (manual weed cutting with a machete) could help prevent erosion and thus contribute to greater crop sustainability and reduce plantation maintenance costs in the long term. In the state of Veracruz, however, increasingly more growers eliminate weeds with herbicides to decrease the labor costs of chapeo, without knowledge of the consequences of this practice on soil erosion and farm productivity. To date, there is insufficient understanding of the effect of the cover provided by the plantation’s different plant strata on soil erosion. Therefore, the objective of this study was, first, to measure erosion rates and analyze their relationship with tree, bush, herbaceous plant and litter cover, and second, to quantify the effect of traditional chapeo on erosion and compare it with herbicide use. The hypothesis was that tree and weed cover would reduce the rate of erosion and that management of the herbaceous plant stratum with herbicide would generate more erosion than chapeo.
Materials and Methods
Study area
The study was conducted on four farms in the region of Huatusco, state of Veracruz, between May 2012 and April 2013 (Figure 1). To reduce environmental variability, farms were selected according to their similarity in structure and management, as diversified or simple poly-cropping (Hernández-Martínez et al., 2009), the degree of soil erodibility (factor K), annual rainfall, and slope length and steepness (Factor LS) (Table 1).
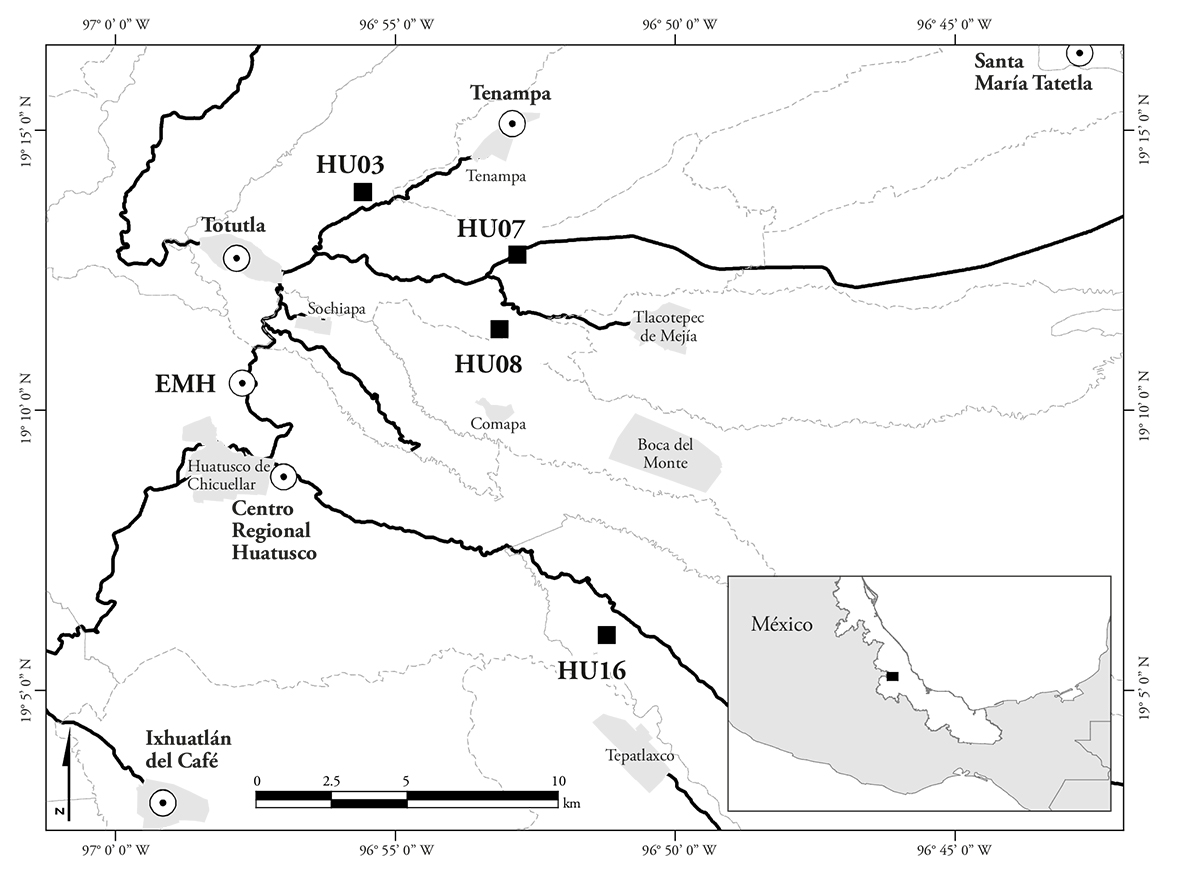
Figure 1 Location of the studied farms in central Veracruz. ■ farm; ○ weather station; EMH: weather station HUCH Huatusco.
The data used to characterize the soil and calculate erodibility (according to Römkens et al., 1997) were obtained in October and November of 2011 from two topsoil samples (0-20 cm) obtained near the measuring plots on each farm. The climate is type (A)C(m), warm with abundant summer rains (Soto and García, 1989), and the dominant soil is Andic acrisol (Geissert and Ibañez, 2008). Daily and historic precipitation data, during the study period were obtained from the HUCH Huatusco weather station (19° 10’ 29.2” N, 96° 57’ 44.8” W and 1426 m of altitude) (Figure 1), of INIFAP-SAGARPA ( http://clima.inifap.gob.mx/redinifap/est.aspx?est=35873). Total annual precipitation for each farm was estimated by spatial interpolation in ArcGis 10.1 using the precipitation recorded by the nine closest weather stations (Amatitla, El Coyol, Coscomatepec, Elotepec, Tenampa, Ixhuatlán del Café, Totutla, Chapingo Regional University Center Huatusco and Santa María Tatetla) from the same network.
Experimental design and treatments
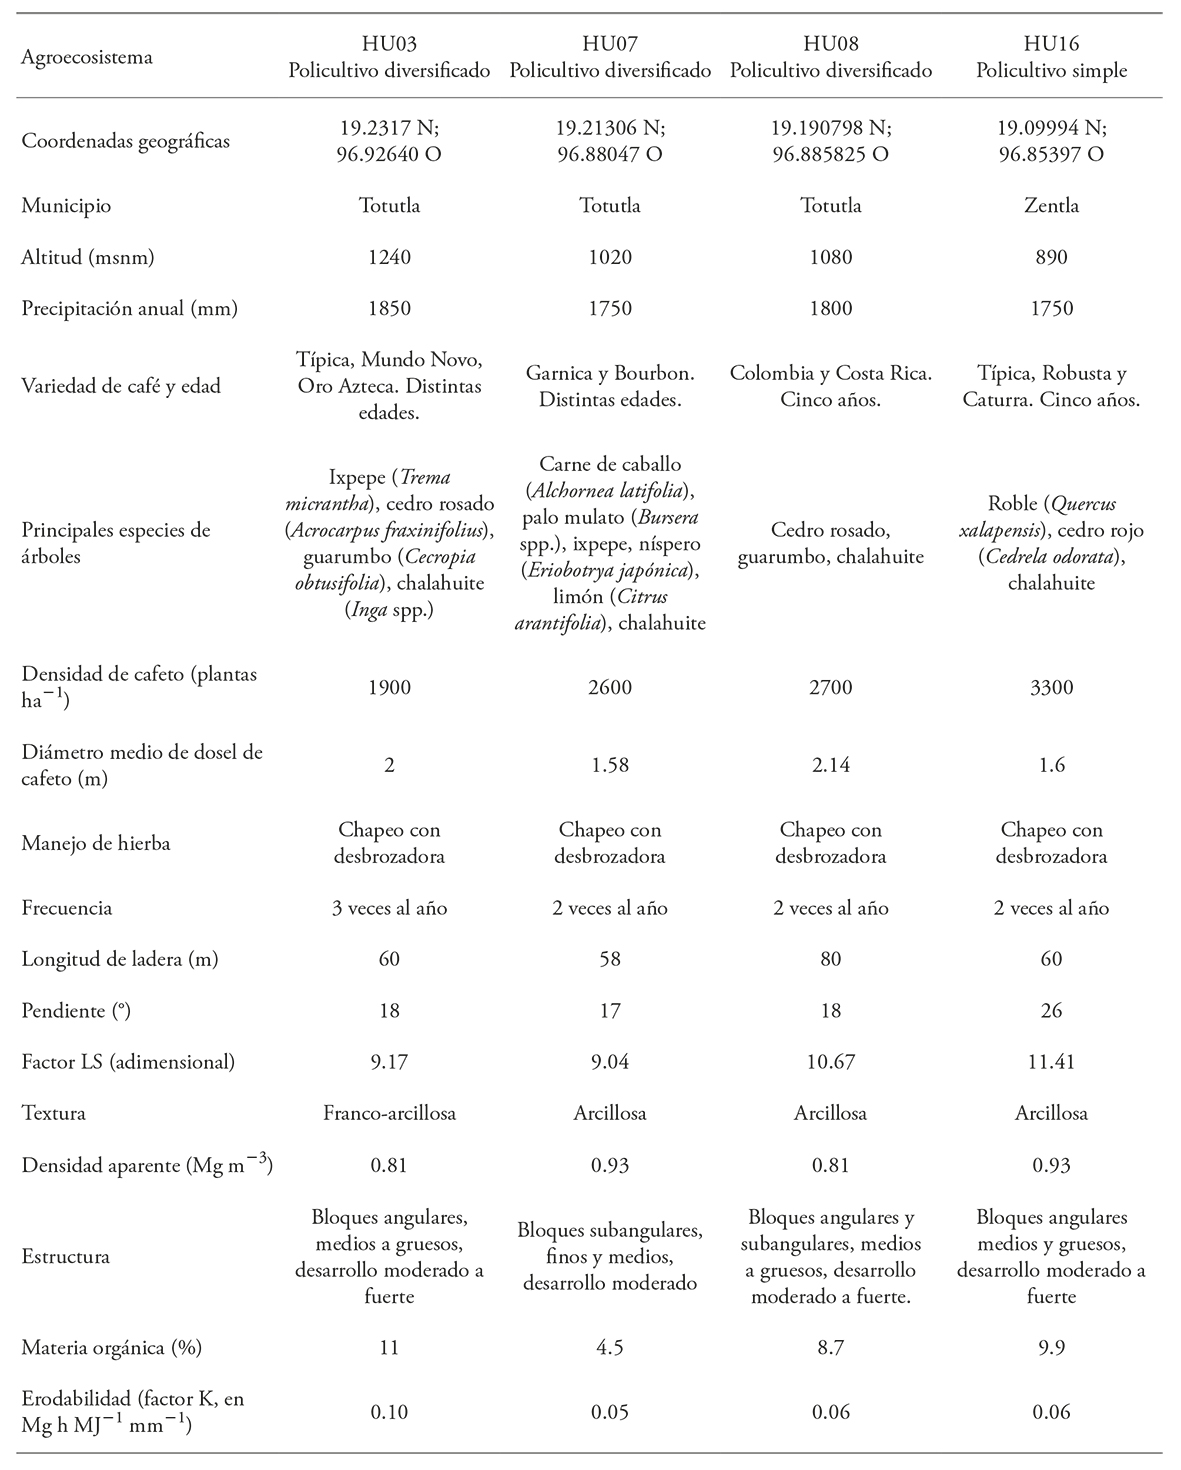
On each farm, three blocks were established, each consisting of three rectangular 8×4 m plots m (the longer sides parallel to the slope). A chapeo, herbicide, or control treatment was assigned randomly to each plot (Figure 2).
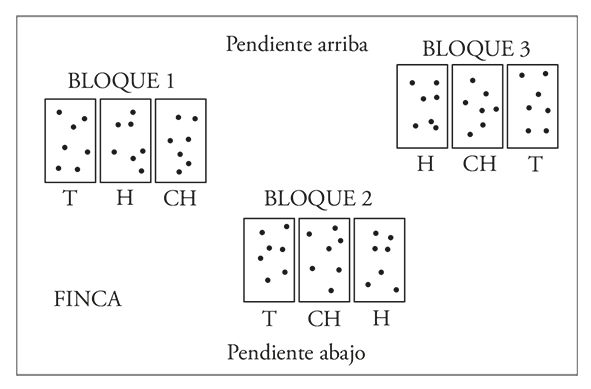
Figure 2 Experimental design of blocks and plots on farms. Treatments: T=control, H=herbicide, CH=chapeo. Black dots in each plot represent the stakes for measuring erosion.
Chapeo in May, July and October 2012 consisted of cutting weeds with a machete to 10 cm above ground level. Herbicide was applied once in July with a manual backpack sprayer in the same manner on the four farms. Granulated Rival® glyphosate (74.7 % glyphosate) was used (100 g dissolved in 30 L water, resulting in a dosage of 521 L ha-1). The control consisted of cutting weeds with a brush cutter or machete 5 cm from the ground according to each grower’s current practice.
Measurement of soil loss
To measure soil loss, 30 cm long, 0.5 cm diameter metal stakes treated with anticorrosive paint were used. A washer was soldered onto each stake 8 cm below the top edge. In each plot seven stakes, distributed to include herbaceous plant cover, litter, and bare soil, were hammered into the plot until the washer was at soil level. The stakes were installed in early May 2012 and were removed at the end of April 2013. The distance between the soil surface and the washer was measured on the downslope side of the stake with a digital Vernier with a precision of ±0.2 mm. In April 2013, a total of 63 registers of erosion were recorded, 21 in each treatment. Mean erosion per plot (E) was expressed in negative numbers (soil loss) and mean sedimentation (S) in positive numbers (soil accumulation). Net erosion (EN) refers to the difference between erosion and sedimentation, expressed in mm or in Mg ha-1 and was calculated for each plot as EN=E+S, a formula equivalent to that of Pizarro and Cuitiño (2002) when negative values of E are used with the following equalities:
The conversion in units of soil loss (Mg ha-1) was performed using bulk density (DA):
In each plot, the degree of ground cover (weeds, litter or bare soil) was determined using a visual percentage estimator (Folk, 1951) in March 2013. Tree cover was estimated at its peak in July 2012 using a spherical concave densitometer at a height of 1.20 m from the ground. For bush cover, the density of coffee plants per plot was calculated (number of plants per 32 m2).
Analysis of the relationship between plant cover and erosion
The effect of the types of ground cover and the treatments (chapeo, herbicide, and control) on net erosion was determined by adjusting a mixed linear model using maximum likelihood. The fixed variables of the model included the treatments, herbaceous plant cover (%), litter (%), and bare soil (%) recorded in March 2013 (the date on which there was greatest contrast among the treatments (with herbicide, chapeo and control), density of coffee plants per plot, and tree canopy cover. The random effect factors corresponded to the blocks of plots nested within farm.
The spatial structure of the sampling design did not allow us to perform a simple ANOVA since none of the observations contributed with a complete degree of freedom and random factors were included in the analysis. To find the minimal adequate model, a simplification process (Stepwise) was carried out, making comparisons between the models that progressively included and excluded the different fixed variables and their second order interactions. This was done to optimize the selection of the variables that explained the most variation and that were orthogonal, thus reducing redundancy in the final model (Crawley, 2007). To compare the nested models in the process of simplification, the parsimony criterion was used by comparing the Akaike Information Coefficient (AIC), for which the difference of each AIC (ΔCIA) relative to the maximum model was calculated. The selected model was that with the lowest number of explanatory variables and a ΔCIA lower than or equal to six, relative to the model with the highest ΔCIA (Cayuela, 2012; Richards, 2015). Data were analyzed using the R statistical language and environment (Studio 0.98.994, R Development Core Team, https://www.r-project.org).
Results and Discussion
Erosion rates
Rainfall was high during the study year (2392 mm), with 22.2 % more precipitation than the historical mean in Huatusco (1938 mm) (Figure 3). Total rainfall was distributed over 209 days. Most of the rainfall was concentrated in the months of June to August, when there were 13 days with more than 50 mm of rain. When the intervals of precipitation and erosivity of Pérez-Nieto et al. (2005) were applied to registers of the Huatusco weather station, 51 days between June and October were detected with more than 12.7 mm of rain (24.4 % of the total), which had an erosive effect.
Figure 3 Monthly precipitation recorded in the INIFAP HUCH Huatusco weather station located in the municipality of Huatusco, Veracruz.
Average net erosion in the control plots was -3.5 mm year-1, equivalent to soil loss of -33.5 Mg ha-1 year-1. The high variability (standard error -38.6 Mg ha-1 year-1) (Table 2) corroborates that erosion has multiple causes related to the complexity of the interactions among variables (Boix-Fayos et al., 2006). The runoff responsible for the erosion was mostly laminar (sheet erosion) and occasionally in small furrows (rill erosion).
Table 2 Net erosion (negative) and net sedimentation (positive) by farm and by treatment with the respective standard error.
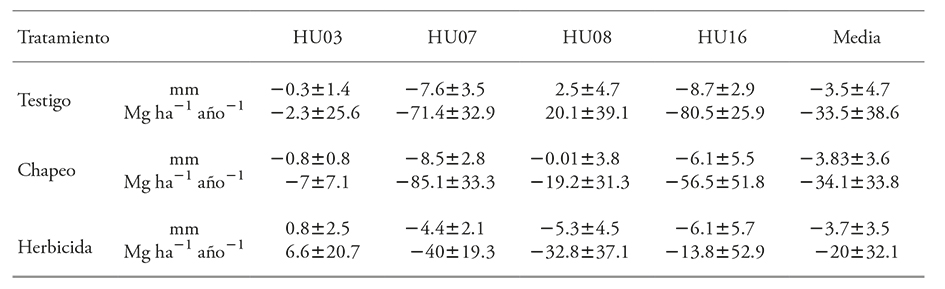
Of the farms with net erosion, HU03 had the lowest rate despite having a higher degree of soil erodibility than the others (Table 1). Farm HU16 had the highest erosion rate, possibly related to a steeper slope. On HU08 there was net sedimentation, resulting from transit of soil particles and aggregates and their accumulation in the plots. Previous studies in shade coffee plantations never reported net sedimentation because the measurements were made in runoff plots, from which an overall value for soil loss was obtained so that there was no possibility of quantifying accumulation within the plots. Farm HU07 had a high rate of erosion, as did HU16, which had similar conditions of precipitation and erodibility despite a less steep slope.
Erosion rates on farms HU07 and HU16 surpassed the maximum tolerance limit of 12.5 Mg ha-1 year-1 established by the US Soil Conservation Service (Soil Survey Division Staff, 1993) for deep soils that are less susceptible to erosion. However, it is preferable to fix tolerance limits based on sustainable crop production, which takes into account conservation of organic matter and nutrients (Young, 1989). In this regard, using the degrees of erosion in sun and shade coffee production systems established by Columbia’s Centro Nacional de Investigaciones de Café (Cenicafé) (Gómez-Aristizábal and Rivera-Posada, 1993), farms HU07 and HU16 surpassed the maximum tolerance limit of 3 Mg ha-1 year-1, and erosion was very severe (>30 Mg ha-1 year-1). In contrast, the degree of erosion was very low (1.0-3.0 Mg ha-1 year-1) on HU03 and natural (<1.0 Mg ha-1 year-1) on HU08. These results show that soil loss by erosion in shade coffee plantations is not always below 5 Mg ha-1 year-1, as reported by Ataroff and Monasterio (1997), Arellano (2000) and Pérez-Nieto et al. (2005). The high values on HU07 and HU16 may be overestimates since measurements were taken on the slope directly below the stake. Here, water runoff around the stake increases turbulence even with 5 mm thick stakes. However, taking measurement downslope from stakes is a procedure that should adequately simulate the erosion process that occurs on farms located on sloping terrains where, according to our own observations, erosion often begins at the base of the coffee plant trunks. The possible overestimation of erosion with the stake technique, relative to measurements from sediment collectors, is a methodological problem that has yet to be solved (Marín and Desir, 2003).
Effects of plant covers and their management on erosion
The mixed linear model revealed that, of the possible ground covers (weeds, litter, bare soil), only weeds had an effect on erosion rate. The second fixed explanatory variable was tree cover (% canopy). The final fixed factor model was:
Net erosion
The Akaike Information Coefficient was 236.68, with a ΔCIA of 3.57, relative to the model with the lowest AIC and -17.84, relative to the maximum AIC (Table 3). The estimated variance from random factors was 1.592 (with CI95% 0.32-0.82) and residual 2.52 (with CI95% 3.04-5.28).
Table 3 Mixed effect models that explain erosion and that, in the process of model simplification had a ΔCIA (difference from the minimum AIC) below or equal to 6.
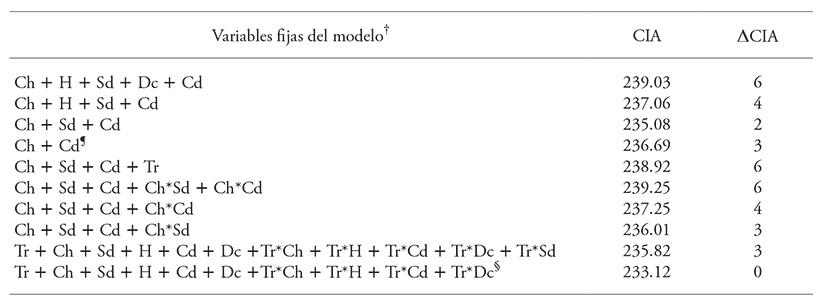
†Only fixed variables of the contrasted models are mentioned: Treatment (Tr), weed cover (Ch), litter (H), bare soil (Sd) and coffee plant density (Dc) in March 2013, canopy cover (Cd) in July 2012. The random factors remained constant and were Farm nested in Block. ¶Models were selected for their better explanatory power, their lower number of fixed variables and ΔCIA below 6. §Model that during the model simplification process had the minimum AIC.
The model estimated an average erosion in the study plots of 19.56 mm (CI95% 1.5-37.7 mm). With more weed cover, there was less erosion, and in some cases even sedimentation (Figure 4), although herbaceous plant cover was a fairly poor explanatory variable (slope 0.06; CI95% -0.01-0.12). Canopy cover had greater influence but opposite to that of weed cover (Figure 5), with more tree cover leading to more erosion (slope -2.28; with CI95% -0.28-0.49), perhaps due in part to the increase in the erosive effect of the larger drops that run off leaves versus those falling as precipitation (Nanko et al., 2004) and the negative effect of shade on weed cover.
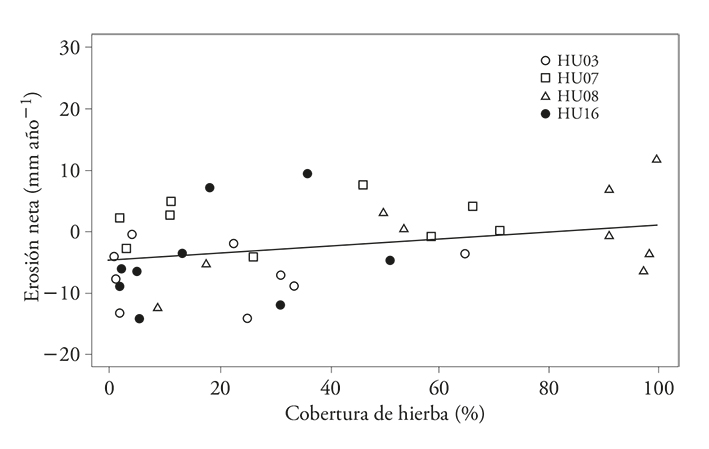
Figure 4 Effect of weed cover on net erosion. The continuous line indicates values estimated from the mixed linear model. Each dot represents mean net erosion (negative) of seven stakes per plot.
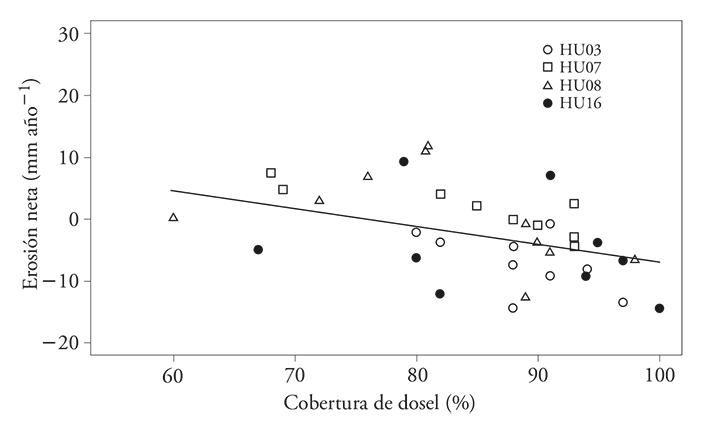
Figure 5 Effect of shade on net erosion. The continuous line indicates values estimated from the mixed linear model. Each dot represents mean net erosion (negative) of seven stakes per plot.
The combined effect of tree, bush, herbaceous plant, and litter cover on variation in soil loss is complex. On a shade coffee farm in north-central state of Veracruz, Pérez-Nieto et al. (2012) determined that only bush and litter cover had a reducing effect on soil loss. Their analysis was done using individual cover types, and soil loss was measured in microcatchments with a surface runoff sampler and no replication. Their results differ from the erosion model obtained in our study, which showed that only the combined effect of tree and weed cover had an influence on erosion. Our model indicates that a tree canopy cover of ≤60 % would not cause erosion even when the herbaceous plant stratum is absent. In this case, it would make no difference in erosion whether weed control was done with chapeos or with herbicide. However, under an 80 % canopy a 40-50 % increase in weed cover would reduce erosion four fold (from 0.76 mm year-1 to 0.18 mm year-1), and with 60 % cover erosion should stop altogether. Under these two scenarios, it would be recommendable to maintain or increase weed cover.
The mixed linear analysis did not detect statistically significant differences between net erosion values and the herbicide, chapeo, or control treatments. Thus, conducting more tests of means was not necessary since this factor did not help to explain the variability in net erosion. The herbicide treatment, in particular, had no conclusive effect on net erosion after one year of measurement. After application in July, weeds died within a week with plants continuing to lose leaves in September. By December they had begun to grow again, and in March 2013, just before removing the stakes, weed cover was on average 18 % in herbicide treated plots, 45 % in chapeo plots, and 42 % in the control plots. By the end of the year, and compared with the controls, the herbicide application had produced an increase in net erosion only in HU08 plots (from 2.5 mm to -5.3 mm). On the other farms, there was a decrease in erosion (HU07 and HU16) and even some sedimentation (HU03) (Table 2). At this latter site, transport of particles and aggregates by runoff was stopped by dead shoots of weeds scattered over the surface of the plot, thus favoring sedimentation. These conclusions are similar to those reported by Carvalho et al. (2007) for sun coffee plantations with different treatments of herbaceous plant cover. The sites treated with herbicide had intermediate erosion values, compared to those of weed cover management and bare soil, due to the protective effect of the dead plants on the soil surface. In a shade plantation in Costa Rica, it took nine applications of glyphosate (Roundup 35,6L) over two years for soil loss to reach 0.33 Mg ha-1 year-1 (Gómez, 2005). Thus, repeated applications of herbicides during the same year on farms in Veracruz should also increase erosion rates beyond those observed in our study.
The results obtained in our study are valid only for the environmental and management conditions of the farms studied: annual precipitation of 1750 to 1850 mm, soil erodibility K factor 0.05 to 0.10, slope LS factor 9.04 to 11.41, canopy cover >60 %, coffee plant density 1900 to 3300 ha-1, and litter cover ≥90 %. Nevertheless, the study contributes to knowledge of erosion in multi-stratified shade coffee plantations by demonstrating spatial variation in erosion is due to erosive and sedimentation processes and the influence of management of plant cover at the soil level. However, improving our understanding of the causes and magnitude of erosion with the stake technique would require extending the study to a period of three to five years since soil erosion also varies over time (Afandi et al., 2002 ; Verbist et al., 2010). Additionally, a larger number of farms and plots should be included to encompass broader environmental variation since the lithological and edaphic sensitivity of a site is even more important to erosion than the age of the coffee plantation or the presence of shade trees (Verbist et al., 2010). We should also note that measuring soil erosion with stakes is a procedure recommended at the plot scale when laminar processes and diffuse runoff dominate. However, this method may not be adequate under conditions of rill erosion or when extrapolating measurements to the watershed scale where erosion in gullies and landslides occur. In any event, management of plant cover is the simplest means of controlling erosion in shade coffee plantations on slopes. Therefore, integrated weed management (Quiroz-Marín and Hincapie-Gómez, 2007), as well as the careful selection of tree, bush and herbaceous species (Sidle et al., 2006), is recommended.
Conclusions
This study on soil erosion measured in shade coffee plots using the stake technique showed that only herbaceous plant and tree covers explained variation in net erosion, according to mixed linear models. The combined effect of the two covers reduced the rate of erosion when herbaceous plant cover increased and tree cover decreased. Coffee bush and litterfall cover had no significant effect. Average net erosion in control plots with traditional manual weed cutting was higher than expected for this type of agroecosystem. Application of herbicide produced an increase in erosion on one farm, but we cannot conclude that this management practice, or that of chapeo, generated more erosion than the controls. Besides, the processes of erosion and sedimentation are common in shade coffee plantations.
Literatura Citada
Afandi M., T. K., B. Rosadi, M. Utomo, M. Senge, T. Adachi, and Y. Oki. 2002. Erosion under coffee trees with different weed managements in humid tropical hilly area of Lampung, South Sumatra, Indonesia. J. Jap. Soc. Soil Physics 91: 3-14. [ Links ]
Afandi M., T. K., B. Rosadi, M. Utomo, M. Senge, T. Adachi, and Y. Oki. 2003. An evaluation of coffee crop factor under different weed managements using USLE method in hilly humid tropical area of Lampung, South Sumatra, Indonesia. J. Jap. Soc. Soil Physics 93: 21-33. [ Links ]
Arellano G., R. 2000. Pérdida de suelo y nutrientes en agroecosistemas de café en la subcuenca del río Castán, Trujillo-Venezuela. Forest 44: 79-86. [ Links ]
Ataroff, M., and M. Monasterio. 1997. Soil erosion under different management of coffee plantations in the Venezuelan Andes. Soil Technol. 11: 95-108. [ Links ]
Boix-Fayos C., M. Martínez-Mena, E. Arnau-Rosalén, A. Calvo-Cases, V. Castillo, and J. Albaladejo. 2006. Measuring soil erosion by field plots: Understanding the sources of variation. Earth Sci. Rev. 78: 267-285. [ Links ]
Carvalho, R., M. L. Naves S., J. C. Avanzi, N. Curi, and F. Silva de Souza. 2007. Water erosion in red latosol under diverse coffee plant management systems at South of Minas Gerais State, Brazil. Ciênc. Agrotec., Lavras 31: 1679-1687. [ Links ]
Cayuela, L. 2012. Modelos lineales mixtos (LMM) y modelos lineales generalizados mixtos (GLMM) en R. Universidad Rey Juan Carlos. España. 65 p. [ Links ]
Crawley, M. J. 2007. The R book. John Wiley and Sons. 950 p. [ Links ]
Folk, R. L. 1951. A comparison chart for visual percentage estimation. J. Sedim. Res. 21: 32-33. [ Links ]
Geissert, D., y A. Ibañez. 2008. Calidad y ambiente físico-químico de los suelo. In: Manson R., V. Hernández-Ortiz, S. Gallina, y K. Mehltreter (eds). Agrosistemas Cafetaleros de Veracruz: Biodiversidad, Manejo y Conservación. Cap. 15. Instituto de Ecología, A.C. e Instituto Nacional de Ecología (INE-SEMARNAT), México. pp: 213-221. [ Links ]
Gómez G., R. 2005. Efecto del control de malezas con paraquat y glifosato sobre la erosión y pérdida de nutrientes del suelo en cafetos. Agron. Mesoam. 16: 77-87. [ Links ]
Gómez-Aristizábal A., y H. Rivera-Posada. 1993. La conservación de los suelos y la sostenibilidad de la productividad en la zona cafetera. Avances Técnicos 190, Cenicafé, Colombia, 8 p. [ Links ]
Hernández-Martínez, G., R. H. Manson, and A. Contreras H. 2009. Quantitative classification of coffee agroecosystems spanning a range of production intensities in central Veracruz, Mexico. Agric. Ecosys. Environ. 134: 89-98. [ Links ]
Hudson, N. W. 1993. Field measurement of soil erosion and runoff. FAO Soils Bulletin No. 68, FAO, Rome. 153 p. [ Links ]
Marín C., y G. Desir. 2003. Comparación entre distintas técnicas para la determinación de la pérdida de suelo. Bardenas Reales (Navarra). Edafología 10: 215-225. [ Links ]
Manson, R.H., A. Contreras H., y F. López-Ibarra. 2008. Estudios de la biodiversidad en cafetales. In: Manson R., V. Hernández-Ortiz, S. Gallina, y K. Mehltreter (eds). Agrosistemas Cafetaleros de Veracruz: Biodiversidad, Manejo y Conservación. Cap. 1. Instituto de Ecología, A.C. e Instituto Nacional de Ecología (INE-SEMARNAT). México. pp: 1-14. [ Links ]
Moguel, P., y Toledo, V. M. 2004. Conservar produciendo: biodiversidad, café orgánico jardines productivos. Biodiversitas 55: 1-7. [ Links ]
Moguel, P., y Toledo, V. M. 1999. Biodiversity conservation in traditional coffee systems of Mexico. Conservation Biol. 1: 11-21. [ Links ]
Nanko, K., N. Hotta, and M. Suzuki. 2004. Assessing raindrop impact energy at the forest floor in a mature Japanese cypress plantation using continuous raindrop-sizing instruments. J. For. Res. 9: 157-164. [ Links ]
Pérez-Nieto, J., E. Valdés-Velarde, y V. M. Ordaz-Chaparro. 2012. Cobertura vegetal y erosión del suelo en sistemas agroforestales de café bajo sombra. Terra Latinoam. 30: 249-259. [ Links ]
Pérez-Nieto, J., E. Valdés-Velarde, M. E. Hernández-San Román, y V. Ordaz-Chaparro. 2005. Lluvia, escurrimiento superficial y erosión del suelo en sistemas agroforestales de café bajo sombra. Agrociencia 39: 409-418. [ Links ]
Pérez-Portilla, E., y D. Geissert-Kientz. 2006. Zonificación agroecológica de sistemas agroforestales: el caso café (Coffea arabica L.)-palma camedor (Chamaedorea elegans Mart.). Interciencia 31: 556-562. [ Links ]
Pimentel, D., and N. Kounang. 1998. Ecology of soil erosion in ecosystems. Ecosystems 1: 416-426. [ Links ]
Pizarro, R., y H. Cuitiño. 2002. Método de evaluación de la erosión hídrica superficial en suelos desnudos en Chile. Cuadernos de la Sociedad Española de Ciencias Forestales. Actas de la I Reunión del Grupo de trabajo de Hidrología Forestal. Madrid, España. pp: 165-170. [ Links ]
Ploey, de, J. and D. Gabriels. 1980. Measuring soil loss and experimental studies. In: Kirkby M. J., and R. P. C. Morgan (eds). Soil erosion. Wiley-Interscience Public., John Wiley and Sons. pp: 63-108. [ Links ]
Quiroz-Marín, T., y E. Hincapié-Gómez. 2007. Pérdidas de suelo por erosión en sistemas de producción de café con cultivos intercalados. Cenicafé58: 227-235. [ Links ]
Richards, S. A. 2015. Likelihood and model selection. In: Fox, G. A., S. Negrete-Yankelevich, V. J. Sosa (eds). Ecological Statistics: Contemporary Theory and Application. Oxford University Press. pp: 58-80. [ Links ]
Rosas-Arellano, J., E. Escamilla-Prado, y O. Rosado-Ruiz. 2008. Relación de los nutrimentos del suelo con las características físicas y sensoriales del café orgánico. Terra Latinoam. 26: 376-376. [ Links ]
Römkens, M. J. M., R. A. Young, J. W. A. Poesen, D. K. McCool, S. A. El-Swaify, and J. M. Bradford. 1997. Soil Erodibility factor (K). In: Renard, K. G., G. R. Foster, G. A. Weesies , D. K. McCool, D. C. Yoder (coord.). Predicting Soil Erosion by water: A guide to conservation planning with the Revised Universal Soil Loss equation (RUSLE). Chap. 3. Agriculture Handbook No. 703. U.S. Department of Agriculture, USA. pp: 65-99. [ Links ]
SIAP-SAGARPA. 2015. Servicio de Información Agroalimentaria y Pesquera. Secretaría de Agricultura, Ganadería, Desarrollo Rural, Pesca y Alimentación: http://www.siap.gob.mx/cierre-de-la-produccion-agricola-por-estado/ (Consultado: Julio 2015). [ Links ]
Sidle, R., A. D. Ziegler, J. N. Negishi, A. R. Nik, R. Siew, and F. Turkelboom. 2006. Erosion processes in steep terrain-Truths, myths, and uncertainties related to forest management in Southeast Asia. Forest Ecol. Manage. 224: 199-225. [ Links ]
Soto, M., y E. García. 1989. Atlas Climático del Estado de Veracruz. Instituto de Ecología A. C., México. 125 p. [ Links ]
Soil Survey Division Staff. 1993. Soil Survey Manual. Soil Conservation Service. U.S. Department of Agriculture. Handbook No. 18. Chap. 6. Washington, D.C. 34 p. [ Links ]
Verbist, B., J. Poesen, M. van Noordwijk, D. Suprayogo, F. Agus, and J. Deckers. 2010. Factors affecting soil loss at plot scale and sediment yield at catchment scale in a tropical volcanic agroforestry landscape. Catena 80: 34-46. [ Links ]
Young, A. 1989. Agroforestry for soil conservation. ICRAF Science and Practice of Agroforestry No. 4. CAB International, UK. 276 p. [ Links ]
Received: April 2016; Accepted: July 2016
 Este es un artículo publicado en acceso abierto bajo una licencia
Creative Commons
Este es un artículo publicado en acceso abierto bajo una licencia
Creative Commons
