


Servicios Personalizados
Revista
Articulo
 Inglés (pdf)
 Artículo en XML
 Referencias del artículo
 Enviar artículo por email
Indicadores
-
 Citado por SciELO
 -
 Accesos
Links relacionados
-
 Similares en
SciELO
Similares en
SciELO
Compartir

 Permalink
Agrociencia
versión On-line ISSN 2521-9766versión impresa ISSN 1405-3195
Agrociencia vol.49 no.3 Texcoco abr./may. 2015
Biotecnología
Genetic variability and diversity of mutant rice revealed by quantitative traits and molecular markers
Variabilidad genética y diversidad de mutantes de arroz, reveladas por características cuantitativas y marcadores moleculares
Yusuff Oladosu1, Mohd Y. Rafii1,2*, Norhani Abdullah1,3, Mohammad Abdul Malek1,4, Harun A. Rahim5, Ghazali Hussin6, Mohd Razi Ismail1, Mohammad Abdul Latif 2,7, Isiaka Kareem1
1 Institute of Tropical Agriculture.
2 Department of Crop Science, Faculty of Agriculture. * Author for correspondence.
3 Departament of Biochemistry, Faculty of Biochemistry and Biomolecular Science. Universiti Putra Malaysia, 43400 UPM Serdang, Selangor, Malaysia. (mrafii@upm.edu.my).
4 Bangladesh Institute of Nuclear Agriculture, Mymensingh-2202, Bangladesh.
5 Bioscience and Agrotechnology Division, Malaysian Nuclear Agency, Bangi, 43000 Kajang, Selangor, Malaysia.
6 Strategic Livestock Research Centre, Malaysian Agricultural Research and Development Institute (MARDI), Kluang, Johor, Malaysia.
7 Bangladesh Rice Research Institute (BRRI), Gazipur, Dhaka, Bangladesh.
Received: May, 2014.
Approved: March, 2015.
Abstract
Genetic variability with mutagenic agents has been employed in plant breeding due to its significant contribution to the improvement of the existing rice genotypes by using genetically diverse parents. This study evaluated the genetic variability and diversity of mutant rice using quantitative traits and inter-simple sequence repeats (ISSR) molecular markers. A field experiment was carried out on M5 generation of 31 developed mutant lines and their parent (control). Morphological traits and 25 ISSR molecular markers were used as tools for determining cultivar identities and genetic diversity. The selected primers generated 443 clear polymorphic bands with an average number of 18 per primer. The bands were 85.10 % polymorphic. Un-weighted Pair Group of Arithmetic Means (UPGMA) with similarity coefficients were used for cluster analysis. Through this, all the genotypes were grouped into six clusters. It was shown that crosses between MR219-ML8 and MR219-ML22 could be done for development of high yielding varieties. Also, these mutants could be used as donor parents in rice breeding programs and some can be recommended as new rice varieties suitable for rice cultivation in Malaysia.
Keywords: Plant breeding, genetic diversity, molecular marker, mutagenicity, polymerase chain reaction (PCR).
Resumen
La variabilidad genética con agentes mutagénicos se ha usada en el cultivo de plantas debido a su contribución significativa a la mejora de los genotipos existentes de arroz a través de padres genéticamente diversos. En este estudio se evalúo la variabilidad y diversidad de mutantes de arroz mediante rasgos cuantitativos y marcadores moleculares de inter-secuencias simples repetidas (ISSR). El estudio se realizó en campo, en la generación M5 de 31 líneas mutantes desarrolladas y su padre (testigo). Características morfológicas y 25 marcadores ISSR se utilizaron como herramientas para determinar las identidades y diversidad genética de los cultivares. Los iniciadores seleccionados generaron claras 443 bandas polimórficas claras con un número promedio de 18 bandas por iniciador. Las bandas fueron 85.10 % polimórficas. El método no ponderado de pares de grupo de medias aritméticas (UPGMA) con coeficientes de similitud se usó para el análisis de los grupos. Mediante esto, todos los genotipos se agruparon en seis grupos. Las cruzas entre MR219-ML8 y MR219-ML22 podrían generarse para desarrollar variedades de alto rendimiento. Además, estos mutantes se pueden usar como padres donadores en programas de mejoramiento de arroz y algunos pueden recomendarse como variedades nuevas de arroz adecuadas para su cultivo en Malasia.
Palabras clave: Mejoramiento de plantas, diversidad genética, marcador molecular, mutagenicidad, reacción en cadenas de la polimerasa (PCR).
Introduction
Rice varieties are subjected to mutagenesis because the crop is the world's leading food and most consumed staple (Sharma and Singh, 2013). The frequency of spontaneous mutation occurring in nature is very low and because it is difficult for plant breeders to use spontaneous mutations in plant breeding programmes, they utilize induced mutation (Haussmann and Parzies, 2009). The purpose of induced mutations is to increase the frequency of improving the plant varieties and developing new ones. Such developments and improvements could come through direct use of a mutant line by physical or chemical mutagenesis, or indirect use of a mutant line which is utilized as a parental variety in cross breeding (crosses between mutant lines or with commercial varieties) for the release of semi-dwarf and high yielding varieties (Baloch et al., 2003; Qayyoum et al., 2000).
The estimation of genetic diversity differences between genotypes is a first step in plant breeding and it requires knowing the amount of genetic diversity present in the candidate populations for starting the programme. DNA marker technology is readily available for evaluating genetic variability and relatedness among crop germplasm in rice varieties (Shah et al., 2013), because it provides very effective and reliable tools for measuring genetic diversity in crop germplasm and studying evolutionary relationships. DNA markers can reveal differences among the genotypes at molecular level because they yield information to deciding the distinctiveness of species and their ranking, according to the number of close relatives and phylogenetic positions.
Molecular markers used in rice breeding include Restriction Fragment Length Polymorphisms (RFLPs), Diversity Array Technology (DArT), Inter Simple Sequence Repeat (ISSR), RandoμLy Amplified Polymorphic DNA markers (RAPDs), Simple Sequence Repeat (SSR) or Microsatellites, Amplified Fragment Length Polymorphisms (AFLPs), and they assist in genetic and breeding researches. Inter-simple sequence repeats (ISSRs) are the regions that lie within microsatellite repeats and offer great potential for determining intra- and inter-genomic diversity compared to other arbitrary primers because they reveal variations within unique regions of the genome at several loci simultaneously (Zietkiewicz et al., 1994). Therefore, ISSR markers are used for characterization of germplasm (Charters and Wilkinson, 2000), estimating the level of genetic diversity between and within crop species (Ajibade et al., 2000), to identify DNA markers closely linked to specific agronomic traits of interest (Levin et al., 2000), determining the distribution of microsatellites in the genome (Pasakinskiene et al., 2000), and for evaluating differences among closely related cultivars and varieties (Prevost et al., 1999). Information is needed about maximizing parental selection to broaden the germplasm base of rice breeding programmes. Therefore, this study was carried out to evaluate genetic variability and diversity of mutant rice using quantitative traits and ISSR molecular markers.
Materials and Methods
Development and selection of mutant lines
Because MR219 is the rice variety covering almost 90 % of the cultivated areas in Malaysia (Bashar et al., 2014), efforts are made to increase its yield. Therefore, seeds were sent to Japan for radiosensitivity determination through ion beam irradiation, and 100 seeds were subjected to 0, 10, 20, 40, 60, 80, 100, 120, 160, and 200 Gray (Gy) to determine the optimum doses for the production of high mutant frequency and spectrum, which was 60 Gy. The M1 seedlings were transplanted into the field with 25 cm × 25 cm planting distance; 10 000 M1 seedlings were planted to produce M2 seeds and from 5,250 selected plants two panicles per hill were randoμLy harvested. About 5 % of M2 populations were selected for screening in M3. After series of selection and fixation, 31 potential lines with the required adaptive traits were recovered at M4 generation during the 2009-2012 seasons (M0-M4). For our study, 32 genotypes containing 31 mutant lines derived from MR219 (Ibrahim et al., 2013) and MR219 parent variety were evaluated in two locations.
Experimental sites
This study was carried out at the experimental station of the University Putra Malaysia, Serdang, Selangor, Malaysia, located at 3° 02' N, 101° 42' E. Another replication was carried out on farmers' field at Melor, Kelantan, Malaysia, located at 5° 58' N, 102° 17' E. During the growing seasons, monthly average maximum and minimum temperature and relative humidity were 33.5 °C, 21.5 °C and 92.5 %, respectively; rainfall, evaporation and sunshine hours were 9.8 mm d-1, 4.6 mm d-1, and 6.6 h d-1 respectively.
Plant materials, crop management and experimental design
The 31 developed mutant lines along with un-irradiated parent (control) were planted in a nursery and 28 d old seedlings were transplanted into puddled fields at 25 cm × 30 cm spacing in 32 rows of 7 m length and 30.8 m width. The periods of cultivation were February to June 2013 and December 2013 to April 2014. The experimental design was randomized complete block (RCB) with three replications.
Cultural practices
Throughout the experimental period the field was kept weed free, by weeding it every three weeks until harvesting. NPK fertilizer was 80-60-40 kg ha-1: P and K were applied as a single dose at transplanting, whereas N was applied at 15, 35, 55, and 75 d after transplanting.
Data collection
Data were collected by sampling five plants in the middle of the rows with exclusion of the plot border rows. The traits of M5 measured were plant height, days to maturity, number of effective tillers, total number of grains per panicle, total grain weight per hill, 100 grain weight, seed length/width ratio, yield per plant and yield per hectare.
Molecular markers
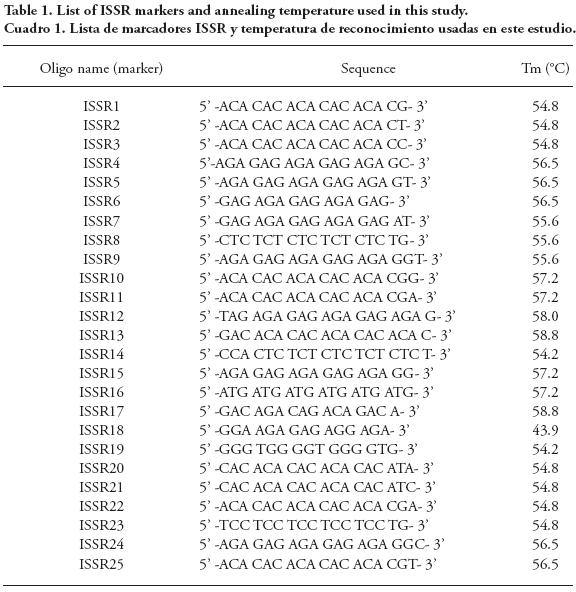
Twenty five ISSR primers with clear amplifications were selected for the genetic diversity study of genotypes (Table 1).
DNA extraction
DNA was extracted from young leaves of rice plants using the CTAB method (Doyle, 1990) with minor modifications. The crude DNA (pellet form) was washed with 75 % ethanol, dissolved in 50 μL TE buffer and treated with RNAse. The quality of the extracted DNA was checked using spectrophotometer (Nanodrop).
Amplification and electrophoresis
PCR was optimized to 15 μL with reaction mixture containing 1 μL with 60 ng of template DNA, 7.5 μL of PCR master mix (PCR master mix-2X containing 0.06U μL of Taq DNA polymerase, 3 mM MgCl2 and 400 μM of each dNTPs)(Product code # BIO-5180-1000, from 1st BASE Company, Science Park Road, Singapore), 1 μL ISSR primer and 5.5 μL nuclease free water (double-distilled water) using a PCR machine (My cycler thermo cycler, BIO RAD, Watertown, Massachusetts, USA). Touch down PCR protocol was followed in this experiment (Korbie and Mattick, 2008), which included three phases. The temperature was adjusted to 95 °C for 3 min before the first phase. In the first phase temperature and duration were respectively 95 °C for 30 s for denaturation, Tm +10 °C for 45 s for annealing and 72 °C for 60 s for elongation. In the second phase the temperature and duration were respectively 95 °C for 30 s for denaturation, Tm -5 °C for 45 s for annealing and 72 °C for 60 s for elongation. In the third phase, the temperature and duration were adjusted to 72 °C for 5 min for elongation. Phases 1 and 2 were repeated 10 and 20 times, respectively. Five microliters (5 μL) of each PCR product was mixed with DNA loading dye, loaded on an agarose gel (1.8 %w/v) and run at 90 V for 90 min in 1× TBE buffer. Band pattern was documented using an UVPRO Alpha Innotech gel documentation unit.
Data analysis
The data were analyzed using ANOVA with SAS 9.1 (SAS, 2002). Cluster analysis was performed with quantitative data for grouping similar accessions using NTSYS-PC 2.1. with two algorithms: Un-weighted Pairing Group Method with arithmetic averages (UPGMA), and SAHN clustering method. First, quantitative data were standardized using the software STAND and the Jaccard similarity coefficient was calculated with the quantitative database. The fitting between the distance matrix and the dendrogram was estimated by using a cophenetic correlation coefficient (r) (Sokal and Rohlf, 1962) through NTSYS pc 2.1 software (Rohlf, 2000). The average genetic distance was used as a cut-off value for the description of the clusters. Distances were later used for principal component analysis (PCA).
Band scoring and data analysis
Genotypes were scored for the presence or absence of the ISSR bands utilizing UVIDoc version 99.02. The bands scored were those reproducible and above 100 bp in length and the data were entered into a binary matrix as 1 (present) and 0 (absent). Similar bands were assumed as representative of the same locus. The Excel file containing the binary data was imported into NT Edit of NTSYS-pc 2.02J. The 0/1 matrix was then used to calculate similarity as DICE coefficient using SIMQUAL subroutine in SIMILARITY routine. The genetic similarity was transformed to genetic dissimilarity with the equation:

where Dij: genetic distance for each genotype pair (i and j), and Sij: genetic similarity for each genotype pair (i and j).
Based on the dissimilarity matrix generated, a dendrogram was obtained using the UPGMA clustering procedure. The adjustment between the dissimilarity matrix and the dendrogram was estimated by the cophenetic correlation coefficient (r) according to Sokal and Rohlf (1962). The average genetic distance was used as cut-off value to define genotype clusters. In addition, the evolved score matrix was employed for analyzing effective number of alleles (Ne), Nei's gene diversity (H) and Shannon information index (I) using POPGENE (version 1.31) software. NTSYS-PC Mantel test was used to determine the correlation between quantitative traits and molecular data.
Results and Discussion
Morphological analysis
The data presented in Table 2 represent the mean performance of the tested entries for agronomic traits in two locations. Results showed that all tested genotypes including MR219 (parent) and its new derived mutants were statistically different from one another (p ≤ 0.01) in their days to maturity, yield and yield components with the exception of 100 grain weight. Days to maturity in mutants were significantly shorter than that of the parent with the exception of lines MR219-ML7 and MR219-ML26. The days to maturity recorded for the 31 derived mutants ranged between 107 d in MR219-μL04 to 116 d in MR219-ML7 and MR219-ML26. The shorter life cycle and variability displayed in other traits reflects the likelihood of having significant improvement of important agronomic traits in rice using mutation breeding. It is worth noting that most of the derived mutants showed better performance than MR219 in days to maturity, numbers of effective tillers, total number of grains per panicle, total grain weight per hill, seed length to width ratio and yield per hectare. Thus, the results showed a considerable amount of variation at the morphological level and the significance of mutation breeding for enhancing genetic variability in breeding programmes. Since mutation breeding enhances the quantitative traits of rice genotypes (Saleem et al., 2005, Shehata et al., 2009, Babaei et al., 2011 and Gomma et al., 1995), we conclude that mutation breeding is a welcoming tool for betterment of rice productivity without denying other methods for the achievement of the same objective.
Diversity assessment using quantitative traits
Genetic divergence analysis among the rice genotypes on the basis of quantitative traits plays a part in the selection of the diverse genotypes for further improvements of the rice varieties through breeding (Shahidullah et al., 2009). The diversity analysis using quantitative traits is a traditional approach (Kaw, 1995), but it can be used in classifying and differentiating different genotypes or species in a population (Franco et al., 2001).
In our study, the standardized morphological data were utilized to compute Euclidean distances among the 32 rice genotypes and an UPGMA dendrogram was generated using quantitative traits. The dendrogram showed that similar genotypes tend to cluster together (Figure 1) and the 32 rice genotypes were grouped into five major clusters (Table 3) with dissimilarity coefficient of 1.43. Among the five clusters, groups I and IV had one variety each, group III had the highest number (22) of varieties, and groups II and V had four varieties each. This implies that these groups contain accessions that belong to different lines and would have some morphological and yield differences among themselves (Arif et al., 2005). Varieties clustered together showed close relationship phenotypically, whereas those distant from one another were phenotypically and genetically different. For those clustered together, the irradiation probably changed similar components of their genes; therefore, they will appear similar to showcase their genetic composition, due to mutation brought about by irradiation. These dissimilarities might be traced to environmental influence on the varieties or accessions over a period of time. Thus, crossing between these closely related varieties would not be an agronomic advantage because it will result in low heterotic vigour and degeneration of offspring.
For distant genotypes, it could be inferred that chromosomal changes caused by irradiation treatments took place at different locations and levels in the chromosome; thus, differences between genotypes would be wider. These changes are important for breeding programmes as this will lead to achievement of higher heterotic vigour, which is the ultimate aim of breeding programmes especially those designed for food security and other agricultural or aesthetic purposes. Higher genetic diversity that might be advantageous to breeding varieties with desirable traits is the lot of mutation breeding in rice (Latif et al., 20011a, b), and as such it is well rooted in this study. This implies that mutation breeding will be a tool for generating genetic divergence in order to attain desirable traits in rice or other cultivars.
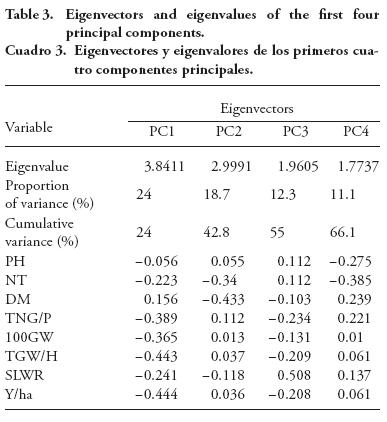
PCA is a multivariate grouping approach based on similarity coefficients or variance-covariance or correlation values. In our study it showed diversity among 32 rice accessions through few eigenvectors. Therefore, it is expected to be highly informative about the differences of major groups (Behera et al., 2012).
In our study, the first four principal components (PC) contributed 66.1 % of the total variation out of which PC1 explained 24 % of the variation, and PC2, PC3 and PC4 explained 18.7 %, 12.3 %, and 11.1 %, respectively (Table 4). These results are due to the fact that the highest level of variation is usually recorded in the first or the second or both PC. Thus, for the total variation, 42.8% was explained by PC1 and PC2 in our study; and 82.7 % by PC1 among 32 rice genotypes (Lasalita-Zapico et al., 2010), and 68.6 % by PC1 and PC2 (Caldo et al., 1996).
Cluster analysis using ISSR markers
The selected primers generated 443 clear polymorphic bands (Table 4) and gel pictures of ISSR markers showing different patterns of polymorphism are shown in Figures 2 and 3. The size of the amplified products ranged from 100 to 3000 bp. The number of bands generated per primer varied from 11 to 22. Primer ISSR21 generated the minimum number of bands, whereas the peak was observed in primers ISSR10 and ISSR18, and average number of bands per primer was 18. Overall, bands were 85.10 % polymorphic in the accessions evaluated. Monomorphic bands are constant bands and cannot be used to study diversity, whereas polymorphic bands reveal differences that can be used to examine and establish systematic relationships among individuals and populations. The number of alleles detected depends upon fingerprinting techniques and materials used in the study (Thomson et al., 2009; Kaushik et al., 2011). The variation in the number of bands amplified by different primers is due to factors such as primer structure, template quantity and number of annealing sites in the genome (Muralidharan and Wakeland, 1993). Each individual primer has a unique multi-locus phenotype.
Jaccard's genetic similarity coefficient among rice genotypes ranged from 0.17 to 0.63 in our study. This indicates a high level of genetic variability because dendrogram coefficients ranging from 0.04 to 0.92 are categorized as great indicators of variation among rice genotypes (Tu et al., 2007; Wong et al., 2009). The lowest genetic similarity was observed between MR219-ML8 and MR219-ML22, whereas the highest similarity was found between MR219-ML9 and MR219-ML10. The difference between the highest and the lowest values of genetic distance showed a wide range of variability among the 32 accessions evaluated. Genotypes were grouped into six major clusters with a threshold genetic distance of 0.396. The highest number of genotypes was found in cluster IV with nine, followed by clusters I, II and III with seven, and clusters V and VI had only one genotype each (Figure 4). High genetic diversity among mutant rice varieties in our study might be due to the effect of ion beam irradiation. The genetic diversity in the genotypes of clusters V and VI could be explained by some morphological or agronomical traits that differentiated them from the other varieties or genotypes (Arif et al., 2005).
Genetic diversity with ISSR markers
Several rice genotypes were studied using enzymatic markers (Glaszmann, 1987), physiological and morphological characters (Oka, 1988; Vairavan et al., 1973), as well as molecular markers. These molecular markers included RFLP (Mc Couch and Tanksley, 1991), microsatellite (Yang et al., 1994), RAPD (Sarma and Bahar, 2005) and ISSR (Bhuyan, 2007). It is argued that ISSRs are not suitable for estimating the effective number of alleles (Ne) and Nei's gene diversity (H) because different bands on the gels do not imply different alleles. Therefore, it should be taken into account that estimates of diversity as number of alleles and Nei's gene diversity shown in our study by using dominant markers are likely underestimated. Average values for Ne ranged from 1.14 to 1.38 among the 25 markers, between 0.25 to 0.46 for H, from 0.15 to 0.35 for Shannon's information index (I), and for PIC between 0.22 for ISSR21 and 0.35 for ISSR23 and ISSR24 (Table 4). The PIC value provides an estimate of the discriminating power of a marker based on the number of alleles at a locus and relative frequencies of these alleles. These values shown for Ne's gene diversity, Shanon's information index and PIC might be slightly lower or higher in different research areas (Mazid et al., 2013, Singh et al., 2010; Cheng et al., 2012). The outcome of our study further establishes that the range of values for these diversity parameters is around 0.20. It should be noted that the minimum and maximum for each of these parameters are not usually or supposedly to be similar or the same, as reported by Mazid et al (2013) for PIC and by Cheng et al. (2012) for Nei's gene diversity values. Determination of minimum and maximum value could be linked to the use of different markers as well as examination of different varieties or species.
Correlation between phenotypic and ISSR markers data
The correlation between the Euclidean distance matrices based on the phenotypic traits and ISSR data was r=0.2, which indicates a low positive correlation between quantitative traits and ISSR markers. The reduced level of association between molecular and quantitative traits might be due to the uncontrollable influence of the environmental factors on the quantitative traits, because molecular work is less influenced by the environment. This is the usual trend of the association between quantitative traits and molecular analyses in a single crop (Mazid et al., 2013; Singh et al., 2011) Thus, varietal or genotype selection and related decisions could be reliably based on the molecular result.
The overall results obtained from both quantitative and molecular data indicate that irradiation might introduce a significant level of genetic and morphological diversities in mutant lines, relative to what is inherent in the parent. Genetic diversity is evident through the use quantitative traits and it is confirmed at the molecular level (Babaei, 2010; Domingo et al., 2007). This is attested to by the result of the correlation between molecular and quantitative trait parameters in our study; besides, our results showed that irradiation could generate a considerable amount of genetic variability, and provide new avenues for crop improvement and diversification (Elayaraja et al., 2005; Luzi-Kihupi et al., 2009). This crop improvement might also be successful development of mutant lines with desirable traits, which are absent in the parent (Shehata et al., 2009). The similarity coefficients, dendrogram clusters and principal component analysis from the ISSR data in the M5 population, were highly correlated with the quantitative trait results. This shows the effectiveness of ISSR markers in varietal identification and detection of mutants with high reproducibility levels. Therefore, ISSR markers might overcome the major limitations to the methods of low reproducibility of RAPD, high cost of AFLP and the need to know the flanking sequences to develop species specific primers for SSR polymorphism (Reddy et al., 2002).
Conclusions
Both quantitative traits and molecular markers are useful tools for assessing genetic variability and diversity of mutant rice genotypes. There was a positive low correlation between quantitative trait and molecular data. Based on the molecular analysis, the diversity between MR219-ML8 and MR219-ML22 suggests that successful crossings could be done between them to develop high yielding varieties. Besides, there was genetic stability of the mutants because all ISSR markers showed homozygous bands. Finally, the best lines are MR219-ML10 and MR219-ML4 followed by MR219-ML9 and MR219-ML21 for higher grain yield production.
Acknowledgment
The authors would like to acknowledge the financial support of IAEA's Coordinated Research Project (CRP) for Food and Feed [CRP Code: D2.30.30]. We also appreciate Malaysia Ministry of Education for Long-Term Research Grant Scheme (LRGS) on enhancing sustainable rice production and MOSTI for Science Fund (06-03-01-SF0110).
Literature Cited
Ajibade, S. R., N. F. Weeden and S. M. Chite. 2000. Inter-simple sequence repeat analysis of genetic relationships in the genus Viglla. Euphytica 111: 47-55. [ Links ]
Arif, M., S. Kousar, M. Asghar Bajwa, A. Arif, and Y. Zafar. 2005. Genetic diversity among rice genotypes of Pakistan through random amplified polymorphic DNA (RAPD) analysis. Pak. J. Bot. 37: 585-592. [ Links ]
Babaei, A. 2010. Genetic diversity analysis of Nemat rice mutant (Oryza sativa L.) via RAPD marker. American-Eurasian J. Agric. Environ. Sci. 8: 452-456. [ Links ]
Babaei, A., G. A. Nematzadeh, and H. Hashemi. 2011. An evaluation of genetic differentiation in rice mutants using semi-random markers and morphological characteristics. Austr. J. Crop Sci. 5: 1715-1722. [ Links ]
Baloch. A. W., A. M. Soomro, M. A. Javed, H. R. Bughio, S. M. Alam, M. S. Bughio, T. Mohammed, and N. N. Mastoi. 2003. Induction of salt tolerance in rice through mutation breeding. Asian J. Plant Sci. 2: 273-276. [ Links ]
Bashar, Z., U. A.Wayayok, and A. M. S. Mohd. 2014. Determination of some physical properties of common Malaysian rice MR219 seeds. Austr. J. Crop Sci. 8: 332-337. [ Links ]
Behera, L., B. C. Patra, R. K. Sahu, A. Nanda, S. C. Sahu, A. Patnaik, G. J. N. Rao, and O. N. Singh. 2012. Assessment of genetic diversity in medicinal rices using microsatellite markers. Austr. J. Crop Sci. 6:1369-1376. [ Links ]
Bhuyan, N., B. K. Borah and R. N. Sarma. 2007. Genetic diversity analysis in traditional lowland rice (Oryza sativa L.) of Assam using RAPD and ISSR markers. Current Sci. 93: 967–972. [ Links ]
Caldo, R. A., L. S. Sebastian, and J. E. Hernandez. 1996. Morphology-based genetic diversity analysis of ancestral lines of Philippine rice cultivars. Phil. J. Crop Sci. 21: 86–92. [ Links ]
Charters, Y. M. and M. J. Wilkinson. 2000. The use of selfpollinated progenies as 'in-groups' for the genetic characterization of cocoa germ plasm. Theor. Appl. Genet. 100: 160- 166. [ Links ]
Cheng, Z. Q., F. Y. Ying, D. Q. Li, T. Q. Yu, J. Fu, H. J. Yan, and X. Q. Huang. 2012. Genetic diversity of wild rice species in Yunnan province of China. Rice Sci. 19: 21–28. [ Links ]
Domingo, C., F. Andrés, and M. Talón. 2007. Rice cv. Bahia mutagenized population: a new resource for rice breeding in the Mediterranean basin. Spanish J. Agric. Res. 5: 341- 347. [ Links ]
Doyle, J. J. 1990. Isolation of plant DNA from fresh tissue. Focus 12: 13–15. [ Links ]
Elayaraja K., M. Prakash, K. Saravanan, S. B. Kumar, and J. Ganesan. 2005. Studies on variability, heritability and genetic advance for certain quantitative characters in mutant population of rice (Oryza sativa L.). Crop Research-Hisar 1: 134-137. [ Links ]
Franco, J., J. Crossa, J. M. Ribaut, J. Betran, M. L. Warburton, and M. Khairallah, 2001. A method for combining molecular markers and phenotypic attributes for classifying plant genotypes. Theor. Appl. Genet. 103: 944-952. [ Links ]
Glaszmann, J. C., 1987. Isozymes and classification of Asian rice varieties. Theor. Appl. Genet. 74: 21-30. [ Links ]
Gomma, M. E., A. A. El-Hissewy, A. B. Khattab, and A. A. Abd-Allah. 1995. Improvement of yield and some related characters of rice (Oryza sativa L.), by irradiation. Menofiya J. Agric. Res 20: 395-408. [ Links ]
Haussmann, B. I., and H. K. Parzies. 2009. Methodologies for generating variability. Part 1: Use of genetic resources in plant breeding and farmer participation. In: Plant Breeding and Farmer Participation. Ceccarelli, S., E.P. Guimarães, and E. Weltzien (eds). Food And Agriculture Organization of The United Nations. Rome. pp: 107-194. [ Links ].
Ibrahim, R., A.R. Harun, S. Hussein, A. Mat Zin, S. Othman, M. Mahmud, M.R. Yusof, S.H. MohdNahar, Z.S. Kamaruddin, and P.K. Ana Ling, 2013. Application of mutation techniques and biotechnology for minimal water requirement and improvement of amylose content in rice. Mutation breeding project forum for nuclear cooperation in Asia (FNCA) 6: 46-59. [ Links ]
Kaushik, A., S. Jain, S. R. McCouch, and R. K. Jain. 2011. Phylogenetic relationships among various groups of rice (Oryza sativa L.) as revealed by microsatellite and transposable element-based marker analysis. Indian J. Genet. Plant Breed. 71:139-150. [ Links ]
Kaw, R. N., 1995. Analysis of divergence in some cold-tolerant rices. Indian J. Genet. Plant Breed. 55: 84 -89. [ Links ]
Korbie, D. J. and J. S. Mattick. 2008. Touchdown PCR for increased specificity and sensitivity in PCR amplification. Nature Protocols 3: 1452-1456. [ Links ]
Lasalita-Zapico, F. C., J. A. Namocatcat, and J. L. Cariño-Turner. 2010. Genetic diversity analysis of traditional upland rice cultivars in Kihan, Malapatan, Sarangani Province, Philippines using morphometric markers. Phil. J. Crop Sci. 139: 177–180. [ Links ]
Latif M. A., M. R. Yusop, M. M. Rahman, and M. R. Bashar Talukdar. 2011a. Microsatellite and minisatellite markers based DNA fingerprinting and genetic diversity of blast and ufra resistant genotypes. Comptes Rendus Biol. 334: 282–289. [ Links ]
Latif, M. A., M. M. Rahman, M. S. Kabir, M. A. Ali, M. T. Islam, and M. Y. Rafii. 2011b. Genetic diversity analyzed by quantitative traits among rice (Oryza sativa L.) genotypes resistant to blast disease. Afr. J. Microbiol. Res. 5: 4383–4391. [ Links ]
Levin, I., N. Gilboa, E. Yeselson, S. Shen, and A. A. Schaffer. 2000. Fxr, a major locus that modulates the fructose to glucose ratio in mature tomato fruits. Theor. Appl. Genet. 100: 256-262. [ Links ]
Luzi-Kihupi, A., J. A, Zakayo, H. Tusekelege, M. Mkuya, N. J. M. Kibanda, K. J. Khatib, and A. Maerere. 2009. Mutation breeding for rice improvement in Tanzania. Book of Abstracts, International Symposium on Induced Mutations in Plants Held at Vienna, Austria 12–15 August 2008. FAO. Rome. pp: 177. [ Links ]
Mazid, M. S., M. Y. Rafii, M. M. Hanafi, H. A. Rahim, and M. A. Latif. 2013. Genetic variation, heritability, divergence and biomass accumulation of rice genotypes resistant to bacterial blight revealed by quantitative traits and ISSR markers. Physiologia Plantarum 149: 432-447. [ Links ]
McCouch, S. R., and S. D. Tanksley. 1991. Development and use of restriction fragment length polymorphism in rice breeding and genetics. In: Khush, G. S., and G. H. Toenniessen (eds). Rice Biotechnology. Biotechnology in Agriculture No. 6. International Rice Research Institute. Manila, Philippines. pp: 109-133. [ Links ]
Muralidharan, K., and E. K. Wakeland. 1993. Concentration of primer and template qualitatively affects products in random-amplified polymorphic DNA PCR. Biotechniques 14: 362-364. [ Links ]
Oka, H. I. 1988. Indica-Japonica differentiation of rice cultivars. In: Oka, H. I. (ed). Origin of Cultivated Rice. Japan Science Society Press/Elsevier. Tokyo/Amsterdam. pp: 141-179. [ Links ]
Pasakinskiene, I., C. M. Griffiths, A. J. E. Bettany, Y. Paplauskiene, and M. W. Humphreys (2000) Anchored simple-sequence repeats as primers to generate species-specific DNA markers in Lolium and Festuca grasses. Theor. Appl. Genet. 100: 384-390. [ Links ]
Prevost, A. and M. J. Wilkinson. 1999. A new system of comparing PCR primers applied to ISSR fingerprinting of potato cultivars. Theor. Appl. Genet. 98: 107-112. [ Links ]
Qayyoum, A., M. U. Mufti, and S. A. Rabbani. 2000. Evaluation of different rice genotypes for stability in yield performance. Pak. J. Scient. Ind. Res. 43: 188-190. [ Links ]
Reddy, M. P., N. Sarla, and E. A. Siddiq. 2002. Inter simple sequence repeat (ISSR) polymorphism and its application in plant breeding. Euphytica 128: 9–17. [ Links ]
Rohlf, F. J. 2000. NTSYS-pc: numerical taxonomy and multivariate analysis system, version 2.1. Exeter Software. [ Links ]
Saleem, M. Y., Z. Mukhtar, A. A. Cheema, and B. M. Atta. 2005. Induced mutation and in vitro techniques as a method to induce salt tolerance in Basmati rice (Oryza sativa L.). Int. J. Environ. Sci. Technol. 2: 141- 145. [ Links ]
Sarma, R. N., and B. Bahar. 2005. Genetic variation of Bora rice (glutinous rice) of Assam as revealed by RAPDs. Plant Genetic Resources Newsletter 144:34–38. [ Links ]
SAS Institute. (2002). SAS/STAT software, version 9.1. [ Links ]
Shah, S. M., S. A. Naveed, and M. Arif. 2013. Genetic diversity in basmati and non-basmati rice varieties based on microsatellite markers. Pak. J. Bot. 45: 423-431. [ Links ]
Shahidullah, S. M., M. M. Hanafi, M. Ashrafuzzaman, M. R. Ismail, and M. A. Salam. 2009. Phenological characters and genetic divergence in aromatic rices. Afr. J. Biotechnol. 8: 3199–3207. [ Links ]
Sharma, A., and S. K. Singh. 2013. Induced mutation-a tool for creation of genetic variability in rice (Oryza sativa L.). J. Crop Weed 9: 132-138. [ Links ]
Shehata, S. M., M. H. Ammar, A. F. Abdelkalik, and B. A. Zayed, 2009. Morphological, molecular and biochemical evaluation of Egyptian jasmine rice variety and its M5 derived mutants. Afr. J. Biotechnol. 8: 6110-6116. [ Links ]
Singh V. K., P. Upadhyay, P. Sinha, A. K. Mall, S. K. Jaiswal, A. Singh, R. K. Ellur, S. Biradar, R. M. Sundaram, S. Singh, I. Ahmed, B. Mishra, A. K. Singh, and C. Kole. 2011. Determination of genetic relationships among elite thermosensitive genic male sterile lines (TGMS) of rice (Oryza sativa L.) employing morphological and simple sequence repeat (SSR) markers. J. Genet. 90: 11–19. [ Links ]
Singh, S., R. K. Gautam, R. K. Singh, R. Deshmukh, and A. Ojha. 2010. Molecular diversity in rice genotypes differing in physiological mechanisms of salt tolerance through SSR and ISSR markers. Int. J. Applied Biol. Pharmaceut. Technol. 1: 550–560. [ Links ]
Sokal, R. R. and F. J. Rohlf. 1962. The comparison of dendrograms by objective methods. Taxon 11: 33-40. [ Links ]
Thomson, M. J., N. R. Polato, J. Prasetiyono, K. R. Trijatmiko, T. S. Silitonga, and S. R. McCouch. 2009. Genetic diversity of isolated populations of Indonesian landraces of rice (Oryza sativa L.), collected in East Kalimantan on the Island of Borneo. Rice 2: 80–92. [ Links ]
Tu, M., B. R. Lu, Y. Zhu, and Y. Wang. 2007. Abundant within-varietal genetic diversity in rice germplasm from Yunnan Province of China revealed by SSR fingerprints. Biochem. Genet. 45: 789-801. [ Links ]
Vairavan, S., E. A. Siddiq, V. Arunachalam, and M. S. Swaminathan. 1973. A study on the nature of genetic divergence in rice from Assam and North East Himalayas. Theor. Appl. Genet. 43:213–221. [ Links ]
Weising, K., P. Winter, B. Hüttel, and G. Kahl. 1998. Microsatellites markers for molecular breeding. J. Crop Prod. 1: 113-143. [ Links ]
Wong, S. C., P. H. Yiu, S. T. W. Bong, H. H. Lee, P. N. P. Neoh, and A. Rajan. 2009. Analysis of Sarawak Bario rice diversity using microsatellite markers. Am. J. Agric. Biol. Sci. 4:298-304. [ Links ]
Yang, G. P., M. A. Saghai Maroof, C. G. Xu, Q. Zang, and R. M. Biyashev. 1994. Comparative analysis of microsatellite DNA polymorphism in landraces and cultivars of rice. Mol. General Genet. 245: 187-194. [ Links ]
Ziętkiewicz, E., A. Rafalski, and D. Labuda. 1994. Genomic fingerprinting by simple sequence repeat (SSR)-anchored polymerase chain reaction amplification. Genomics 20: 176-183. [ Links ]

