


Serviços Personalizados
Journal
Artigo
 Inglês (pdf)
 Artigo em XML
 Referências do artigo
 Enviar este artigo por email
Indicadores
-
 Citado por SciELO
 -
 Acessos
Links relacionados
-
 Similares em
SciELO
Similares em
SciELO
Compartilhar

 Permalink
Agrociencia
versão On-line ISSN 2521-9766versão impressa ISSN 1405-3195
Agrociencia vol.48 no.4 Texcoco Jun. 2014
Recursos naturales renovables
Exploring volume growth-density of mixed multiaged stands in northern Mexico
Explorando la relación crecimiento en volumen-densidad en rodales mixtos e incoetáneos en el norte de México
Juan M. Torres-Rojo*
* Centro de Investigación y Docencia Económicas. Carretera México-Toluca, Núm. 3655. 01210. Colonia Lomas de Santa Fé, México D. F. (juanmanuel.torres@cide.edu).
Recibido: agosto, 2013.
Aprobado: marzo, 2014.
Abstract
The volume growth—density relationship has been studied in even-aged forest stands. Few research reports have deepened in the analysis of such a relationship in mixed multiaged stands to include a wider variety of state variables and more than two species. The objective of this research was to analyze the combined effect of state variables, such as density, site quality, and species composition over volume growth of mixed multiaged forest stands. The analysis is based on a nested segmented model where each segment follows the logistic law of growth. Parameter estimates in each segment are computed by fitting long term data to a simultaneous equations system. Data were obtained from plots established during 1966 and 1968 in the Cielito Azul Experiment Area, state of Durango, Mexico. Results show that volume growth is more accurately predicted throughout the segmented logistic model where each parameter is endogenously predicted from stand state variables. The model improves the fit of the volume growth— density relationship and reveals that the Langsaeter's curve can be extended to multiple species and stand structures. In addition, it suggests that the range of densities with similar growth identified in Langsaeter's curve is highly dependent on species composition and site quality.
Key words: Volume growth prediction, Langsaeter's curve, logistic model, species mixture, multiaged stands.
Resumen
La relación del crecimiento volumen—densidad se ha estudiado en rodales de bosques coetáneos. Pocos estudios han profundizado en el análisis de esta relación en rodales mixtos e incoetáneos, para incluir una variedad más amplia de variables de estado y más de dos especies. El objetivo de esta investigación fue analizar el efecto combinado de distintas variables de estado, como densidad, calidad del sitio y composición de especies en el crecimiento en volumen de rodales de bosque mixtos e incoetáneos. El análisis se basa en un modelo segmentado donde cada segmento sigue la función logística de crecimiento. Las estimaciones del parámetro en cada segmento se calculan ajustando datos de largo plazo a un sistema de ecuaciones simultáneas. Los datos se obtuvieron de parcelas establecidas durante 1966 y 1968 en el Área Experimental Cielito Azul, en el estado de Durango, México. Los resultados muestran que el crecimiento en volumen se predice con mayor precisión con un modelo logístico segmentado en el que cada parámetro se predice endógenamente a partir de variables de estado del rodal. El modelo mejora el ajuste de la relación de crecimiento volumen—densidad y muestra que la curva de Langsaeter se puede extender a varias especies y estructuras de rodales. Además, sugiere que la amplitud de densidades con crecimiento similar identificado en la curva de Langsaeter es altamente dependiente de la composición de especies y calidad del sitio.
Palabras clave: Predicción del crecimiento en volumen, curva de Langsaeter, modelo logístico, mezcla de especies, rodales incoetáneos.
INTRODUCTION
The search for a density which provides a desired amount of goods and services is one of the major concerns of forest management at stand level. The complexity of this search has risen as the range of goods and services required from forests has increased and often includes non-timber forest products, amenities and environmental services. Despite this complexity, foresters keep attempting to find an optimal stand density that maximizes the desired output combination of woody products. Such a density has become the benchmark for all other density optima, for which there is no definite answer yet (Curtis et al., 1997; Leary, 1997; Zeide, 2004). The search for an optimal density has led foresters to study species composition, methods, timing, and frequency of thinnings to optimize the quantity and quality of desired products and services through the development of optimal thinning schedules, which often link growth models to optimization methods, among other techniques. Yet, availability of long term and high quality data has constrained the surface response for most of the growth models, reducing the precision to define such a density or its expected interval according to law-like relationships, particularly in mixed multiaged stands (Pretzsch et al., 2010). This lack of long term information has also limited the identification of the causality of state variables (site conditions, size structure and density) on volume growth, particularly when a wide combination of species or structures is present. (Seymur and Kenefic, 2002).
The understanding of the growth density relationship is particularly important for mixed multiaged stands, where the selection of appropriate residual densities requires practical guidance. This guidence becomes more relevant as complex structures and species compositions appear, which complicate the decision making on the optimal allocation of growing space, main management tool for the forester.
The volume growth—density relationship was studied in even-aged (Pretzsch, 2003; Zeide, 2004; Pretzsch, 2005) and uneven-aged stands (Lotan et al., 1988; Day, 1998), testing the existence of the Wiedemann's hypothesis (Assmann, 1970), also known as the Langsaeter's relationship (Langsaeter, 1941). However, most of the analyses are contrained to few state variables and, in some cases, just one variable, density, which is forced to represent all other state variables affecting volume growth. This omission of important associated variables (e.g. species composition, stand history, site conditions, and weather among others) is likely one of the reasons the volume growth—density relationship was considered absent (Curtis et al., 1997), why attempts to define it have had mixed outputs, and why there is uncertainty about its expected pattern (Oliver and Murray, 1983; Pretzsch, 2005; Río and Sterba, 2009). Hence, Oliver and Larson (1996) and Day (1998) suggest the relationship is restricted to very specific site conditions and species compositions.
The objective of this study was to analyze volume growth—density relationship including a larger number of site variables such as multiple tree species and structures and uses the classical model of expected growth given a change in density, known as the logistic model (Pearl and Reed, 1920).
MATERIALS AND METHODS
Model description
The model builds upon Day's (1998) proposal to fit Douglas-fir uneven-aged stand's data to the Langsaeter's relationship. Such a relationship presents an increasing phase (phase I) with decreasing marginal growth. It is followed by a second phase with a constant pattern of growth (phase II), which turns into a decreasing phase (phase III) with diminishing marginal growth (Figure 1A). The working model assumes stand volume growth follows a general form of the logistic equation in each phase, whose functional form is:

where the change in volume per unit of time  or growth, depends on density (measured in volume -V-), the intrinsic rate of population growth (r) and the parameter (b), defined as the ratio
  where K is the population's carrying capacity. Arranging (1), it can be expressed as a straight line of the form:
  where the left hand side
  can be defined as a volume growth elasticity
  for t=1. Hence, the three growth phases defined by Langsaeter are modeled as straight line segments (Figure 1B), where the i-th segment is represented by:

The intersections among segments (V0 and V1 in Figure 1) become highly relevant points not only for their meaning, but also for the fit, since those intersections impose continuity among segments. The solution for these points is found by simultaneously solving the intersecting lines, which yields: V0 = (r2 -r1)/ (b2 -b1) and V1= (r3 -r2) / (b3 -b2). Given that V0 and V1 can be fully described by the model parameters, the segmented model can be expressed as:
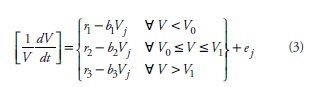
where ej: represents de j-th error term. Note the model only assumes that the j-th observation of volume growth corresponds to the growth along a given time interval and no further assumptions about age structure are made.
The model only describes the expected trend according to Langsaeter's curve, however it ignors other state variables, except density (measured in volume V). In order to include additional state variables, each one of the parameters in (3) was endogenously modeled according to hypothetical trends defined by Zedaker et al. (1987), Pretzsch (2005) and Burkhart and Tomé (2012). For instance, to model the effect of site quality, species diversity and the interaction among these variables on the intrinsic rate of population growth (r) along the i-th segment, the following general model was used:
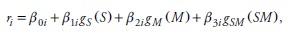
where ri is the intrinsic rate of population growth in the i-th interval, βki corresponds to the k-th model parameter in the i-th interval; S, M and SM represent proxy variables for site quality, species mixture and their interaction respectively, while gS, gM and gSM are transformations of the proxy variables to identify the hypothetical trend. All parameters in expression (3) were modeled in similar fashion attempting to test hypothetical trends as well as model parsimony.
In order to guarantee minimum deviation at the intersection points and for the three segments as a whole, a system of three simultaneous equations was used. Two equations minimize the deviations among intersection points, while the third one minimizes the deviations from the whole volume growth elasticity  path. Thus, the system has the following form:

where di corresponds to a dichotomous variable  , which takes the value of one if the volume is in the i-th interval and zero, otherwise. Observe that equations 1 and 2 minimize deviations from intersections and define the values for V0 and V1. The system was estimated by using the MODEL procedure from the SAS® system.
Data
The data base comes from 36 permanent experimental plots established from 1966 to 1968 over an area of 53 ha in the state of Durango, Mexico (24° 22' and 24° 23' N; 105° 53' and 105° 54' W) at the Cielito Azul Experimental Area. These plots are divided in four quadrants (25X25 m), each one of them were calibrated to test different levels of growing stock. The area is mostly hilly with an average slope of 15 %, average elevation is 2500 m, and soil texture is mostly a combination of silt-clay and silt-sand with high litter content. The weather is temperate with a summer rainy season (800 mm yearly rainfall), and sporadic winter precipitations (10-15 mm). Forest vegetation is composed mostly by several species of the genus Quercus and Pinus. Species were categorized in six groups: fast growing pines (Pinus cooperi Blanco, P. durangensis Mart., and P. ayacahuite Ehrenb. ex Schltdl.), slow growing pines (P. hartwegii Lindl., P. oocarpa Schiede ex Schltdl., P. teocote Schltdl. et Cham.), oaks (Quercus crassifolia, Q. laeta, Q. arizonica, Q. chihuahuensis, Q. obtusata, and Q. rugosa), firs (Abies), cypresses (Cupressus) and hardwoods (Alnus, Arbutus and all other non classified hardwoods). Dominant species are P. cooperi Blanco and P. durangensis Mart., as well as diverse shrub species. The forest includes several age classes with diameters ranging 5-80 cm and basal areas ranging 12-23 m2 ha-1. The experimental plots contain a variety of species, as well as different site qualities and densities as shown in Table 1.
The plots were re-measured in 1974, 1978, 1982, 1986, 1990, 1995, and 2000 by the National Institute of Forest, Livestock and Agricultural Research (INIFAP). Each measure updates records on a whole range of tree and stand characteristics. Measurements considered for this study were only 1982, 1986, 1995 and 2000, since data from 1990 measurement showed inconsistencies with previous ones, and those of 1974 and 1978 had different criteria for data collection. Each quadrant was considered an observation for the analysis. Volume growth was computed as the difference in standing volume among two successive measures divided by the number of years among measurements. Site index (S) was estimated by using local site index curves (Valles et al., 1998). Two indexes were tested as species mixture index; the traditional Shannon (Pielou, 1975) index (A), and the Herfindal (Martin, 1996) index (H) used to describe market structure. The inverse of the Herfindal index (1/H) was used to define the variable standard number of species (SNS), which represents a proxy for the number of species in a plot as if they had the same share in terms of number of stems (same relative abundance).
RESULTS AND DISCUSSION
Model fit
Several linear and non-linear transformations as well as combinations of state variables were tested to estimate the population parameters (ri y bi ). The p-values for the estimates associated with the best set of models were invariably low. The selection of the best set of models was made following the Akaikes's information criterion evaluated just for Equation 3. The set of models with the best fit shows the following relationships:
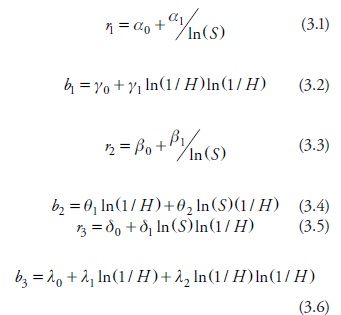
where the Greek letters denote model parameters whose estimates and corresponding goodness of fit statistics are shown in Table 2.
In general, the goodness of fit is good and the model reflects the expected trends. Variation along the general trend was very uniform and no apparent signs of heteroskedasticity were found by the Koenker's test (Koenker, 1981). Convergence, R2, variance and error term distribution values for the whole model are acceptable especially if these values are contrasted with reported experiences to fit volume growth rate from density, for both, even-aged (Curtis and Marshall, 1986; Pretzsch, 2003;
Río and Sterba, 2009) and uneven-aged stands (Day 1998; Garber and Maguire, 2004). Beyond the fit, the model provides with good intuition on the behavior of population parameters in relationship to state variables, which is by itself an improvement on previous works of the volume growth—density relationship.
Two features were consistent in the best fit models tested during the model screening process:
1) The estimates for the slope of the second segment (b2) had values close to zero when it was modeled by just one state variable. Such a behavior is consistent with the constant growth plateau identified for the Langsaeter's relationship (phase II). However, when the interaction term (site quality-species mixture) was added into the model, the whole fit improved; no change in signs was observed and the population parameter (r2) took values close to zero. This result suggests that the interaction term (site-species composition) accounts for much of the characteristics of phase II.
2) The Herfindal index (H) outperformed the Shannon index for all models tested. This performance could be explained by a couple of H's features; the first, it is bounded as its value ranges from zero (an infinite number of species) to one (just one species); and second, it increases as the variance of the shares (species abundance) increases. Both features make H more suitable to measure species composition within a closed range, but also as a measure accounting for the structure of such a composition.
Population growth parameters and density
Volume growth and density (represented in volume terms), showed a similar trend to that described by Langsaeter's curve. Figure 2 depicts the predicted trend for two different site conditions keeping constant the SNS (1/ H = 2).The same trend is observed when the number of species varies (Figure 3).
In this case, the plateau of constant volumen growth enlarges as SNS increases, behavior already observed in field experiments with two and three species (Zeide, 2001; Pretzsch, 2003, Pretzsch, 2005). The lower bound for the constant growth interval (V0 in Figure 1) is not completely defined by the intersection of the first two segments, but by the segment where the peak of volume growth is reached Figure 2. Hence V0 is usually located within the second or third segment and following the model is defined by (ri/2bi) where the i-th subscript represents the section where the maximum population growth is reached. Its location on the second or third segment depends on SNS (Figure 3). Model simulations show that populations with less than 3 species set this interval on the third segment, while they place it on the second segment for populations with more than four species.
Population growth parameters and site quality
Site quality, measured through site index for the most commercial species, showed the expected trend over the intrinsic rate of population growth in two out of three segments. The fits for models 3.1 and 3.3 illustrate that in the first two segments (low to medium densities) the intrinsic rate of population growth increases (with decreasing marginal returns) as the site index (S) does. The fits show the expected signs, as well as high significance levels to predict r1 and r2. Such a behavior is consistent with the general othesis that volume growth rates increase as the site quality increases regardless the composition (Leary, 1997; Garber and Maguire, 2004; Pretzsch et al., 2005).
The same trend was expected for the third segment, however site index was not significant by itself to predict In this final segment r3 became dependent on the interaction of both S and SNS. This result suggests that when holding SNS constant, r3 decreases as site index increases (δ1<0), in other words, volume growth rate is decreasing as site index increases at very high densities. This result was also observed in populations with one (Assmann, 1970; Zeide, 2001) or several species (Kelty, 1992; Pretzsch, 2003). Assmann (1970) attributes this behavior to the unfavorable relationship between assimilation of carbon and respiration of trees subject to competition, which occurs more suddenly in populations growing at higher site quality.
Carrying capacity (K) is affected by site quality only in the second segment of the volume growth-density relationship. The positive value for θ2 suggests that the higher the site index the smaller the K estimated for this second segment, which means a shorter constant growth plateau as site index increases (Figure 2), as reported by Oliver and Larson (1996), Pretzsch (2003) and Pretzsch et al. (2010).
Population growth parameters and species mixture
The effect of species mixture on the population parameters r and K suggested by the model is revealing. Such an effect confirms the hypothesis of an inverse U shape Langsaeter's curve for mixed multiaged stands. For the intrinsic rate of population growth r, no relationship with species mixture along the first and second segments were found. However, the third segment showed that the interaction site-species composition has a positive effect on r. This result suggests that stands with high density and many species can tolerate a higher density stress, which contributes to reduce the growth losses as they approach to maximum density (Figure 3), a behavior reported by Garber and Maguire (2004), Pretzsch (2005) and Jacob et al. (2010). Numerically, the model reflects that the lower the value for r3 at the third segment, the smoother the growth decline at this stage. Such a decreasing rate on r3 is not expected to continue as species composition increases, however, more information at higher densities is necessary to test such a hypothesis. Pretzsch (2005) explains this behavior by the complementary responses patterns of the different species to density (improved use of the physical space) and site conditions (improved use of nutrients).
All segments of the volume growth—density curve showed a relationship between the parameter K and species mixture. Along the first segment the model shows that as the number of species increases, b1 does it; resulting in a faster culmination of the first stage as K1 decreases. This increase in b1 is marginally decreasing, which shows that the effect of species mixture is also decreasing.
Along the second segment, the greater the SNS the smaller the value for b2 until 3 or 4 species are included (depending on site index); beyond this number of species b2 increases. This behavior confirms that mixed stands can yield growth gains at higher densities (Pretzsch, 2003; Pretzsch et al., 2010). The model also shows that such an increase in yield has a limit as the number of species reaches a threshold, beyond that value the population's growth rate declines. The functional form to predict K2 makes more likely to set the constant growth—density interval in the second phase as SNS increases, resulting in a wider constant growth plateu (Figure 3). Beyond the likely ecological basis supporting the increase of b2 with more than 3-4 species, the captured behavior could be due to the poor representation of sites as just 11 % of them showed large values for SNS.
Finally, model shows that as species mixture increases b3 shows an U-shape relationship as well. This trend yields a larger carrying capacity for the third segment (K3) as the number of species increases, reaching almost the same value for 3-4 species. According to the model, for more than four species the carrying capacity decreases (b3 increases) resulting in a lower yield per unit of density along the third segment. Such a trend might suggest that large values for SNS characterize sites not offering optimal conditions for many of the species, where some common limiting resources might exhaust sooner with such a composition than with a unispecific one. Pretzsch et al. (2010) called this effect induced facilitation of poor sites in mixed stands, whereas Debell et al. (1989) referred to this effect as stockability, meaning the tolerance of a forest system to the presence of or competition, or both, from increasing numbers of trees. Sterba (1987) states that such a tolerance varies with environment and, in that regard, might be considered an aspect of site quality independent of that reflected in site index or potential height growth.
Beyond the model fit advantages, parsimony, and flexibility to incorporate a wide variety of observed behaviors in mixed multiaged stands, its rather simple structure allows the forester to derive recommendations on appropriate densities and species mixtures without the need for sophisticated growth models or optimization routines, for a wide variety of sites and species mixtures. A simple recommendation for the residual stocking after thinning for a stand with a given composition and site condition can be obtained by calculating the density where the constant growth plateu begins. This density ensures maximum volume growth, and presumably with the highest value. Evidently, to make this tool full operational a set of guidelines to optimize residual structures might be needed to match harvest volume estimates provided by the model with the structure and composition of harvested trees within a stand.
CONCLUSIONS
This study shows that the volume growth-density relationship fit can be improved by using volume growth elasticity as response surface rather than volume growth. In addition, the use of a nested segmented model based on the logistic curve allows a closer representation of the growth process as affected by several stand state variables. The resulting model yields intuitive responses according to observed and expected behaviors for the volume growth-density relationship in mixed multiaged stands.
The application of the model to mixed multiaged forest stands reveals that Langsaeter's growth—density curve represents a potential management tool for this kind of stands as forest managers are able to define not only practical thinning rules, but also appropriate species mixtures for a given site condition. This last feature becomes important not only when optimizing growing space but also to evaluate adaptation efforts as provides information on the effect of silvicultural practices for reducing risk and making stands more resilient in the face of natural losses or calamities.
LITERATURE CITED
Assmann, E. 1970. Principles of Forest Yield Study. Pergamon Press, New York, 506 p. [ Links ]
Burkhart, H. E., and M. Tomé. 2012. Growth and yield models for uneven-aged stands. In: Modeling Forest Trees and Stands. Springer, New York. pp: 339-361. [ Links ]
Curtis, R. O., D. D. Marshall, and J. F. Bell. 1997. LOGS: A pioneering example of silvicultural research in coast Douglasfir. J. For. 95: 19-25. [ Links ]
Curtis, R. O., and D. D. Marshall. 1986. Levels-of-growing stock cooperative study in Douglas fir: Report 8-The LOGS study: twenty years results. USDA For. Serv. Res. Pap. PNW-RP-356. 28 p. [ Links ]
Day, K. 1998. Stocking standards for uneven aged interior Douglas-fir stands. In: Vyse, A., C. Hollstedt, and D. Huggardz (eds). Managing the Dry Douglas-Fir forests of the Southern Interior. Res. B.C. mim. For., Victoria B.C. Working Paper 34. pp: 37-52. [ Links ]
Debell, D. S., W. R. Harms, and C. D. Whitesell. 1989. Stockability: A major factor in productivity differences between Pinus taeda plantations in Hawaii and the Southeastern United States. For. Sci. 35: 708-719. [ Links ]
Garber, S. M., and D. A. Maguire. 2004. Stand productivity and development in two mixed-species spacing trials in the central Oregon cascades. For. Sci. 50: 92-105. [ Links ]
Jacob, M., C. Leuschner, and F. M. Thomas. 2010. Productivity of temperate broad-leaved forests stands differing in tree species diversity. Ann. For. Sci. 67(5): 503 p. [ Links ]
Kelty, M. J. 1992. Productivity of mixed species stands. In: Kelty, M., B. Larson, and C. Oliver, (eds). The Ecology and Silviculture of Mixed Species Forests. Kluwer Academic, Dordrecht, The Netherlands. pp: 124-142. [ Links ]
Koenker, R. 1981. A note on studentizing a test for heteroskedasticity. J. Econometrics 17: 107-112. [ Links ]
Langsaeter, A. 1941. Omtynning I enaldret gran-og furuskog Meddelelser. Fra Det norske Skogforsoksvesen 8: 131-216. [ Links ]
Leary, R. A. 1997. Testing models of unthinned red pine plantation dynamics using a modified Bakuzis matrix of stand properties. Ecol. Modelling 98: 35-46. [ Links ]
Lotan, J. E., C. E. Carlson, and J. D. Chew. 1988. Stand density and growth of interior Douglas-fir. In: Schmidt, W. (ed). Future Forests of the Mountain West: A Stand Culture Symposium. USDA For. Serv. Ogden, Utah, Gen. Tech. Rep. INT-243. pp: 185-191. [ Links ]
Martin, S. 1996. Advanced Industrial Economics. Blackwell, Oxford. 660 p. [ Links ]
Oliver, C. D., and B. C. Larson. 1996. Forest Stand Dynamics. Mc Graw Hill, New York. 467 p. [ Links ]
Oliver, C. D., and M. D. Murray. 1983. Stand structure, thinning prescriptions, and density indexes in a Douglas fir thinning study in Western Washington, USA. Can. J. For. Res. 13: 126-136. [ Links ]
Pearl, R., and L. J. Reed. 1920. On the rate of growth of the population of United States since 1790 and its mathematical representation. Proc. Nat. Acad. Sci. of the United States of America. 66(6): 275 p. [ Links ]
Pielou, E. C. 1975. Ecological Diversity. Wiley, New York. 241 p. [ Links ]
Pretzsch, H. 2003. The elasticity of growth in pure and mixed stands of Norway spruce (Picea abies [L.]Karst.) and common beech (Fagus silvatica L.). J. For. Sci. 49: 491-501. [ Links ]
Pretzsch, H. 2005. Diversity and productivity in forests: evidence from long-term experimental plots. In: Scherer-Lorenzen, M., Ch. Korner, and E. D. Schulze (eds). Forest Diversity and Functions: Temperate and Boreal Systems. Springer-Verlag, Berlin. pp: 41-63. [ Links ]
Pretzsch, H., J. Block, J. Dieler, P.H. Dong, U. Kohnle, J. Nagel, H. Spellmann, and A. Zingg. 2010. Comparison between the productivity of pure and mixed stands of Norway spruce and European beech along an ecological gradient. Ann. For. Sci. 67: 712 p. [ Links ]
Río del, M., and H. Sterba. 2009. Comparing volume growth in pure and mixed stands of Pinus sylvestris and Quercus pirenaica. Ann. For. Sci. 66(5): 502 p. [ Links ]
Seymour, R. S., and L. S. Kenefic. 2002. Influence of age on growth efficiency of Tsuga canadensis and Picea rubens trees in mixed-species, multiaged northern conifer stands. Can. J. For. Res. 32: 2032-2042. [ Links ]
Sterba, H. 1987. Estimating potential density from thinning experiments and inventory data. For. Sci. 33: 1022-1034. [ Links ]
Valles G., A. G., J. M. Torres R., A. Velázquez M., y C. Rodríguez F. 1998. Relación de nueve índices de competencia con el crecimiento en diámetro de Pinus cooperi Blanco. Agrociencia 32: 255-260. [ Links ]
Zedaker, S. M., H. E. Burkhart, and A. R. Stage. 1987. General principles and patterns of conifer growth and yield. In: Walstad, J. D., and P. J. Kuch (eds). Forest Vegetation Management for Conifer Production. Wiley, New York. pp: 203-241. [ Links ]
Zeide, B. 2001. Thinning and growth: A full turnaround. J. For. 99: 20-25. [ Links ]
Zeide, B. 2004. Optimal stand density: a solution. Can. J. For. Res. 34: 846-854
 Todo o conteúdo deste periódico, exceto onde está identificado, está licenciado sob uma Licença Creative Commons

agrocien@colpos.mx