


Servicios Personalizados
Revista
Articulo
 Inglés (pdf)
 Artículo en XML
 Referencias del artículo
 Enviar artículo por email
Indicadores
-
 Citado por SciELO
 -
 Accesos
Links relacionados
-
 Similares en
SciELO
Similares en
SciELO
Compartir

 Permalink
Agrociencia
versión On-line ISSN 2521-9766versión impresa ISSN 1405-3195
Agrociencia vol.48 no.1 Texcoco ene./feb. 2014
Biotecnología
Assessment of DNA extraction methods from GMO analysis for grain monitoring in Mexico. Part II: quantification by real-time PCR
Evaluación de métodos de extracción de ADN para el análisis de OGM en el monitoreo de granos en México. Parte II: cuantificación por PCR en tiempo real
Abraham Acatzi1, Amanda Galvez1, Javier Plasencia2, Maricarmen Quirasco1*
1 Department of Food and Biotechnology. Faculty of Chemistry. National Autonomous University of Mexico. 04510. Mexico City, Mexico. (quirabma@unam.mx).
2 Department of Biochemistry. Faculty of Chemistry. National Autonomous University of Mexico. 04510. Mexico City, Mexico.
Received: December, 2012.
Approved: November, 2013.
Abstract
Because of their specificity and high throughput, real-time PCR-based methods are suitable for the monitoring of genetically modified (GM) organisms at field level or in the grain trade, in order to comply with federal regulations on biosafety. In the first part of this study, DNA extracted from different maize (Zea mays L.) tissues using several commercial purification protocols available in Mexico were evaluated in terms of DNA quality as substrates for end-point PCR. In this second part, DNA preparations obtained from grain, by means of the same commercial protocols, were tested in quantitative PCR (qPCR), using TaqMan and SYBR Green protocols. Linear dynamic range, amplification efficiency and method accuracy were assessed using recommended qPCR criteria for validation purposes. Results showed that the chemical complexity of plant tissues, such as grains, require an efficient purification protocol for consistent and reliable PCR quantification. The ratio A260/280 and DNA visualization in agarose gels are recommended as preliminary —but not exclusive— criteria of DNA quality because DNA amplification capability is not evinced with these procedures. Two of the methods tested yielded good-quality DNA as revealed by the linear dynamic range analysis. The third method analyzed rendered inaccurate results due to the presence of grain endogenous PCR inhibitors that did not allow a proper DNA quantification. As conclusion, TaqMan chemistry showed to be more sensitive to the presence of impurities than SYBR Green, even though amplification could be achieved in the latter, quantification may not be accurate. Silica DNA-binding membranes yield the most suitable DNA preparations for PCR quantification of GM maize grains.
Keywords: quantitative PCR, PCR inhibition, GM maize, genetically modified organism (GMO), DNA quality.
Resumen
Por su especificidad y alta capacidad de procesamiento, los métodos basados en PCR en tiempo real son adecuados para el monitoreo de los organismos genéticamente modificados (GM) en el campo o en el comercio de granos, para cumplir con las regulaciones federales sobre bioseguridad. En la primera parte de este estudio, el ADN extraído de diferentes tejidos de maíz (Zea mays L.) mediante varios protocolos de purificación comerciales disponibles en México, se evaluó en términos de calidad como sustrato molde para PCR en punto final. En esta segunda parte, las preparaciones de ADN obtenidas de granos, por medio de los mismos protocolos comerciales, se probaron en PCR cuantitativa (qPCR) usando las técnicas TaqMan y SYBR Green. El rango dinámico lineal, la eficiencia de amplificación y la precisión se evaluaron usando criterios qPCR recomendados para validación. Los resultados mostraron que la complejidad química de los tejidos vegetales, como los granos, requiere un protocolo de purificación eficaz para la cuantificación consistente y confiable por PCR. La relación A260/280 y el análisis del ADN en geles de agarosa se recomiendan como criterios preliminares —pero no exclusivos— de la calidad del ADN porque la capacidad de amplificación del ADN no se evidencia con estos procedimientos. Dos de los métodos probados produjeron ADN de buena calidad como lo revela el análisis de rango dinámico lineal. El tercer método analizado dio resultados inexactos debido a la presencia de inhibidores de la PCR endógenos de los granos que impidieron una cuantificación adecuada del ADN. Como conclusión, la química TaqMan mostró ser más susceptible a la presencia de impurezas que SYBR Green, a pesar de que la amplificación podría lograrse con esta última, la cuantificación puede ser inexacta. Las membranas de unión al ADN de sílica generaron las preparaciones de ADN más adecuadas para la cuantificación por PCR de los granos de maíz GM.
Palabras clave: PCR cuantitativa, inhibición de PCR, maíz GM, organismos genéticamente modificados (OGM), calidad de ADN.
Introduction
Mexico is the second maize (Zea mays L.) importer from the USA where transgenic maize hybrids occupy about 27×106 ha (GMO Compass, 2010; U.S. Grains Council, 2013). Yellow maize imported from the USA is used for food, feed and processing purposes, but escapes and misuse of this grain in maize-producing regions might constitute an environmental risk. Another potential source of genetically modified (GM) sequences in Mexican fields is grain brought from USA farms by migrant workers. In such cases, gene flow may occur if farmers use this grain as seed, because seed exchange in local communities affects the evolution of farmer's varieties (landraces) in Mexico (CEC Report, 2004; Cleveland etal., 2005). Moreover, since 2009, Mexico has authorized the experimental and pilot field trials for various GM maize varieties (CIBIOGEM, 2012a). Considering that these trials are performed in facilities with containment measures, gene flow from biotech hybrids into native open-pollinated landraces is expected to be a low frequency event; nevertheless, it is an issue of environmental concern. Therefore, molecular methods to trace transgenic events in the field must include GM sequence quantification using highly sensitive, specific and reliable methods, such as quantitative real-time PCR (qPCR). Mexico, as a Party of the Cartagena Protocol, is legally bound to comply with international regulations such as labeling and identification of living modified organisms in intentional trans-boundary movements of grains (Secretariat of the Convention on Biological Diversity, 2000). In Europe or Japan, laws enforce labeling and identification of imports when GM levels are higher than 0.9 and 5%, respectively. Therefore, those imports are carefully verified to avoid labeling and possible rejection from the public. For these purposes, specific detection of very low levels of GM sequences must be achieved (Anklam et al., 2002).
In order to respond to this situation, Mexican government agencies face the challenge of implementing the monitoring of grain in trading, for the detection as well as the quantification of GM-related sequences (Mexican Biosafety Law, 2005; Mexican Regulation on the Biosafety Law, 2009; CIBIOGEM, 2012b). Inspection for quantification purposes is usually made in grains in field surveys as well as in grain shipments. Therefore, the aim of this investigation was to test different DNA extraction methods, commercially available in Mexico, using grains as testing material, in order to further verify the DNA extract performance in qPCR analysis, with TaqMan and SYBR Green chemistries. In the first part of this study, the performance of several DNA extraction methods was assessed by end-point PCR. The objective of the second part of this study was to assess the impact of DNA quality on qPCR analyses, considering that quantification of low concentrations of GM sequences in grain is necessary. These results are to be shared with the Mexican Network for GMO Monitoring (CIBIOGEM, 2012b).
MATERIALS AND METHODS
Plant material
GM reference material, MON810 and Bt11 GM hybrid maize varieties, were provided by Genetic ID NA, Inc. (Fairfield, IA, USA). Non-GM grain from an open-pollinated white corn (Chalqueño landrace) was obtained from a local grower in Chalco, Mexico. GM grains were ground separately in a highspeed blender to obtain a <1 mm particle size and were mixed thoroughly with ground non-transgenic white corn grain at different ratios to obtain blends containing 10%, 1% and 0.1% (w/w) of transgenic material.
Genomic DNA extraction
Genomic DNA was extracted from Chalqueño, MON810 and Bt11 grains by triplicate, using three commercial methods: 1) Fast DNA® kit (Qbiogene, Carlsbad, CA, USA), 2) DNeasy plant kit (Qiagen, Inc. Germantown, MD, USA), and 3) Fast DNA extraction kit (Genetic ID NA, Inc. Fairfield, IA, USA). For all kits, manufacturer instructions were followed. The other DNA extraction methods analyzed in the previous part of this study, namely DNAzol® and Easy-DNA™, both from Invitrogen (Carlsbad, CA, USA), were not assayed for qPCR because they did not yield good-quality DNA for amplification purposes, as evaluated by end-point PCR.
Spectrophotometric and electrophoretic analyses of genomic DNA
A UV scan from 200 to 380 nm was performed for DNA extractions using a Shimadzu UV160U UV/visible spectrophotometer. Genomic DNA concentration was estimated, considering that a value of A260 of 1.00 corresponds to 50 ng µL-1 of double-stranded DNA (Sambrook and Russell, 2001). Genomic DNA samples (approximately 125 ng lane-1) were resolved by horizontal gel electrophoresis in 0.8% agarose gels in 1X Tris-Acetate-EDTA buffer. Gels were stained with ethidium bromide (0.5 µg mL-1) and photographed under UV light.
Quantitative real-time PCR (qPCR)
Quantification of target DNA was performed on an ABI 7500 Real-Time PCR System (Applied Biosystems Inc. Foster City, CA, USA). DNA target sequences for primer and probe design were retrieved from the Joint Research Centre — European Commission data base (JRC-EC) (Bonfini et al., 2007). Unless otherwise stated, oligonucleotides and TaqMan probes were ordered as customized assays at Applied Biosystems, Life Technologies (ABI, Foster City, CA, USA), which uses proprietary algorithms that generate primers-probe designs for qPCR applications. The 20 µL reaction volume contained 10 µL of TaqMan® Universal PCR Master Mix or SYBR Green PCR Master Mix (ABI, ibid), both with ROX as internal standard for data normalization. The concentrations of probe and primers were adjusted to 0.2 and 0.8 µM, respectively, in order to maintain a 1 to 4 ratio per reaction. For SYBR Green reactions, primers were adjusted to 0.35 µM. The housekeeping gene starch synthase (zSSIIb) was used as target endogenous gene for amplification with TaqMan chemistry, as used in certified methods by JRC-EC. For the construct-specific detection of MON81O, the forward primer (ST2 F) corresponds to the 3'-end of the hsp70 intron, the reverse one (ST2 R) to the cry1A gene, whereas the FAM-tagged probe corresponds to the junction between both genes. As for the Bt11 construct-specific set, the forward primer (ST1 F) corresponds to the enhancer element of the maize alcohol dehydrogenase 1 gene (adh1 ), the reverse one to the phosphinothricin N-acetyl transferase gene (pat), and the FAM-tagged probe to the junction of both transgenic sequences. As for SYBR Green chemistry, invertase was used as the endogenous gene; construct specific primers M810 2-5' and M810 2-3', and IVS2-2 and PAT-B, were used for the amplification of MON810 and Bt11 events, respectively, as established by the JRC-EC methods (Bonfini et al., 2007). Cycle conditions for TaqMan were: 2 min at 50 °C, followed by 10 min at 95 °C, and 40 cycles at 95 °C for 15 s and 60 °C for 1 min. And for SYBR Green were: 2 min at 50 °C, followed by 10 min at 95 °C, and 40 cycles at 94 °C for 40 s, 60 °C for 45 s and 72 °C for 40 s. Non-template controls were included in each plate and all samples were run in triplicate.
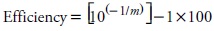
The inhibition tests were run in duplicate, TaqMan and SYBR Green chemistries were used on genomic DNA obtained from a 100% MON810 and Bt11 reference materials. Calibration curves were constructed by making a two-fold dilution series ranging from 20 to 0.156 ng of genomic DNA. Amplification efficiency was calculated with the following equation, considering the slope (m) of the inhibition curve:
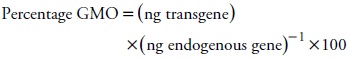
Dynamic linear range was evaluated by amplification with the event-specific primers and probe of 10-fold diluted DNA samples to construct a standard curve. In order to study the effect of DNA quality preparations on quantification, 40 ng of genomic DNA per reaction was used. DNA was obtained from grain blends containing 10, 1 and 0.1 % (w/w) MON810. GMO concentration, expressed as percentage (w/w), was calculated with the following equation:
RESULTS AND DISCUSSION
DNA purity and integrity
In GMO detection by means of PCR, the performance ofthe DNA extraction method in a given matrix is of crucial importance, due to the fact that the quality of the DNA obtained may significantly affect the final result. DNA integrity, as well as the presence of co-purified inhibitors from the matrix or the extraction reagents can reduce the amplification efficiency, by interacting with the DNA template, or by interfering with the DNA polymerase activity (Gryson, 2010; ENGL, 2011). In the first part of this study, genomic DNA was extracted from various maize tissues (e.g. leaves, grains, pollen) using five different commercial purification kits available in Mexico, and DNA suitability for amplification was assessed by end-point PCR. The methods including DNA binding to a silica-based membrane followed by several washing steps in the purification protocol (methods 2 and 3), showed to be more efficient to eliminate PCR inhibitors such as polyphenolic and phenolic compounds from green leaf tissues, as well as polysaccharides, in the case of grains. Such plant compounds exert their inhibitory activity through the formation of complexes with DNA strands thus hindering DNA amplification (ENGL, 2011). These results indicated that a high DNA extraction yield does not reflect its amplification quality. For the analysis by means of qPCR, besides testing DNA extraction methods 2 and 3, method 1 was also evaluated, considering that the quality of DNA was sufficient to render reliable amplification for the case of grain tissue. Quirasco et al. (2004) applied method 3 to quantify CBH351 Starlink corn in highly processed Mexican corn-based foods ranging from alkaline-cooked corn (nixtamal) to cooked and deep-fried tortillas; a progressive degradation of genomic DNA during processing was observed, but GMO was detected by qPCR up to 0.1% (w/w) in most products.
The other DNA extraction methods analyzed in the first part of this study were not assayed for qPCR because end-point PCR results showed that they did not yield amplifiable DNA. As for DNA quality evaluated by UV absorbance, the ratios of A260/280 were 2.1±0.02, 4.0±0.72 and 1.77±0.03, for methods 1, 2 and 3, respectively. The absorbance scan from 200 to 380 nm for each DNA preparation is shown in Figure 1. It is noticeable that DNA preparation obtained with method 1 rendered DNA with impurities that absorb at 230 nm, which could come from residual compounds in the extraction buffer, such as EDTA or guanidine-HCl or both (Demeke and Jenkins, 2010). The DNA ratio A260/280 is not an absolute criterion of DNA purity because DNA rendered with method 2 showed a value that indicated a low purity preparation, which does not correspond to results obtained by means of end-point PCR. The electrophoretic pattern of this preparation (data not showed) presented some degradation, and this could cause a hyperchromic effect at 260 nm (mainly due to single-stranded DNA and shorter oligonucleotides) that in turn contributes to overestimate DNA concentration (Demeke and Jenkins, 2010). For quality of the DNA obtained with method 3, A260/280 is just below the expected values, 1.9 to 2.0. However, the absorbance scan showed the optimal shape with a maximum at 260 and an inflection point around 230 nm, which corresponds to a ratio A260/230 of 1.0. DNA obtained with kits 2 and 3, rendered the best proficiency in end-point PCR (data not showed). The assessment of the performance of DNA extraction protocols is a continuous process because methods applied to one matrix may not be suitable for others. Experimental approaches similar to the present study were used to test corn products, such as starch and extruded products, and other crops and foods, like soybean and derived products, including protein isolates, soybean based drinks and tofu (Murray et al., 2007; Smith and Maxwell, 2007; Mafra et al., 2008). Besides testing commercial kits, like the ones used in this study, those authors evaluated the CTAB (hexadecyltrimethylammonium bromide) method. Their results indicate that the latter is particularly useful to extract good quality DNA for PCR from highly processed food, although it rendered low yields. Besides, for the extraction of DNA from grains, methods like those based on DNA binding to resins, membranes or magnetic particles are less laborious and time consuming, and render good amplification quality DNA. Practicability is one of the method acceptance criteria to be considered, especially, in regard to the high throughput needed (ENGL, 2008).
DNA as substrate for quantitative real-time PCR amplification: inhibition tests
Quantitative PCR relies on the ability of an efficient amplification, which means that the reaction should be performed in the absence of inhibitory molecules and that it should be specific enough in order to avoid the generation of fluorescence from non-target DNA templates. In order to assess DNA purity, an inhibition curve must be performed. In this curve, a series of DNA target dilutions are run and the Ct value is registered. If the dilutions are two-fold, the ΔCt is expected to be of one cycle. Besides, the slope of the curve, that in turn reflects the efficiency of amplification, should be within —3.6 and —3.1 (ENGL, 2008; Holden et al., 2010). An inhibition test was performed for MON810 and Bt11 with DNA obtained with methods 1, 2 and 3, whose results are shown in Tables 2 and 3, respectively. Regarding TaqMan results, in the case of MON810, methods 2 and 3 rendered DNA extracts free of inhibitory compounds that led to high amplification efficiency calculated from the standard curve, as shown by values of 99.3 and 98.4%, respectively. For DNA extracted with method 1, its UV analysis and visualization in gel indicated an acceptable purity and integrity; besides, reliable amplification was achieved by end-point PCR. However, real-time results showed that this preparation is not suitable for quantitative analysis, as an efficiency value of 292% was calculated from the standard regression curve. Similar results were obtained for the construct-specific analysis of the Bt11 event. For methods 1, 2 and 3 the slope values were — 1.39, —3.28 and —3.46. The amplification curves obtained with TaqMan chemistry, corresponding to the inhibition test of MON810 grains, are shown in Figure 2. DNA preparations obtained with methods 2 and 3 led to the amplification down to 57 target molecules, thus, they are suitable to perform sensitive and reliable detections (Hübner et al., 2001; Kay and Van den Eede, 2001). In contrast, amplification results of DNA obtained with method 1 showed no relation with respect to the DNA template quantity in the reaction, which explains their non-linear behavior. The copy number of transgenic sequences was calculated considering the hemizygous nature of MON810 hybrid (Charels et al., 2007; Holden et al., 2010) and a 1C value of 2.725 pg (Trifa and Zhang, 2004; Murray et al., 2007; Paterno et al., 2009; Scholdberg et al., 2009); therefore, the average number of transgenic copies in a solution containing 100 ng of DNA is 36 697.
The inhibition test results using SYBR Green are shown in Table 3. The amplification efficiencies for both GM events, with any of the extraction kits, are acceptable in all cases corresponding to values between 92.3% and 100.6%, according to what is established by the European Network of GMO Laboratories (ENGL, 2008). The amplicons obtained were subjected to dissociation analyses, which showed one amplification product for each event, with Tm values of 78.8 °C and 82.9 °C, specific for MON810 and Bt11, respectively. Multiple products, evinced by several peaks in melting curves, are detrimental to amplification efficiency, with the concomitant error in target DNA quantification (Holden et al., 2010). A representative dissociation curve is shown for the amplicon synthesized with primers MON810 2-3' and MON810 2-5' for detection of MON810 maize (Figure 4A). The inhibition curves obtained with the three DNA preparations show a ΔCt close to one cycle, as expected, and it was possible to amplify down to 57 target molecules (results not shown).

DNA as substrate for quantitative real-time PCR amplification: quantification proficiency
An inefficient amplification due to DNA impurity would be reflected in the determination of an untrue value or in no amplification at all (Cankar et al., 2006). Experiments were performed in order to quantify grain samples spiked with known quantities of GM material, namely MON810. In these experiments TaqMan and SYBR Green chemistries were tested and quantification results from triplicated analyses are shown in Table 4. The overall performance of the extraction method and the real time chemistry was evaluated by the agreement between the average value obtained from the test and the known spiked quantity of the transgenic material. The closeness between these parameters is expected to be within ± 25 % of the reference value (ENGL, 2008). The content of a GMO was quantified as percentage of transgenic DNA in relation to an endogenous control gene, which undergoes the same treatment as the target DNA before amplification. The choice of the housekeeping reference gene should consider that it has to be taxon-specific, it should be in single-or low-copy number and should amplify consistently across different cultivars. From the commonly used endogenous genes in maize-zein, starch synthase (zSSIIb), alcohol dehydrogenase (adh1), high mobility group (hmg) and invertase (ivr1) genes-the ones that show more accurate and reproducible amplification efficiencies are hmg, zSSIIb and ivr1 (Scholdberg et al., 2009). In fact, the use of adh1 as reference gene led to erroneous GMO quantification. This was explained by differences on the genotype of the sample, the calibrant or both due to the presence of a single nucleotide polymorphism for this gene in maize, which in turn affects the endogenous gene quantification by TaqMan chemistry. This error induces an overall miscalculation of the GMO content (Broothaerts et al., 2008).
For both chemistries, results showed that DNA extracted with method 1 led to a non-accurate quantification, whereas methods 2 and 3 rendered a high quality DNA suitable for quantification. Method 3 gave the most accurate values for the three GMO concentrations tested using any real time chemistry. The Ct value for the endogenous reference gene is expected to be the same, regardless the method of DNA extraction. Thus, any difference observed would indicate a non-efficient amplification due to the presence of impurities, to the use of highly degraded DNA or to non-accurate template DNA estimation.
TaqMan chemistry
For the quantitative analysis, the starch synthase was used as endogenous reference gene, and its amplification rendered an efficiency of 94% (slope=—3.475) from DNA extracted with method 3. As for the amplification of the endogenous reference gene, Figure 3 shows a ΔCt around 0.5 cycles between DNA from methods 3 and 2 (curves A and B) that might explain the poor quantification values calculated for the latter. A considerable difference of Ct, approximately 12 cycles, was observed for DNA template prepared with method 1 (curve D). A delay in the onset of the exponential phase of the transgene amplification curve was observed for template DNA from method 1 vs. 2 or 3 (curves E and C, respectively); consequently, an erroneous quantification is expected. Such a difference in Ct values would likely be due to non-accurate template DNA quantification, as evinced by the absorbance spectra from this DNA preparation (Figure 1-1), that shows the presence of compounds with high absorbance at wave lengths below 260, which clearly led to an overestimation of the DNA concentration in the sample. The mean DNA value calculated from the standard curve showed that the actual quantity loaded as template from method 1 was almost four orders of magnitude lower than those with methods 2 and 3. The template under-load, plus the presence of inhibitors in DNA obtained with method 1 might explain the failure to amplify the target sequence when TaqMan was used (Table 4).
SYBR Green chemistry
Dissociation curves obtained from the amplification of invertase gene, used as the endogenous gene, and the transgene in the reference material showed just one amplicon (Figure 4A and 4B), indicating primer specificity and no primer-dimer formation. Cross reaction tests were performed by using the construct-specific primers with other GM events and no amplification products were obtained. The slope values for the detection of invertase gene and MON810 were 3.41 and 3.52, respectively, which correspond to an efficiency of 96.5 and 92.3%. This chemistry is less susceptible to the presence of inhibitors (Gonzalez-Salgado et al., 2009). The estimation of transgene concentration using template DNA from methods 2 and 3 was in general accurate and within the acceptable deviation, whereas results with template from method 1 are far away from the actual GMO concentrations (Table 4). The mean Ct value for the endogenous gene obtained from methods 2 and 3 was 20.3 in contrast with the corresponding to method 1 (25.8). This caused a delay in approximately six cycles, which indicates an overestimation of the template DNA quantity as discussed before. This problem in turn, led to large differences on DNA content in the PCR reaction, which was very low, under the limit of quantification, where the results precision and accuracy were not on acceptable levels.
CONCLUSIONS
Quantitative PCR requires a highly pure DNA preparation as template, in order to obtain reliable quantification values of exogenous DNA in GM plant material such as maize grains. DNA amplification quality could be estimated by DNA visualization in agarose gels or by ultraviolet absorbance, or both, but these evaluations are preliminary criteria. It is advisable to run inhibition test curves in order to verify proper DNA amplification, which in turn reflects template DNA purity. Besides, silica DNA-binding membranes yielded the most suitable DNA preparations for quantification and detection of GM plant tissue. For qPCR, TaqMan chemistry was more accurate and more sensitive to the presence of impurities than SYBR Green.
ACKNOELEDGEMENTS
This project was financed by CONACYT-SEMARNAT (grant 2004-C01-266). We thank A. SanJuan-Badillo (UNAM, Faculty of Chemistry) for her technical assistance.
LITERATURE CITED
Anklam, E., F. Gadani, P. Heinze, H. Pijnenburg, and G. Van den Eede. 2002. Analytical methods for detection and determination of genetically modified organisms in agricultural crops and plant-derived food products. Eur. Food Res. Technol. 214: 3-26. [ Links ]
Bonfini, L., W. Moens, E. Ben, M. Querci, B. Aygun, P. Corbisier, D. Morisset, J. Zel, and G. Van den Eede. 2007. Analytes and related PCR primers used for GMO detection and quantification. JRC Sci. Technol. Rep. EUR 23059 EN. 1-51. [ Links ]
Broothaerts, W., P. Corbisier, H. Schimmel, S. Trapmann, S. Vincent, and H. Emons. 2008. A single nucleotide polymorphism (SNP839) in the adh1 reference gene affects the quantitation of genetically modified maize (Zea mays L.). J. Agric. Food Chem. 56: 8825-8831. [ Links ]
Cankar K., D. Stebih, T. Dreo, J. Zel, and K. Gruden. 2006. Critical points of DNA quantification by real-time PCR — effects of DNA extraction method and sample matrix on quantification of genetically modified organisms. BMC Biotechnol. 6: 37. doi:10.1186/1472-6750-6-37 [ Links ]
CEC Report. 2004. Maize and biodiversity. The effects of transgenic maize in Mexico. Key findings and recommendations. Commission on Environmental Cooperation (CEC) Secretariat report. http://www.cec.org/files/PDF//Maize-and-Biodiversity_en.pdf (Accessed: October, 2013). [ Links ]
Charels, D., S. Broeders, P. Corbisier, S. Trapmann, H. Schimmel, T. Linsinger, and H. Emons. 2007. Toward metrological traceability for DNA fragment ratios in GM quantification. 2. Systematic study of parameters influencing the quantitative determination of MON 810 corn by real-time PCR. J. Agric. Food Chem. 55: 3258-3267. [ Links ]
CIBIOGEM (Comisión Intersecretarial de Bioseguridad de los OGM). 2012a. Solicitudes de Registro de OGMs 2012. http://www.cibiogem.gob.mx/OGMs/Paginas/Solicitudes_Reg_OGMs.aspx. (Accessed: October, 2013). [ Links ]
CIBIOGEM (Comisión Intersecretarial de Bioseguridad de los OGM). 2012b. Comisión Intersecretarial de Bioseguridad. http://www.cibiogem.gob.mx/redes/RedMexOGMs/Paginas/inicio.aspx (Accessed: October, 2013). [ Links ]
Cleveland, D. A., D. Soleri, F. Aragon-Cuevas, J. Crossa, and P. Gepts. 2005. Detecting (trans) gene flow to landraces in centers of crop origin: Lessons from the case of maize in Mexico. Environ. Biosafety Res. 4: 197-208. [ Links ]
Demeke, T., and G. R. Jenkins. 2010. Influence of DNA extraction methods, PCR inhibitors and quantification methods on real-time PCR assay of biotechnology-derived traits. Anal. Bioanal. Chem. 396: 1977-1990. [ Links ]
ENGL. European Network of GMO Laboratories. 2008. Definition of minimum performance requirements for analytical methods of GMO testing. http://gmo-crl.jrc.ec.europa.eu/guidancedocs.htm (Accessed: October, 2013) [ Links ]
ENGL. European Network of GMO Laboratories. 2011. Verification of analytical methods for GMO testing when implementing interlaboratory validated methods. JRC Sci. Technol. Rep. EUR 24790 EN. 1-23. [ Links ]
GMO Compass. 2010. Genetically modified plants: Global Cultivation Area. Maize. Updated to March 29, 2010. http://www.gmo-compass.org/eng/agri_biotechnology/gmo_planting/341.genetically_modified_maize_global_area_under_cultivation.html (Accessed: October, 2013). [ Links ]
Gonzalez-Salgado, A., B. Patiño, J. Gil-Serna, C. Vazquez, and M. T. Gonzalez-Jaen. 2009. Specific detection of Aspergillus carbonarius by SYBR®G reen and TaqMan® quantitative PCR assays based on the multicopy ITS2 region of the rRNA gene. FEMS Microbiol. Lett. 295: 57-66. [ Links ]
Gryson, N. 2010. Effect of food processing on plant DNA degradation and PCR-based GMO analysis: a review. Anal. Bioanal. Chem. 396: 2003-2022. [ Links ]
Holden, M.J., M. Levine, T. Scholdberg, R. J. Haynes, and G. R. Jenkins. 2010. The use of 35S and Tnos expression elements in the measurement of genetically engineered plant materials. Anal. Bioanal. Chem. 396: 2175-2187. [ Links ]
Hübner, P., H. U. Waiblinger, and K. Pietsch. 2001. Validation of PCR methods for quantitation of genetically modified plants in food. J. AOAC Int. 84: 1855-1864. [ Links ]
Kay, S., and G. Van den Eede. 2001. The limits of GMO detection. Nature Biotech.19: 405. [ Links ]
Mafra, I., S. A. Silva, E. J. M. O. Moreira, C. S. Ferreira da Silva, M. Beatriz, and P. P. Oliveira. 2008. Comparative study of DNA extraction methods for soybean derived food products. Food Control. 19: 1183-1190. [ Links ]
Mexican Biosafety Law. 2005. Ley de bioseguridad de organismos genéticamente modificados. Cámara de Diputados del H. Congreso de la Unión. Secretaría General. Secretaría de Servicios Parlamentarios. Centro de Documentación, Información y Análisis. http://www.diputados.gob.mx/LeyesBiblio/pdf/LBOGM.pdf (Accessed: October, 2013). [ Links ]
Mexican Regulation on the Biosafety Law. 2009. Reglamento de la Ley de Bioseguridad de organismos genéticamente modificados. Cámara de Diputados del H. Congreso de la Unión. Secretaría General. Secretaría de Servicios Parlamentarios. Centro de Documentación, Información y Análisis. http://www.diputados.gob.mx/LeyesBiblio/regla.htm (Accessed: October, 2013). [ Links ]
Murray, S. R., R. C. Butler, A. K. Hardacre, and G. M. Timmerman-Vaughan. 2007. Use of quantitative real-time PCR to estimate maize endogenous DNA degradation after cooking and extrusion or in food products. J. Agric. Food Chem. 55: 2231-2239. [ Links ]
Paterno, A., U. Marchesi, F. Gatto, D. Verginelli, C. Quarchioni, C. Fusco, A. Zepparoni, D. Amaddeo, and I. Ciabatti. 2009. Finding the joker among the maize endogenous reference genes for genetically modified organism (GMO) detection. J. Agric. Food Chem. 57: 11086-11091. [ Links ]
Quirasco M., B. Schoel, J. Plasencia, J. Fagan, and A. Galvez. 2004. Suitability of real-time quantitative polymerase chain reaction and enzyme-linked immunosorbent assay for cry9C detection in Mexican corn tortillas: fate of DNA and protein after alkaline cooking. J. AOAC Int. 87: 639-646. [ Links ]
Sambrook, J., and D.W. Russell. 2001. Molecular Cloning. A Laboratory Manual. 3rd edition. Cold Spring Harbor Press, USA. [ Links ]
Secretariat of the Convention on Biological Diversity. 2000. Cartagena Protocol on Biosafety to the Convention on Biological Diversity: text and annexes. Montreal: Secretariat of the Convention on Biological Diversity. Canada. 30 p. [ Links ]
Scholdberg, T. A., T. D. Norden, D. D. Nelson, and G. R. Jenkins. 2009. Evaluating precision and accuracy when quantifying different endogenous control reference genes in maize using real-time PCR. J. Agric. Food Chem. 57: 2903-2911. [ Links ]
Smith, D. S., and P. W. Maxwell. 2007. Use of quantitative PCR to evaluate several methods for extracting DNA from corn flour and cornstarch. Food Control 18: 236-242. [ Links ]
Trifa, Y., and D. Zhang. 2004. DNA content in embryo and endosperm of maize kernel (Zea mays L.): Impact on GMO quantification. J. Agric. Food Chem. 52: 1044-1048. [ Links ]
U.S. Grains Council. 2013. Corn-production and exports. Updated to October 17, 2013. http://www.grains.org/index.php/buying-selling/corn (Accessed: October, 2013). [ Links ]

