


Servicios Personalizados
Revista
Articulo
 Inglés (pdf)
 Artículo en XML
 Referencias del artículo
 Enviar artículo por email
Indicadores
-
 Citado por SciELO
 -
 Accesos
Links relacionados
-
 Similares en
SciELO
Similares en
SciELO
Compartir

 Permalink
Agrociencia
versión On-line ISSN 2521-9766versión impresa ISSN 1405-3195
Agrociencia vol.47 no.1 Texcoco ene./feb. 2013
Recursos naturales renovables
A dominant height growth and site index model for Pinus pseudostrobus Lindl. in northeastern Mexico
Modelo de crecimiento en altura dominante e índice de sitio para Pinus pseudostrobus Lindl. en el noreste de México
Benedicto Vargas-Larreta1* , Oscar A. Aguirre-Calderón2, José J. Corral-Rivas3, Felipe Crecente-Campo4, Ulises Diéguez-Aranda4
1 Instituto Tecnológico de El Salto. Mesa del Tecnológico s/n. 34942. El Salto, Durango, México. * Author for correspondence (bvargas@itelsalto.edu.mx).
2 Facultad de Ciencias Forestales, Universidad Autónoma de Nuevo León. Carretera Nacional km. 145. 67700. Linares, Nuevo León, México. (oaguirre@fcf.uanl.mx).
3 Facultad de Ciencias Forestales, Universidad Juárez del Estado de Durango. Río Papaloapan y Boulevard Durango s/n, Colonia Valle del Sur. 34120. Durango, México. (jcorral@ujed.mx).
4 Departamento de Ingeniería Agroforestal, Universidad de Santiago de Compostela, Escuela Politécnica Superior. R/ Benigno Ledo, Campus universitario. 27002. Lugo, España.
Received: May, 2012.
Approved: October, 2012.
Abstract
Foresters in northeastern Mexico currently use height growth curves developed 20 years ago to estimate the dominant height and productivity of Pinus pseudostrobus Lindl. The development of new curves could improve the ability to predict heights and would allow increasingly precise yield projections for this species. Data from stem analysis of 72 P. pseudostrobus dominant trees growing in natural stands in Nuevo Leon, Tamaulipas and Coahuila (northeastern Mexico), were used to evaluate several dynamic site equations derived with the Generalized Algebraic Difference Approach (GADA). All the equations directly estimate dominant height and site index from any dominant height and age. The fittings were carried out using the base-age-invariant nested iterative approach. A second-order continuous-time autoregressive error structure was used to correct the inherent autocorrelation of the longitudinal data used. The GADA formulation derived from the Korf model, by considering the asymptote and the rate parameters as related to site productivity, had the best fit to the data. Therefore, it is recommended for estimating dominant height growth and site index for Pinus pseudostrobus in northeastern Mexico.
Key words: site quality, height-age relationship, generalized algebraic difference approach, base-age dynamic equation, autocorrelation.
Resumen
Los silvicultores en el noreste de México utilizan actualmente las curvas de crecimiento de altura desarrolladas hace 20 años para estimar la altura dominante y la productividad de Pinus pseudostrobus Lind. El desarrollo de nuevas curvas podría mejorar la habilidad de predecir las alturas y permitiría proyecciones de la producción cada vez más precisas para esta especie. Se usaron datos de análisis de tronco de 72 árboles dominantes de P. pseudostrobus que crecen en rodales naturales en Nuevo León, Tamaulipas y Coahuila (noreste de México), para evaluar varias ecuaciones dinámicas de índice de sitio derivadas con la metodología de diferencias algebraicas generalizadas (GADA, por sus siglas en inglés). Todas las ecuaciones estiman directamente la altura dominante y el índice de sitio, a partir de cualquier altura dominante y edad. Los ajustes se realizaron usando la metodología iterativa anidada, invariante con respecto a la edad base. Se utilizó una estructura de error autorregresiva de tiempo continuo de segundo orden, para corregir la autocorrelación inherente a los datos longitudinales usados. La formulación GADA derivada del modelo Korf, al considerar la asíntota y los parámetros de cambio relacionados con la productividad del sitio, tuvo el mejor ajuste a los datos. Por tanto, se recomienda para estimar el crecimiento en altura dominante y el índice de sitio para Pinus pseudostrobus en el noreste de México.
Palabras clave: calidad de estación, relación altura-edad, metodología de diferencias algebraicas generalizadas, ecuación dinámica de edad base, autocorrelación.
INTRODUCTION
The most accepted indirect estimate of potential forest productivity (i.e. site quality) of a given species on a given even-aged stand is the site index, defined as the height of trees that have always been dominant or codominant and healthy at a reference age (Clutter et al., 1983). Site index models provide a convenient and effective tool for determining potential productivity, thus allowing implementation of appropriate forest management practices. Therefore, reliable dominant height prediction based on unbiased and accurate site index models is essential for growth and yield modeling.
Currently, site index values (productivity estimates) applied to Pinus pseudostrobus stands in northeastern Mexico are estimated with the height growth model developed by Aguirre (1989). This was constructed from stem analysis on the basis of the direction field approach (Sloboda, 1971). The direction field is defined by the amount of three age-height-height increment data groups of a particular dominant height class. The first order differential equation developed by Sloboda (1971) and used by Aguirre (1989) to describe the direction field to estimate the current height increment was:
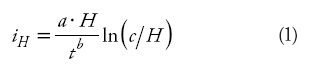
where iH is the current height increment (m), H is dominant height (m), t is age (years), and a, b and c are parameters to be estimated.
Dominant height H at an age t and the site index (S, m) at a fixed base-age of 50 years were calculated through substitution of a base-model's parameter (in this case c). The resultant integral equation was:
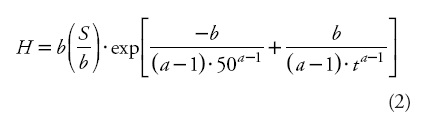
Equation (2) produces anamorphic curves with different asymptotes. Nowadays, it is believed that anamorphic curves do not adequately represent the dominant height-age relationship, and the use of polymorphic models is preferred (Cieszewski, 2002) and biologically more plausible. Moreover, Aguirre (1989) modeled the dominant height-age relationship using the static site equation (2), which requires the use of a fixed reference age (50 years) and its associated observed height or site index as predictors. The choice of this base age was arbitrary, since it was not selected by comparing the errors that can occur with the use of either base age. This common approach is based on the assumption that site indices are equal to the observed height values at the base age, even though the estimated height at any age is expected to be different in the process of parameter estimation than the measured height (Cieszewski, 2004). Since the observed height values contain measurement and sampling errors, assuming that a height at base-age does not contain errors results in parameter estimates that are biased (Goelz and Burk, 1996) and unique to the preselected base age.
Although these types of models have been the most common forms of site equations used for modeling self-reference height-age relationships in even-aged stands (Cieszewski, 2001), there are advantages of dynamic site equations (e.g., Cieszewski and Bailey, 2000; Diéguez-Aranda et al., 2006): base-age-invariance, definition of both height-growth and site index as special cases of the same equation, logical behavior, polymorphism, asymptote as a function of site index, and existence of an inflection point. Two approaches allow getting one or more of these important desirable attributes of site index equations: the Algebraic Difference Approach (ADA, Bailey and Clutter, 1974) and the Generalized Algebraic Difference Approach (GADA, Cieszewski and Bailey, 2000). The main limitation of the ADA is that most models derived with it are either anamorphic or have single asymptotes (Bailey and Clutter, 1974). The GADA can be used to derive more flexible dynamic models than the ADA; its main advantage is that it permits the expansion of the base equations according to various theories about growth characteristics (e.g., asymptote, growth rate), allowing more than one parameter to be site-specific. Additionally, for many of the most used base models [e.g., Bertalanffy-Richards (Bertalanffy, 1949, 1957; Richards, 1959), and Korf (cited in Lundqvist, 1957)] it is the only way to simulate concurrent polymorphism and multiple asymptotes (Cieszewski, 2002).
The objective of this study was to develop a dynamic dominant height growth model for Pinus pseudostrobus Lindl. in northeastern Mexico by comparing several model forms and then contrasting the best one with that developed by Aguirre (1989), which is presently in use by forest managers in this region.
MATERIALS AND METHODS
Location
The study area is located in the states of Nuevo Leon, Coahuila and Tamaulipas (NE Mexico), in the Sierra Madre Oriental. It is geographically located from 23° 22' to 26° 00' N and from 99° 45' to 101° 18' W (Figure 1). The area extends in altitudes from 1200 to 2200 m.
Data set
Seventy two dominant trees (with diameter equal to the mean diameter of dominant trees ±5 % in each plot) with no outwardly visible signs of damage were selected for stem analysis from a network of 172 plots distributed throughout the study area. The trees were selected to represent the site quality range of the study area. The trees were sectioned at the stump (0.3 m), at breast height (1.3 m), and at 2 m intervals along the stem thereafter. Number of rings was counted at each cross-sectioned point and then converted to stump age. To determine the age of each tree, three years were added to the tree rings at the stump (mean age of P. pseudostrobus at height of 0.3 m). These data were used by Aguirre (1989) to develop the current site index model for P. pseudostrobus in this area. Apart from the mentioned limitations in the development of the current site index model, the previous study did not considered the fact that stem analysis introduces bias into the height measurements because the tree height at cross-cut age is overestimated. Therefore, the data was corrected using the method proposed by Carmean (1972) and the modification by Newberry (1991) for the topmost section of the tree. After this adjustment, the height over age data of each tree was plotted and inspected visually for uniformity and indications of suppression or growth abnormalities. No trees were eliminated in this step. Summary statistics, including mean, maximum, minimum, and standard deviation by age classes of the data variables used are shown in Table 1.
Models and procedures for developing the site index curves
Three well-known growth functions in forestry applications, including dominant height modeling, were selected for analysis: the Bertalanffy-Richards (Bertalanffy, 1949, 1957; Richards, 1959) model, the Korf (cited in Lundqvist, 1957) model, and the Hossfeld (1822) model. On the basis of these equations, several dynamic models were formulated by using the GADA to develop the site index equation. ADA formulations from these equations are either anamorphic or have single asymptotes (Bailey and Clutter, 1974). Therefore, only the possible GADA formulations solutions were considered as it is the only way to obtain concurrent polymorphism and multiple asymptotes (Cieszewski, 2002). The three GADA formulations showed the most satisfactory results (Table 2). These equations also provided superior behavior on studies for other species (Diéguez-Aranda et al., 2005, 2006; and Barrio-Anta et al., 2005).
As general notation, a1a2...an were used to denote parameters in base models, while b1...b2 bm were used for global parameters in the GADA formulations; Y is the function's value (in this case dominant height) at age t, and Y0 is the reference variable defined as the function's value at t0. Therefore, all GADA based models have the general implicit form: Y = ƒ (t,to,Yo),b1,b2...bm). X is one unobservable independent variable that describes site productivity as a sum of management regimes, soil conditions, and ecological and climatic factors (Cieszewski, 2002). Thus, the initially selected two-dimensional base equation Y= ƒ (t) expands into an explicit three-dimensional site equation Y= ƒ (t, X), describing both cross-sectional and longitudinal changes with two independent variables t and X.
Model fitting and statistical analysis
The approach used involves the estimation of the model parameters using a base-age-invariant (BAI) method (Bailey and Clutter, 1974). The invariant or unchanging property of dynamic equations refers to predicted heights: any number of points on a specific site curve can be used to make predictions for a given age t and the predicted height Y will always be the same (Diéguez-Aranda et al., 2006). The approach considers that all height trajectories follow a similar functional form, with parameters shared by all individuals (global parameters) and parameters specific for each individual (local parameters). The nested iterative procedure (Tait et al., 1988), described in Cieszewski and Bailey (2000), was used to obtain both the global and site-specific parameters. The procedure begins by fitting the global parameters (b1 b2 and b3 in Equations 3, 4 and 5 in Table 2), using the observed site index (S for each tree (the method allows the use of whatever base age for site index calculation, providing always the same results for the global parameters). In a second step, estimates of the global parameters are used as constants and the site-specific parameter (5) is estimated for each tree. The observed S values for each tree are used as starting values for the fitting procedure. Next, the estimated S value for each tree becomes the new "observed" S value and the global parameters are obtained refitting the model. This procedure is repeated until the global parameters stabilize.
Autocorrelation can have an adverse impact when the goal is to identify statistically significant predictor variables, and implies several disturbances as impartiality of parameters and skewed standard error estimation. Although the least squares estimates of regression coefficients remain unbiased and consistent in the presence of autocorrelation, they are no longer efficient (Myers, 1990); the usual estimates of standard errors of the coefficients are biased, invalidating statistical tests using t or F distributions and confidence intervals (Kutner et al., 2005). To correct autocorrelation, the error term was modeled using a continuous-time autoregressive error structure (CAR (x)) that allows the model to be applied to irregularly spaced, unbalanced data (Diéguez-Aranda et al., 2006). To test for the presence of autocorrelation and the order of the CAR(x) to be used, plots representing residuals versus residuals from previous observations (lag-residuals) within each tree were visually examined.
The nested iterative approach including a CAR(x) error structure was programmed using the MODEL procedure of SAS/ETS® (SAS Institute Inc., 2008), which allows for dynamic updating of the residuals. The parameters of the models were estimated using Ordinary Nonlinear Least Squares (ONLS) regression through the Marquardt algorithm.
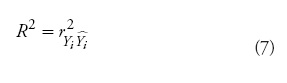
The comparison of the estimates for the different models was based on numerical and graphical analyses of the residuals. Two statistics were examined: the root mean square error (RMSE) and coefficient of determination for nonlinear regression (R2):
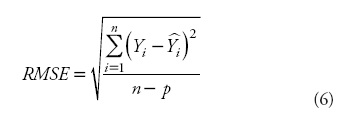
where Yi and  are the measured and estimated values of the dependent variable; n is the total number of observations used to fit the model; p is the number of model parameters; and r2yi
 is the correlation coefficient between yi and .
Although there are several shortcomings associated with use of the R2 in nonlinear regression, the general usefulness of some global measure of model adequacy would seem to override some of those limitations (Ryan, 1997). Finally, plots of residuals against the estimated values, and plots of the fitted curves for different site indices overlaid on trajectories of the observed dominant heights over time were visually examined. Visual inspection is an essential point in selecting the most accurate model because curve profiles may differ considerably, even though goodness-of-fit statistics are similar (Neter et al., 1996).
Selection of reference age for site quality evaluation
When only one observation of a new individual is available for site quality evaluation, the selection of a reference or base age becomes an important issue. The base age should be selected so that it is a reliable predictor of height at other ages, taking into account the erratic height growth at young ages, but considering that a young base age will help in earlier decision making of the silvicultural treatments to be applied (Diéguez-Aranda et al., 2006). In order to address this consideration, different base ages and their corresponding observed heights were used to estimate heights at other ages for each tree. The results were compared with the observed values from stem analyses, and the relative error in predictions (RE %) was then calculated as follows:
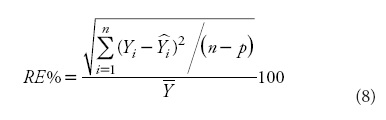
where  is the average value of the tree dominant height and the other variables are as previously defined.
RESULTS AND DISCUSSION
In a first step Eqs. 3, 4 and 5 were fitted without expanding the error terms to account for autocorrelation. A trend in residuals as a function of age lag residuals within the same tree was evident in the three equations. Figure 2a provides an example with Eq. 4. The trends in residuals disappeared after correction for autocorrelation using the secondorder continuous-time autoregressive error structure (Figure 2b).
Although accounting for autocorrelation does not improve the predictive ability of the model, it prevents underestimation of the covariance matrix of the parameters, thereby making it possible to carry out the usual statistical tests (West et al., 1984), .e., it improves interpretation of the statistical properties. The model estimations were not significantly different from those obtained with models fitted without considering such correction. Therefore, autocorrelation parameters are disregarded in practical applications unless one is working with several measurements on the same tree (which is not usual).
All parameter estimates were significant at p = 0.01, except b3 in Eq. 3 and bx in Eq. 5 (Table 3) with p = 0.05. Based on the RMSE values (approximately 0.63 m) and the coefficient of determination (R2) (Table 3), there were no major differences between the fitted models which explained approximately 99 % of the total variance.
Plots showing RMSE and bias in dominant height estimates for 5 years age classes were also addressed (Figure 3), as a helpful way to analyze the accuracy and precision of the models. RMSE values had a similar tendency for the three models analyzed, with Eq. 3 showing little lower values for all except the first age class.
The plots of bias also showed a similar trend for the three fitted models, with the greatest values at juvenile and older ages. This may be due to the smaller number of data points, especially at older ages, and as a result, the curve shape is not well-supported with data at these ages. Despite this, the three models described dominant height growth realistically for all age classes.
As a final evaluation for suitability, Ecs. 3, 4 and 5 were graphically compared. The three models provided similar results, as showed by the plots that represent the fitted curves for different site indices overlaid on the trajectories of the observed dominant heights over time (Figure 4). A slight underestimate of dominant height before base age (40 years, as described later) is observed for Eqs. 3 and 5 on the best site qualities. Moreover, these two equations did not follow as well as Eq. 4 the trajectories of observed data for old ages.
Therefore, based on numerical (Table 3) and graphical (Figures 3 and 4) analysis, Eq. 4, i.e. the GADA formulation from the Korf (cited in Lundqvist, 1957) model by considering parameters a1 and a2 to be dependent of site productivity, was selected as the most suitable one, resulting in the following model:
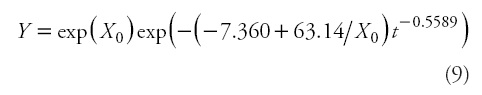
Where Y is the predicted height (m) at age t (years),
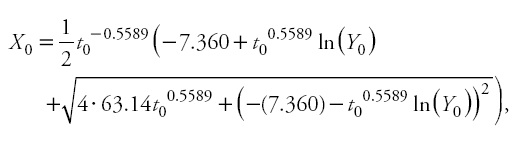
and Y0 and t0 represent the predictor height (m) and age (years). It should be noted that, as with autocorrelation parameters, site-specific parameters are discarded, because the general use of the model involves making predictions using observed heights and their associated ages in new individuals (Cieszewski, 2001; Diéguez-Aranda etal., 2006).
In selecting the base age, it was found that an age of 40 years was superior for predicting height at other ages (Figure 5).
Although lower critical errors were obtained with younger ages, the erratic height growth at young ages (at these ages abnormal climatic extremes may influence total tree height more than at older ages, when total tree height is a sum of more height growth periods) often determined by factors other than site quality (Huang, 1999), makes desirable not to select a very young age, in order to correctly classify site quality. Critical error stabilizes between 30 and 50 years (Figure 5), therefore, 40 years is proposed as the base age to which site index will be referenced in order to classify the stands according to its productivity.
The present investigation was based primarily on trees of approximately 9-21 m at a reference age of 40 years. The ages ranged from 3 to more than 90 years. Therefore, the curves may be used over the entire rotation of the species in the region of study, which is usually around 60 years. The asymptotic values of the curves for site indices of 8, 12, 16 and 20 m at a reference age of 40 years were 16.4, 22.7, 28.8, and 34.5 m, respectively, which seemed realistic. The curves should be used for ages greater than 5 years, since for younger ages erratic height growth may lead to erroneous site quality classifications. The graphical comparison between Eq. 9 and the model developed by Aguirre (1989) (Eq. 2) is shown in Figure 6.
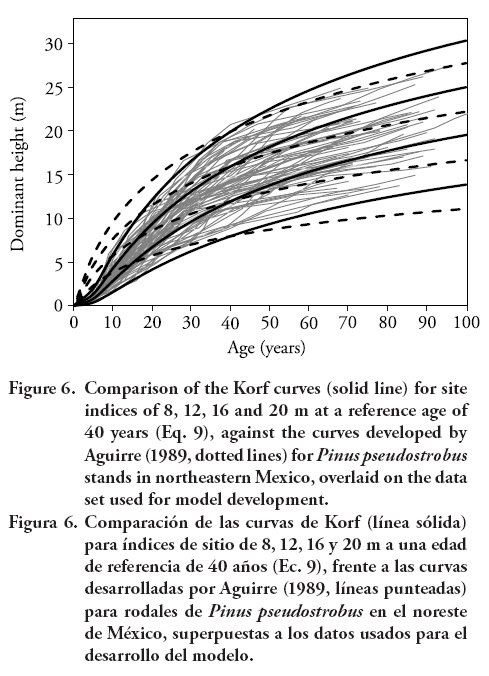
Equation 9 fits the data better than the previous model below and above base age. The curves produced by Aguirre (1989) tend to overestimate dominant height for younger ages before base age, and underestimate height after base age. Equation 9 predicts well the heights at all ages and on all site qualities. The differences between the curves are greater as the age decreases; for example, at an age of approximately 20 years, the differences in the height predicted by the two models are of more than 2 m. The differences are also greater as the age increases from the base age. These differences could be attributable to the model fitting techniques used by Aguirre (1989) (base-age specific) which requires an arbitrary choice of base age prior to model fitting, and then they force the model through the chosen height-age point (site index).
The under- and overestimation of dominant height obtained with the model developed by Aguirre (1989) may lead to erroneous classifications of site productivity, and can also result in biased stand volumes estimations and reductions in sustainable yield predictions for those stands with a large component of P.pseudostrobus.
CONCLUSIONS
The GADA-based model of Korf (Eq. 9) developed in this study is polymorphic, has a sigmoid curve shape and varying asymptotes, .e., it fulfills most of the desirable properties that a site index equation should have: it is base-age invariant and directly estimate height and site index from any height and age, shows no trends in residuals and provides consistent predictions. Comparison with the previous site index model showed much more accurate results and unbiased height estimates for all age classes. Therefore, it is recommended for estimating dominant height growth and site index for Pinus pseudostrobus in northeastern Mexico.
ACKNOWLEDGMENTS
The present investigation was financially supported by the Fondo de Cooperación Interncional en Ciencia y Tecnología Unión Europea-México (FONCICYT-92739). Part of the study was developed during a stay by F. Crecente-Campo at the Universidad Juárez del Estado de Durango (México), supported by the Galician Goverment.
LITERATURE CITED
Aguirre C., O. A. 1989. Aufstellung von Ertragstafeln auf der Basis einmaliger Waldaufnahmen am Beispiel von Pinus pseudostrobus Lindl. im Nortdosten Mexikos. Dissertation, Göttingen, Deutschland. 107 p. [ Links ]
Bailey, R. L., and J. L. Clutter. 1974. Base-age invariant polymorphic site curves. For. Sci. 20: 155-159. [ Links ]
Barrio-Anta, M., and U. Diéguez-Aranda. 2005. Site quality of pedunculate oak (Quercus robur L.) stands in Galicia (northwest Spain). Eur. J. For. Res. 124: 19-28. [ Links ]
Bertalanffy, L.v. 1949. Problems of organic growth. Nature 163: 156-158. [ Links ]
Bertalanffy, L.v. 1957. Quantitative laws in metabolism and growth. Quart. Rev, Biol. 32: 217-231. [ Links ] Carmean, W. H. 1972. Site index curves for upland oaks in the Central States. For. Sci. 18: 109-120. [ Links ]
Cieszewski, C. 2001. Three methods of deriving advanced dynamic site equations demonstrated on inland Douglas-fir site curves. Can. J. For. Res. 31: 165-173. [ Links ]
Cieszewski, C. 2002. Comparing fixed- and variable-base-age site equations having single versus multiple asymptotes. For. Sci. 48: 7-23. [ Links ]
Cieszewski, C. 2004. GADA derivation of dynamic site equations with polymorphism and variable asymptotes from Richards, Weibull, and other exponential functions. University of Georgia PMRC-TR 2004-5. Athens, Georgia. 16 p. [ Links ]
Cieszewski, C., and R. L. Bailey. 2000. Generalized Algebraic Difference Approach: Theory based derivation of dynamic site equations with polymorphism and variable asymptotes. For. Sci. 46: 116-126. [ Links ]
Clutter, J. L., J. C. Fortson, J. C. Piennar, L. V. Brister, and R. L. Bailey. 1983. Timber Management: A Quantitative Approach, John Wiley & Sons, New York. 333 p. [ Links ]
Diéguez-Aranda, U., H. E. Burkhart, and R. Rodríguez-Soalleiro. 2005. Modeling dominant height growth of radiata pine (Pinus radiata D. Don) plantations in north-western Spain. For. Ecol. Manage. 215: 271-284. [ Links ]
Diéguez-Aranda, U., J. A. Grandas-Arias, J. G. Álvarez-González, and K.v. Gadow. 2006. Site quality curves for birch stands in North-Western Spain. Silva Fennica 40: 631-644. [ Links ]
Goelz J., C. G., and T. E. Burk. 1996. Measurement error causes bias in site index equations. Can. J. For. Res. 26: 1586-1593. [ Links ]
Hossfeld J., W. 1822. Mathematik für Forstmänner, Ökonomen und Cameralisten (Gotha, 4. Bd., S. 310). [ Links ]
Huang, S. 1999. Development of compatible height and site index models for young and mature stands within an ecosystem-based management framework. In: Amaro, A., and M. Tomé (eds). Empirical and Process-based Models for Forest Tree and Stand Growth Simulation, Ediçoes Salamandra-Novas Tecnologias, Lisbon. pp: 61-98. [ Links ]
Kutner, M. H., C. J. Nachtsheim, J. Neter, and W. Li. 2005. Applied Linear Statistical Models, 5th ed. McGraw-Hill, Lisbon. 1396 p. [ Links ]
Lundqvist, B. 1957. On the height growth in cultivated stands of pine and spruce in northern Sweden. Medd Fran Statens Skogforsk Band 47(2): 1-64. [ Links ]
Myers, R. H. 1990. Classical and Modern Regression with Applications, 2nd ed. Duxbury Press, Belmont. 488 p. [ Links ]
Neter, J., M. H. Kutner, C. J. Nachtsheim, and W. Wasserman. 1996. Applied Linear Statistical Models, 4th ed. Richard D. Irwin, Chicago. 1408 p. [ Links ]
Newberry, J. D. 1991. A note on Carmean's estimate of height from stem analysis data. For. Sci. 37: 368-369. [ Links ]
Richards, F. J. 1959. A flexible growth function for empirical use. J. Exp. Bot. 10: 290-300. [ Links ]
Ryan, T. P. 1997. Modern Regression Methods. John Wiley & Sons, New York. 515 p. [ Links ]
SAS Institute Inc., 2008. SAS/ETS* 9.2 User's Guide. SAS Institute Inc., Cary, NC. 2861 p. [ Links ]
Sloboda, B. 1971. Zur Darstellung von Wachstumsprozessen mit Hilfe von Differentialgleichungen erster Ordnung. Mitt. D. Baden-Württembergischen Forstl. Versuchsanst. H. 32. 109 p. [ Links ]
Tait, D. E., C. J. Cieszewski, and I. E. Bella. 1988. The stand dynamics of lodgepole pine. Can. J. For. Res. 18: 1255-1260. [ Links ]
West, P. W., D. A. Ratkowsky, and A. W. Davis. 1984. Problems of hypothesis testing of regressions with multiple measurements from individual sampling units. For. Ecol-Manage. 7: 207-224. [ Links ]

