


Servicios Personalizados
Revista

Articulo
 Inglés (pdf)
 Artículo en XML
 Referencias del artículo
 Enviar artículo por email
Indicadores
 Citado por SciELO
 Links relacionados
-
 Similares en
SciELO
Similares en
SciELO
Compartir

 Permalink
Agrociencia
versión On-line ISSN 2521-9766versión impresa ISSN 1405-3195
Agrociencia vol.45 no.3 Texcoco abr./may. 2011
Recursos naturales renovables
Altitudinal genetic variation among Pinus patula populations from Oaxaca, México, in growth chambers simulating global warming temperatures
Variación genética altitudinal entre poblaciones de Pinus patula de Oaxaca, México, en cámaras de crecimiento simulando temperaturas de calentamiento global
Cuauhtémoc Sáenz-Romero1*, Jean Beaulieu2, Gerald E. Rehfeldt3
1 Instituto de Investigaciones Agropecuarias y Forestales, Universidad Michoacana de San Nicolás de Hidalgo (IIAF-UMSNH). Km 9.5 Carretera Morelia-Zinapécuaro. Tarímbaro, Michoacán 58880, México. (csaenzromero@gmail.com). * Author for correspondence.
2 Centre canadien sur la fibre de bois, Service canadien des forêts, Ressources naturelles, Canada. 1055 rue du P.E.P.S., CP 10380 Succ. Sainte-Foy, Québec QC, G1V 4C7, Canada. (jean.beaulieu@rncan-nrcan.gc.ca).
3 Forestry Sciences Laboratory, Rocky Mountain Research Station, USDA Forest Service, 1221 S. Main, Moscow, Idaho 83843, USA. (jrehfeldt@gmail.com).
Received: October, 2010.
Approved: April, 2011.
Abstract
Climatic change will decouple the matching between genotypes and environments. Studying the patterning of genetic variation among pine populations along altitudinal gradients under simulated climatic change temperatures, would provide insights about how to realign the present populations to future environments. Fourteen Pinus patula populations from the forests of the Native Indian Community of Ixtlán de Juárez, state of Oaxaca, México, were collected in January-March 2005 and 2006 along an altitudinal gradient (2400 m to 3050 m, one population every 50 m of altitudinal difference). Seedlings were grown in growth chambers at the Laurentides Forestry Center, Quebec city, Canada, under two temperature treatments aiming to simulate: contemporary temperature (average 17 °C) and a future global warming scenario (average 21 °C). Seedlings were evaluated after inducing a second growing season (between 8 and 12 months of age). Populations differed significantly (p≤0.001) for seedling height and aerial dry weight, and exhibited a significant (p≤0.02) although weak altitudinal clinal pattern, with populations from lower altitudes having on average taller and heavier seedlings than populations from higher altitudes (r2=0.064 and r2=0.094).
Key words: altitudinal gradients, altitudinal seed zoning, assisted migration, climate change, genetic differentiation.
Resumen
El cambio climático desfasará el acoplamiento entre genotipos y ambientes. El estudio de los patrones de variación genética entre las poblaciones de pinos a lo largo de gradientes altitudinales, bajo temperaturas simuladas de cambio climático, daría indicios sobre cómo realinear las poblaciones actuales a ambientes futuros. Se recolectaron 14 poblaciones de Pinus patula de los bosques de la Comunidad indígena de Ixtlán de Juárez, estado de Oaxaca, México, en enero-marzo de 2005 y 2006, a lo largo de un gradiente altitudinal (2400 m hasta 3050 m, una población cada 50 m de diferencia de altitud). Las plántulas fueron cultivadas en cámaras de crecimiento en el Laurentides Forestry Center (Centro Forestal de Laurentides), Quebec, Canadá, bajo dos tratamientos de temperatura con el objetivo de simular: la temperatura actual (promedio 17 °C) y un escenario futuro de calentamiento global (promedio 21 °C). Las plántulas fueron evaluadas después de la inducción de una segunda temporada de crecimiento (entre 8 y 12 meses de edad). Las poblaciones difirieron significativamente (p ≤0.001) en la altura de las plántulas y el peso seco aéreo, y mostraron un significativo (p≤0.02) aunque débil patrón clinal de altitud, con poblaciones de altitudes menores registrando en promedio plántulas más altas y de mayor peso que aquellas originadas a mayor altitud (r2=0.064 y r2=0.094).
Palabras clave: gradientes altitudinales, zonificación altitudinal de semillas, migración asistida, cambio climático, diferenciación genética.
Introduction
Pinus patula is one of the most important pine species for intensive commercial plantations worldwide due to its exceptional fast growth rate, good stem form and wood characteristics for cellulose products (Dvorak et al., 2000). Indeed, over 1 million ha had been planted by year 1990 in southern and western Africa and in western South America (Birks and Barnes, 1990). These included 300 000 ha of P. patula plantations under operational management in South Africa (Dvorak, 2003) , 100,000 ha in Swaziland and 50 000 in Colombia (Dvorak, 1997). Despite its high potential for intensively managed plantations in México (Velázquez-Martínez et al., 2004; Luna-Rodriguez et al., 2005), where it is endemic (Perry, 1991; Farjon and Styles, 1997), it has not been extensively planted in México so far (Velázquez-Martínez et al., 2004) : there are approximately 4230 ha planted in this country (Aurelio Fierros, 2010, personal communication4).
Due to global warming, in 2090 the annual average temperature would be increased by 3.7 °C in México (Saenz-Romero et al., 2010). Depending on the scenario, the extent of suitable habitat for P. patula could shrink from 3 % to 39 % by year 2050 (van Zonneveld et al., 2009). Because tree species are made of a collection of populations genetically adapted to local climate, these populations could come under such stress that either adaptation to the new conditions or migration might be required to avoid extirpation (Rehfeldt et al., 2006; St Clair and Howe, 2007; Aitken et al., 2008). Forest tree species might need human help to cope with changes that exceed their capacity of adaptation. Assisted migration is a strategy designed to migrate a plant only fast enough to track shifting habitats, and a series of moves will be required to keep the plant within its shifting natural range and in pace with a changing climate (Keel, 2007).
There are indications that P. patula populations from higher elevations are less productive than populations from lower altitudes, although those are results from studies where provenances of different altitudes came from different latitudes and longitudes (Salazar-García et al., 1999; Dvorak et al., 2000; Velázquez-Martínez et al., 2004). Thus, there is a need to study the genetic differentiation among populations along altitudinal gradients, without having the confounded effect of distant latitudes and longitudes to confirm the trend reported. Studying population variation along altitudinal gradients presents an opportunity to: 1) understand the microevolutionary patterning of genetic differentiation among populations for quantitative traits whose variation is indicative of environmental adaptations; 2) use such knowledge to develop guidelines to transfer seed sources adapted to current temperatures and for assisting migration due to predicted temperature increments (Saenz-Romero et al., 2006).
Studies in growth chambers provide an opportunity to simulate temperature conditions expected in the future, and, therefore, provide a better understanding of the performance of genotypes or provenances (Sonesson and Eriksson, 2000). Due to the lack of research on P. patula in growth chambers, the present study is as a first step to on such approach, testing temperatures that simulate those on current climate and predicted by General Circulation Models (GCM) (Christensen et al., 2007; Saenz-Romero et al., 2010) following global warming. Thus, the objectives of the present study were to determine whether: 1) there is genetic differentiation for seedling growth traits among populations located along an altitudinal gradient in northern Oaxaca, México; 2) such differentiation can be explained by this gradient; 3) differential growth occurs in response to temperatures that simulate (in growth chambers) present and future conditions.
Materials and Methods
Seed collection and plant production
Wind-pollinated cones were collected from 11 randomly selected trees from each of 14 P. patula natural stands distributed along an altitudinal transect, from 2400 m (17° 22.353' N, 96° 28.971' W) to 3050 m (17° 22.669' N, 96° 26.920' W), in the forests of the Native Indian Community of Ixtlán de Juárez, state of Oaxaca, México. Sampled populations were separated by an altitudinal interval of approximately 50 m, in order to have an intensive altitudinal sampling, but avoiding overlapped sampling of the populations. The group of trees from which the cones were collected in each stand are hereafter called population while the location of a population is called provenance.
Seeds were extracted manually and an evenly number of seeds per mother tree were mixed by provenances. Seed was washed with running tap water for 48 h, stratified for 17 d at 4 °C and sowed on 11-12 April, 2007, in 320 cm3 containers (IPL Rigi-Pot* 15-320; Saint-Damien, Quebec, Canada) filled with a mix of Fafard* peat-moss and Holiday*'s vermiculite (3:1 v:v). Two sound seeds were placed in each cell of the container and were then covered with a 0.5 cm layer of inert silicate, to avoid washing out of the seed by the irrigation. After germination, surplus seedlings were eliminated or transplanted in empty cells to achieve one seedling per container. Transplanting was conducted at a very early age (3 to 4 d after germination). The number of transplanted seedlings was less than 10 % of the total number of seedlings raised.
Seedlings were arranged in a randomized complete block design with 18 blocks, within which each of the 14 provenances were represented by a three-seedling row plot. Blocks of seedlings were distributed side by side and to prevent edge effects, blocks were accommodated in sets, such as seedlings of the border of the trays always had as neighbour side-by-side either seedlings of the same block or from other block, or surplus seedlings placed in the same type of containers to serve as protection rows.
Seedlings were raised according to the following schedule: 1) four months of growth in a greenhouse at the Laurentian Forestry Center, Canadian Forest Service, Natural Resources Canada, Quebec, Canada; 24 °C during the day and at 18 to 20 °C during night; cycles of 16 h of light and 8 h of darkness; watering and fertilization as needed (see details below); 2) transfer to an outdoors shadehouse in August 2007 (4-month-old), to promote bud setting, maintaining the same experimental design; 3) transfer to a cold room in October, 2007 (6-month-old), to satisfy chilling requirements at 2 °C in complete darkness for 6 weeks; 4) transfer to a greenhouse for four weeks, one week at 7 °C, one week at 10 °C o and two weeks at 16 °C for acclimation.
Growth chambers experiment
Seedlings (8-month-old) were transferred to growth chambers for four months (Environmental Growth Chambers GC-15; Chagrin Falls, Ohio, USA) to simulate the first part of the growing season under present temperatures in México (average 17 °C; cycles of 20 °C day and 14 °C night) and future predicted global warming temperature (average 21 °C; cycles of 24 °C day and 18 °C night).
Temperature regimes for the growth chambers attempted to simulate the average monthly temperatures that occurs between March and April (time when the elongation of the first shoot occurs at an intermediate altitude of the actual natural altitudinal range, 2725 m); temperature estimations were made based on 1961-1990 records of the nearest weather station, at Ixtlán de Juárez, Oaxaca, 17° 20' N, 96° 29' W, 2075 m; estimation for 2725 m was made by correction using a lapse rate of 0.5 °C for each 100 m of altitudinal difference. Future temperatures, estimated from General Circulation Model scenarios as 4 °C higher than present temperatures, were chosen to simulate the average increase of temperature estimated for Mexico and Central America, for March-May, 2080 to 2099, using an average of output from 21 global models for the A1B scenario (Christensen et al., 2007).
Both temperature regimes were randomly assigned to the six available growth chambers: three chambers for present and three for future temperatures. Three blocks were randomly allocated to each chamber on December 24th, 2007 when the seedlings were 8 months of age. Blocks and containers within blocks were rotated on approximately 10-day intervals to minimize possible edge effects inside the chambers.
Daylengths were maintained at 12 h with an uninterrupted night. Illumination averaged 184.3 ,µmol sec-1 m-2. We aimed at a compromise between light intensity below the risk of foliage damage (previous experience with full light capacity of the chambers induced some foliage damage), and enough to achieve some level of net photosynthesis (in previous experiments approximately 60 µmol sec-1 m-2 was the light compensation point for Picea glauca in the same growth chambers5). Seedlings did not show signs of etiolation with the light provided. Measurement was made at a height equivalent to the average base of the leading buds. There were no significant differences of illumination among groups of chambers with different temperatures (ANOVA, p=0.74).
Temperatures were recorded hourly with dataloggers, placed at a mid-height inside the growth chambers (StowAway TidbiT, USA; temperatures fluctuated between ±0.3 to ±0.7 °C around the temperature set). Each plant received three times per week approximately 88 mL of water, with soluble fertilizer one time per week. Watering was enough to fully reach field capacity in both treatments; although substrate under the higher temperature treatment was drier than the containers under the treatment of lower temperature before the next watering. Moisture contents were not significantly different among treatments (moisture measured with a Field Scout TDR 100, Spectrum Technologies Inc, USA; ANOVA among treatments after watering: p=0.960; right before next watering: p=0.084; Figure 1 shows the maximum and minimum moisture content for each treatment at two consecutive waterings). Soluble fertilizer provided (per plant) during the growth period in the growth chambers was approximately 145 mg N, 83 mg P and 145 mg K.

Data recording and statistical analysis
Initial seedling height was measured right after the seedlings were placed inside the growth chambers (when seedlings were eight months of age from sowing date), and final height was measured right before the growth chamber experiment ended (12 months of age). Measures (mm) were made from a solid surface lying across the surface of the containers to minimize measurement errors.
After final height measurement, seedlings were harvested to evaluate dry weight of above- and below-ground portions. Because harvesting of root system was time consuming and human resources were limited, only three blocks within one temperature treatment could be treated. Analyses of those three blocks did not show statistical differences among populations (ANOVA, p=0.979), among blocks (p=0.900) or interaction block by provenance (p=0.156). Thus, our results of dry weight deal with only the aerial portions.
In order to control the effect of differences on initial seedling size at the beginning of the experiment, analyses of variance of final seedling height and aerial dry weight were conducted using initial seedling height (eight months of age) as covariate. Analysis of covariance of final height and aerial dry-weight was performed using MIXED procedure (Littell et al., 1996; SAS Institute Inc., 1999), with the following full model:
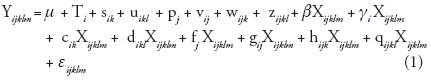
where Yijklm= seedling height or aerial dry weight of the mth seedling (m = 1, 2 or 3) of the lth block (l = 1, 2, or 3) of the kth growth chamber (k= 1, 2 or 3) from population j (j= 1, 14) subjected to the ith temperature (i=1 or 2); µ = overall mean; Ti = the fixed effect of the ith temperature; = the random effect of the kth growth chamber nested in the ith temperature, it is assumed that sik ~ N(0, σ2s ); u¡k¡ = the random effect of the lth block nested in the kth growth chamber and ith temperature, it is assumed that uikl~ N(0,σ2u); pj = the random effect of the jth population, it is assumed that pi - N(0, σ2p); = the random effect of population j specific to temperature i, it is assumed that vij ~ N(0, σ2v ); = the random effect of the group of seedlings from population j grown in growth chamber k at temperature i, it is assumed that wijk ~ N(0, σ2w ); zijkl= the random effect of the group of seedlings from population j assigned to block l of growth chamber k and temperature i, it is assumed that zijkl ~ N(0, σ2z ); Xijklm= covariate, the fixed effect of seedling height at the beginning of the experiment (at 8 months); β = average coefficient of the regression of Y on the covariate X over all conditions after correction for all fixed and random effects except residual error; gi = the fixed deviation of the slope of the regression of Y on X specific to the ith temperature treatment from b; ck , dikl, fj, gij, hijk, and qijkl are the random deviations of the slope of the regression of Y on X specific to the units defined by their indices; each random effect is assumed N(0, σ2r) where r = c, d, f, g, h, q, respectively; and εijk¡m = the random error term associated with the seedlings (i, j, k, l, m) and it is assumed thatεijk¡m ~ N(0, σ2e). All random effects are assumed mutually independent. All the interactions with the covariate were explored, considering that in some cases treatment (mainly temperature in our particular case) might influence both the response variable (final seedling height or dry weight) and the covariate itself.
The random part of the model for each response variable was then reduced by successively testing for the significance of each variance component. The process started with σ2q and ended with σ2s. If a given random effect was not significant at α=0.25, it was excluded from the model based on a chi-squared test of the difference between minus twice the log-likelihood of the reduced model (without the random effect whose variance component is being tested) and of the full model (Verbeke and Molenberghs, 1997; Saenz-Romero et al., 2001). After dropping a term, a new analysis was conducted with the successively reduced models. Thus, the final model was:

To test for significant altitudinal patterns of genetic variation, overall population means and population means per growth chamber were regressed on provenance altitude using REG procedure of SAS (SAS Institute Inc., 1999).
The LSD test (α=0.20) was conducted to estimate the altitudinal interval that must separate populations before being reasonably certain of genetic differentiation (Rehfeldt, 1991; Sáenz-Romero and Tapia-Olivares, 2008).
Results and Discussion
Differences between temperatures
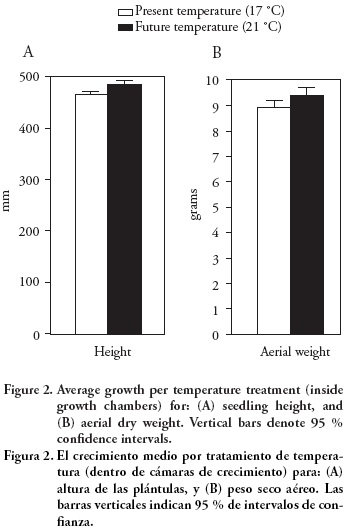
The means of final height and dry weight of aerial part of the seedling growing under simulated climate change temperatures (21 °C) were on average 4.6 % higher than those of seedlings growing under present temperatures (17 °C) (Figure 2). However, these differences were not significant for either seedling trait (p>0.35; Table 1). This result is after controlling for the effect of initial seedling height, which was highly significant (p≤ 0.001) for both the final seedling height and the dry weight of the aerial section (Table 1). Variation within treatments was large, which prevented to find out any statistically significant difference among the temperature treatments. Such results are not unusual and it has been proposed that more than one growing season inside the growth chambers might be required to detect significant differences (Sonesson et al., 2001), and up to three growing seasons have been recommended (Sonesson and Eriksson, 2000). While unexpected, differences among chambers within temperature treatments were statistically significant (p≤ 0.018). Small variation in air moisture due to differences in the efficiency of the ventilation system of the growth chambers (within temperature treatments) probably induced this variation in growth among chambers, although such differences were not enough to induce significant differences among chambers for aerial dry weight (p=0.655; Table 1).
We checked for possible edge effects inside the growth chambers, conducting an analysis of variance that compared the seedling growth among row positions. However, no significant variation could be found for any of the traits (p > 0.36, analysis not shown). In future experiments, additional efforts will have to be devoted to better standardize growth chamber conditions or, alternatively, the number of chambers within temperature treatments will have to be increased to reduce this source of error.
Although there are some evidence that relatively small pot size does not impede seedling growth if sufficient nutrients are provided by fertilization (McConnaughay et al., 1993), the lack of significant differences for root dry weight and shoot/root ratio, might be considered as indication that the container size limited root growth. If that were the case, it might be advisable to test larger pot sizes and also higher illumination rates, to stimulate seedlings' growth, particularly if longer experiments are conducted inside growth chambers. Longer experiments will have also the advantage of detecting possible differences among populations for shoot elongation dynamics along the growing season. One limitation of our study was that it lasted only four months inside the growth chamber, whereas the growing season of this multiple shoot-flushes species is larger (Gómez-Cárdenas et al. 1998).
A combination of both experiments of longer duration and use of larger containers, would undoubtedly require larger growth chambers. Perhaps a better approach would be to conduct the experiments using open air facilities, able to increase temperature and decrease precipitation, using a system (which should be developed) similar to the one used in the large-scale Free-Air CO2 Enrichment (FACE) experiments (Ainsworth and Long, 2005). Also, further experimentation is required testing treatments of drought stress to simulate the expected decrement of precipitation due to climatic change. Frost damage will be also relevant aiming to design an assisted migration strategy, since plants moved altitudinally upwards or to northern latitudes will face the risk of frost damage the first years after planting. Thus, experimentation testing a combination of factors as elevated temperatures, freezing temperatures and different moisture availability, as was done for P. glauca (Coursolle et al., 2002; Bigras et al., 2004), will be relevant.
Differences between populations
Height and aerial dry weight of seedlings varied significantly among populations (Table 1; p≤0.001). The percent of total variance contributed by population effects was of 4.3 % for height and 5.0 % for aerial dry weight (Table 1).
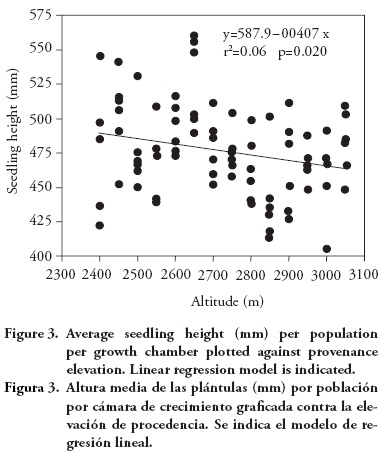
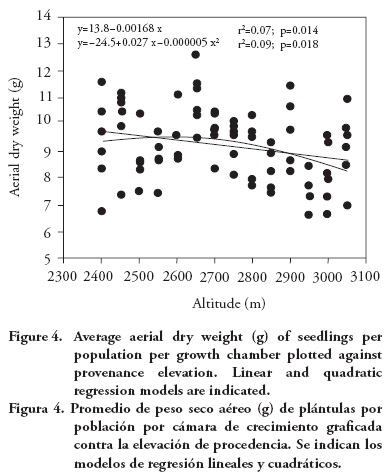
Population means for seedling height and aerial dry weight exhibited a clinal pattern, with populations originating from lower altitudes having in general larger seedling height and dry weight. The altitudinal pattern, although statistically significant, is relatively weak, as it can be seen from the regression analysis of population means per growth chamber against population altitude, for seedling height (r2=0.06; p=0.020; Figure 3) and for aerial dry weight (linear model: r2=0.07; p=0.014; Figure 4). Provenances from the low altitudinal limit exhibited relatively low average aerial dry weight, so a quadratic model has a fit slightly better than the linear model (quadratic model: r2=0.09; p=0.018; Figure 4).
This altitudinal pattern is globally consistent with results from field tests, with low altitude P. patula provenances showing higher growth (Dvorak et al., 2000) and a larger number of shoot cycles than provenances from higher altitudes (Salazar-García et al. 1999). The relative weakness of the altitudinal pattern found in this study is similar to that found among Pinus pseudostrobus provenances, for which there was a significant (although weak) negative correlations between altitude of the provenance and seedling growth (Viveros-Viveros et al., 2005). The weak relationship found for P. patula contrasts with the one for P. oocarpa, that has shown a stronger correlation between seedling growth and altitude or climatic variables (such as annual aridity index) of the provenances (Sáenz-Romero et al., 2006). Pinus devoniana (also known as P. michoacana) also has revealed clear altitudinal patterns of genetic differentiation among populations for frost damage (Sáenz-Romero and Tapia-Olivares, 2008).
The altitudinal interval that must separate two populations before one can be reasonably certain of genetic differentiation was estimated as 289 m of altitudinal difference, based on the least significant difference for seedling height (LSD=11.8 mm), translated to an altitudinal interval using the slope of the regression (β1=—0.04; Figure 3) of average seedling height per growth chamber against provenance altitude. That would lead to divide the altitudinal range at which P patula distributes in the region (from 2400 m to 3050 m of altitude) in three altitudinal zones. However, considering that the altitudinal pattern seems to be weak, we decided to wait for results from field tests at larger ages before moving on to construct guidelines for seedling movement.
Conclusions
Pattern of genetic variation among populations along the altitudinal gradient is significant, although weak, where populations originating from lower altitudes exhibit larger growth in seedling height and on aerial dry weight as compared to populations from higher altitudes.
Acknowledgements
Financial support was provided to CSR by the joint Forestry Research Fund of the Mexican Council of Science and Technology (CONACYT) and the Mexican National Forestry Commission (CONAFOR, grant 2005-C02-14783), and funding for a sabbatical year by Natural Resources Canada (NRCan), CONACYT (fellowship 75831), and Universidad Michoacana de San Nicolás de Hidalgo (UMSNH). Seed collection was possible thanks to Antonio Plancarte, Julio Ruiz, Samuel Ramírez, Mauro Aquino, Mayolo Ruiz, Eduardo Aquino and others from the forestry office of the Native Indian Community of Ixtlán de Juárez, Oaxaca and seed extraction by Rodrigo Niniz at UMSNH. Greenhouse, shade house and growth chambers experiments maintenance and dry weight samples processing at Quebec were possible thanks to Daniel Plourde, Eric Dussault, Audrey Lachance, Esther Pouliot, Patricia Sylvestre, Marie Deslauriers, Phillipe Labrie, Sebastian Clement, Patrick Laplante and others from NRCan. We thank statistical advice from Michéle Bernier-Cardou, NRCan. Unpublished P. patula information were provided by Aurelio Fierros, Gerencia de Plantaciones Forestales Comerciales, CONAFOR.
Literature Cited
Aitken, S. N., S. Yeaman, J. A. Holliday, T. Wang, and S. Curtis-McLane. 2008. Adaptation, migration or extirpation: climate change outcomes for tree populations. Evolutionary Applications 1:95-111. [ Links ]
Ainsworth, E. A., and S. P. Long. 2005. What have we learned from 15 years of free air CO2 enrichment (FACE)? A metaanalytic review of the responses of photosynthesis, canopy properties and plant production to rising CO2. New Phytologist 165: 351-372. [ Links ]
Bigras, F. J., C. Coursolle, and H. A. Margolis. 2004. Survival and growth of Picea glauca seedlings as a function of freezing temperatures and exposure times during budbreak and shoot elongation. Scandinavian J. For. Res. 19(3):206-216. [ Links ]
Birks, J. S., and R. D. Barnes. 1990. Provenance variation in Pinus caribea, P. oocarpa and P. patula ssp. tecunumanii. Tropical Forestry Papers 21. Oxford Forestry Institute. Oxford. 40 p. [ Links ]
Christensen, J. H., B. Hewiston , A. Busuioc , A. Chen, X. Gao, I. Held, R. Jones, R. K. Kolli, W. T. Kwon, R. Laprise, V. Magaña-Rueda, L. Means, C. G. Menéndez, J. Raisanen, A. Rinke, A. Sarr, and P. Whetton. 2007. Regional Climate Projections. In: Solomon, S., D. Qin, M. Manning, Z. Chen, M. Marquis, K.B. Averyt, M. Tignor and H.L. Miller (eds). Climate Change 2007: The Physical Science Basis. Contribution of Working Group I to the Forth Assessment Report of the Intergovernmental Panel on Climate Change. Cambridge University Press, Cambridge, UK and New York. pp: 847-940. [ Links ]
Coursolle, C., F. J. Bigras, and H. A. Margolis. 2002. Effects of root freezing on the physiology and growth of Picea glauca, Picea mariana and Pinus banksiana seedlings under different soil moisture regimes. Scandinavian J. For. Res. 17(3): 206-217. [ Links ]
Dvorak, W. S. 1997. The improvement and breeding of Pinus patula. Proc. Southern Forest Tree Improvement Conference. Orlando, Florida. pp: 53-68. [ Links ]
Dvorak, W. S. 2003. Pinus patula Schiede & Schltdl. & Cham. In: Vozzo, J.A. (ed). Tropical Tree Seed Manual. USDA Forest Service, pp: 632-635. [ Links ]
Dvorak, W. S., G. R. Hodge, J.E. Kietzka, F. Malan, L. F. Osorio, and T. K. Stangen. 2000. Pinus patula. In: Conservation and testing of tropical and subtropical forest tree species by the CAMCORE Cooperative. CAMCORE Cooperative, North Carolina State University, Raleigh, North Carolina. pp: 149-173. [ Links ]
Farjon, A., and B. T. Styles. 1997. Pinus (Pinaceae). Flora Neotrópica. Monograph 75. New York Botanical Garden, N.Y. 291 p. [ Links ]
Gómez-Cárdenas M., J. J. Vargas-Hernández, J. Jasso-Mata, A. Velasquez-Martinez, and Rodríguez-Franco, C. 1998. Annual growth pattern of the terminal shoot in young trees of Pinus patula. Agrociencia 32:357-364. [ Links ]
Keel, B. G. 2007. Assisted Migration as a Conservation Strategy for Rapid Climatic Change: Investigating Extended Photoperiod and Mycobiont Distribution for Habenaria repens Nuttall (Orchidaceae) as a Case Study. Ph.D. dissertation. Antioch University, New England. 160 p. [ Links ]
Littell, R. C., G. A. Milliken, W. W. Stroup, and R. D. Wolfinger. 1996. SAS System for Mixed Models. SAS Institute, Cary, North Carolina. 633 p. [ Links ]
Luna-Rodríguez, M., J. López-Upton, and L. G. Iglesias-Andreu. 2005. Morphometric and molecular (RAPD) variability in a plantation of Pinus patula in Veracruz, México. Agrociencia 39:231-235. [ Links ]
McConnaughay, K. D. M., G. M. Berntson, and F. A. Bazzaz. 1993. Limitations to CO2-induced growth enhancement in pot studies. Oecologia 94:550-557. [ Links ]
Perry, J. P., 1991. The Pines of Mexico and Central America. Timber Press, Portland, Oregon. 231 p. [ Links ]
Rehfeldt, G. E. 1991. A model of genetic variation for Pinus ponderosa in the Inland Northwest (USA): applications in gene resource management. Can. J. For. Res. 21: 1491—1500. [ Links ]
Rehfeldt, G. E., N. L. Crookston, M. V. Warwell, and J. S. Evans. 2006. Empirical analyses of plant-climate relationship for the western United States. Int. J. Plant Sci. 167(6):1123-1150. [ Links ]
Saenz-Romero, C., E.V. Nordheim, R.P. Guries, and P. M. Crump. 2001. A case study of a provenance/progeny test using trend analysis with correlated errors and SAS PROC MIXED. Silvae Genetica 50(3-4)127-135. [ Links ]
Sáenz-Romero, C., R. Guzmán-Reyna, and G.E. Rehfeldt. 2006. Altitudinal genetic variation among Pinus oocarpa populations in Michoacán, México; implications for seed zoning, conservation of forest genetic resources, tree breeding and global warming. For. Ecol. Manage. 229:340-350. [ Links ]
Sáenz-Romero, C., and B. L. Tapia-Olivares. 2008. Genetic variation in frost damage and seed zone delineation within an altitudinal transect of Pinus devoniana (P. michoacana) in México. Silvae Genetica 57(3):165-170. [ Links ]
Saenz-Romero, C., G. E. Rehfeldt, N. L. Crookston, P. Duval, R. St-Amant, J. Beaulieu, and B. A. Richardson. 2010. Spline models of contemporary, 2030, 2060 and 2090 climates for México and their use in understanding climate-change impacts on the vegetation. Climatic Change 102(3-4):596-623. [ Links ]
Salazar-García, J. G., J. J. Vargas-Hernández, J. D. Jasso-Mata, C. Ramírez-Herrera, y J. López-Upton. 1999. Variación en el patrón de crecimiento en altura de cuatro especies de Pinus en edades tempranas. Madera y Bosques 5(2):19-34. [ Links ]
SAS Institute Inc. 1999. SAS/STAT Computer Software. Release 8. SAS Institute Inc., North Carolina, 3809 p. [ Links ]
Sonesson, J., and G. Eriksson. 2000. Genotypic stability and genetic parameters for growth and biomass traits in a water x temperature factorial experiment with Pinus sylvestris L. seedlings. For. Sci. 46(4):487-495. [ Links ]
Sonesson, J., G. Jansson, and G. Eriksson. 2001. Retrospective genetic tests of Pinus sylvestris L. in growth chambers with two irrigation regimes and two temperatures. Scandinavian J. For. Res. 16:21-29. [ Links ]
St. Clair, J. D., and G. T. Howe. 2007. Genetic maladaptation of coastal Douglas-fir seedlings to future climates. Global Change Biol. 13:1441-1454. [ Links ]
van Zonneveld, M., A. Jarvis, W. Dvorak, G. Lema and C. Leibing. 2009. Climate change impact predictions on Pinus patula and Pinus tecunumanii populations in Mexico and Central America. For. Ecol. Manage. 257:1566-1576. [ Links ]
Velázquez-Martínez, A., G. Angeles-Pérez, T. Llanderal-Ocampo, A.R. Román-Jiménez, y V. Reyes-Hernández. 2004. Monografía de Pinus patula. Comisión Nacional Forestal, México. 124 p. [ Links ]
Verbeke, G., and G. Molenberghs (eds). 1997. Linear Mixed Models in Practice. Springer, New York. 300 p. [ Links ]
Viveros-Viveros, H., C. Sáenz-Romero, J. López-Upton, and J.J. Vargas-Hernández. 2005. Altitudinal genetic variation in plant growth of Pinus pseudostrobus Lindl. in field testing. Agrociencia 39(5):575-587. [ Links ]
4 Gerencia de plantaciones Forestales Comerciales, Comisión Nacional Forestal, Guadalajara, Jalisco, México. Información updated May 18th, 2010.

