


Servicios Personalizados
Revista

Articulo
 Inglés (pdf)
 Artículo en XML
 Referencias del artículo
 Enviar artículo por email
Indicadores
 Citado por SciELO
 Links relacionados
-
 Similares en
SciELO
Similares en
SciELO
Compartir

 Permalink
Agrociencia
versión On-line ISSN 2521-9766versión impresa ISSN 1405-3195
Agrociencia vol.44 no.1 Texcoco ene./feb. 2010
Agua–suelo–clima
Enhancement of the greenhouse air ventilation rate under climate conditions of central Mexico
Mejora de las tasas de ventilación de invernaderos bajo condiciones climáticas del centro de México
Pedro Romero–Gómez1, Christopher Y. Choi1 , Irineo L. Lopez–Cruz2*
1 Department of Agricultural and Biosystems Engineering, The University of Arizona.
2 Postgrado en Ingeniería Agrícola y Uso Integral del Agua. Universidad Autónoma Chapingo. Km. 38.5 Carretera México–Texcoco. Chapingo, México. *Author for correspondence: (ilopez@correo.chapingo.mx).
Received: April, 2008.
Approved: September, 2009.
Abstract
Mexican plastic–covered greenhouses use natural ventilation as the main method to control temperature and humidity. However, no studies on the dynamic behavior of airflow and ventilation rates are available. In the present study, air exchange rates were analyzed in a naturally–ventilated greenhouse in Mexico using Computational Fluid Dynamics (CFD). To enhance greenhouse cooling, roof vent areas and screen characteristics were examined undef various scenarios to quantify ventilation rates. The air exchange rates through the tight insect screen (model S) were about 50 % of those achieved with actual and loose insect screen (model SF) at the same outside wind speed. Enlargement of the roof vent size ftom 6 % (current) to 15 % of the greenhouse–floor area increased the ventilation rate by 20–40 % at wind speeds ranging from 0 to 4 m s–1. However, extensions of insect–proof screens area on side–walls did not produce any significant change in the ventilation rate. Greenhouse orientation was also considered to maximize cooling effects under the local climate condition, and the ventilation rate could be enhanced by positioning the roof vent area in a prescribed direction based on the average wind speed.
Key words: CFD, greenhouse, natural ventilation, rates.
Resumen
Los invernaderos mexicanos con cobertura plástica usan la ventilación natural como el método principal para controlar la temperatura y la humedad. Sin embargo, no hay estudios sobre el comportamiento dinámico del flujo del aire y las tasas de ventilación. En el presente estudio se analizaron las tasas de intercambio de aire en un invernadero con ventilación natural en México, utilizando Dinámica de Fluidos Computacional (CFD). Para mejorar el enfriamiento del invernadero se examinaron las áreas de ventilación cenital y las características de la malla bajo varios escenarios, para cuantificar las tasas de ventilación. Las tasas de intercambio de aire a través de malla anti insectos más densa (modelo S) fueron alrededor de 50 % de las alcanzadas con malla anti insectos real y menos densa para insectos (modelo SF), con la misma velocidad del viento exterior. Aumentar el tamaño de la ventila cenital de 6 % (actual) a 15 % del área de piso del invernadero aumentó la tasa de ventilación en 20–40 % con velocidades del viento entre 0 y 4 m s-1. Sin embargo, ampliaciones del área de malla anti insectos en las paredes laterales no produjeron cambios significativos en la tasa de ventilación. También se consideró la orientación del invernadero para maximizar los efectos de enfriamiento en las condiciones climáticas locales, y la tasa de ventilación podría mejorar al colocar el área de ventilación cenital en una dirección sugerida con base en la velocidad promedio del viento.
Palabras clave: CFD, invernadero, ventilación natural, tasas.
INTRODUCTION
Computational Fluid Dynamics (CFD) has been applied to greenhouse microclimate modeling for more than two decades. Most studies are devoted to describing flow and temperature fields inside the greenhouse, calculating air exchange rates, and optimizing vent size and location. Overall, modelers and researchers aim to examine the performance of cooling systems, which may be propelled either by mechanical means (active cooling) or by natural processes (passive cooling). Boulard et al. (1996) stated that two driving forces induce greenhouse ventilation: forced convection via external wind, and free convection via buoyancy, whereas the fluid flow and energy equations that govern air movement inside the greenhouse and through its openings were described by Boulard et al. (2002). Haxaire et al. (2000) and Boulard et al. (2002) included turbulence equations because the internally developed flows are fully turbulent.
Haxaire et al. (2000) studied CFD simulations and experimental verifications of internal air temperature and humidity patterns within a naturally ventilated greenhouse; because wind forces mostly influenced ventilation, they used the k — ε turbulence model that primarily describes the turbulent kinetic energy (k) and its dissipation rate (ε). A three–dimensional CFD setup was developed where solar radiation was simulated by imposing a heat flux boundary condition on the ground, and a porous jump condition was used to simulate the insect screen (Campen et al., 2003). Bartzanas et al. (2002) completed numerical simulations primarily focused on the differences in airflow and temperature patterns between a greenhouse with and without insect screens. Three–dimensional CFD studies were used by Kacira et al. (2004) as a design tool of greenhouse structures under natural ventilation for modeling and optimizing ventilation rates on eight inlet/outlet vent configurations.
Most of the greenhouse research using CFD has been conducted in Japan, Holland, England, Spain, and the USA, where greenhouse industries are well established. As a result, the technical information available for both structure designs and control strategies is adapted to their respective environmental conditions. Thus, it becomes essential to develop and to design structures suitable for local environmental conditions in specific countries and regions where the greenhouse industry is rapidly growing.
The objective of the present study was to analyze air exchange rates using CFD in a naturally ventilated greenhouse in central México. Specific goals were: 1) to carry out simulations of various scenarios with actual and modified insect screen properties and roof vent areas; 2) to assess air flow characteristics and corresponding ventilation rates due to insect–proof screens; 3) to investigate various screen installation scenarios, which include the removal of screens, five different screen models, and two extended–screen scenarios; 4) to examine the effects of three scenarios of roof vent areas on ventilation rate (i.e., roof vents at 6 % of the greenhouse–floor area for the actual case, and 10 % and 15% for the increased areas for additional scenario). In summary, this study focused on developing input parameters and technical guidance that may be useful in designing greenhouses in conjunction with local climatic conditions in central México.
MATERIALS AND METHODS
Test greenhouse
The present study was conducted in a greenhouse at the Tlapeaxco experimental station of the University of Chapingo, Chapingo, Mexico. The greenhouse is located at 19° 29' 04.1" N, 98° 53' 08.9" W, and 2244 m above sea level. As shown in Figure 1, the greenhouse is three–spanned, and gutter–connected with arched–roofs. It is 27 m wide (9 m each span), 40 m long, and 5.3 m high (2.1 m gutter height) with 48° NE–SW ridge orientation and with 4300 m3 total volume. The total roof and sidewall vent areas are 60 m2 (5.6 % of the greenhouse ground area, facing SE) and 168 m2 . Single–layer polyethylene film was used for the roof and side–wall covers. Polyethylene insect screens were installed on the sidewall and roof vents, and their physical properties were determined during this study (Table 2). Natural ventilation through these vents was the only cooling mechanism.
Fundamental equations
CFD simulations consist of numerically solving the Navier–Stokes equations over a discrete domain (Anderson, 1995). The set of equations for a steady–state, incompressible flow is as follows:
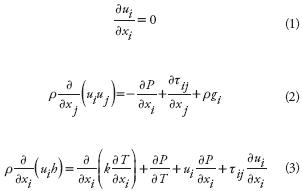
where ui is the velocity component in i–direction (m s–1), xi indicates i–direction, r is the air density (kg m–3), P is the pressure (Pa), gi is any field acceleration in the i–direction (m s–2 , only gravitational acceleration for this case), h is the enthalpy (J kg–1 ), k is air conductivity coefficient (W m–1 K–1 ), T is the absolute air temperature (K), and µ is the air molecular viscosity (kg s–1 m–1). In this study, the k–ε model (Boulard et al., 2002) was used as it has been widely applied in practical parametric studies with reasonable accuracy. The turbulence kinetic energy (k, m2 s–2 ) and its rate of dissipation (ε, m2, s–2) are defined in the following transport equations:
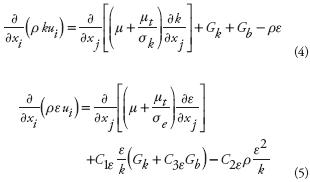
where turbulent viscosity ( µt , kg m–1 s–1), turbulent kinetic energy production (Gk , kg m–1 s–3), and production of turbulent kinetic energy due to buoyancy (Gb , kg m–1 s–3) were calculated with the following relations:
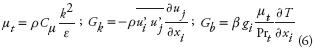
where u'i is the fluctuating velocity component in i–direction (m s–1), β is the thermal expansion coefficient (K–1), and Prt is the dimensionless turbulent Prandtl number. Default coefficients given by FLUENT (Fluent, 2005)3 are used in all calculations; i.e., C1ε = 1.44, C2ε = 1.92, Cµ = 0.09, C3ε = tanh (abs(v/u)), σk =1.0, and σe = 1.3.
Numerical setup
The finite–volume method computer package FLUENT® was used for CFD simulations of natural ventilation. A two–dimensional mesh with 22 966 cells represented a real area of 39 m–W × 20 m–H. About 15 % of this area corresponded to the greenhouse space and the remaining to a large surrounding region. Finer cells were required adjacent to walls due to expected large gradients, with a gradual increase in cell size away from the walls. Two rectangles of 18.5 m–W × 1.2 m–H each corresponded to the actual area occupied by plants. As an example, one span segment is presented in Figure 2 to show the detailed, non–uniform grid arrangement. Hydrodynamic, thermal and turbulence boundary conditions, summarized in Table 1, were used for computational simulations on all surfaces as shown in Figure 3.
Because plants in the greenhouse introduce a physical resistance to airflow, the representative areas were modeled as porous media regions. Plants generally form coarse, porous zones, where Darcy's law fails. Non–Darcy effects and boundary conditions along the fluid–porous interface have been analyzed by Choi and Kulacki (1993), Kim and Choi (1996), and Choi and Waller (1997). In the present study, the user–input properties for such models were permeability (α), inertial resistance coefficient (C2), and porosity (γ). The values were obtained from wind tunnel experiments (Sase, 2004; personal communication) and Haxaire et al. (2000); four tomato plants were used, and their values were α = 0.017 m2 , C2 = 0.31 m–1 , and γ = 20 %.
Because low wind speeds in the range of 0.6–1.5 m s–1 prevail in central México throughout the year (Canche–Mis, 2003; personal communication), free and mixed convection, instead of forced convection, may mostly drive air exchange. For greenhouse applications, determination of the dominant mode of convection can be made using a combination of the Reynolds number (Re) and the Grashof number (Gr) or the Richardson number (Ri) where Ri=Gr/Re2 (Atarassi et al., 2006). Accordingly, the five percent deviation rule can be applied to define the mixed convection regime deviating from natural and forced convection asymptotes (Choi and Kim, 1996). Here, the Grashof number depends on air density, which is a function of air temperature, ρ (T). The buoyancy effect is modeled with the Boussinesq approximation:

where ρ0 (operating pressure, kg m–3) and To (air temperature, K) are constant reference values, and the volumetric thermal expansion coefficient, β, can be calculated based on the ideal gas assumption:

Insect screens
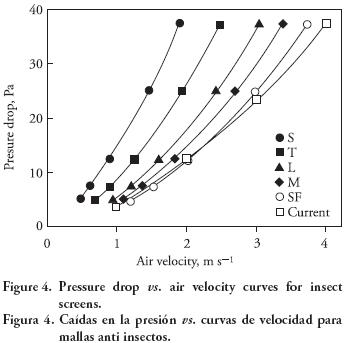
Insect–proof screens have previously been modeled as porous jumps due to the pressure drop of air flowing through them. In the present study, the pressure drop was calculated as follows:

where α (face permeability, m2 ), C2 (pressure–jump coefficient, m–1), and ΔJ (porous–jump thickness, m) were user–inputs. These parameters were obtained from v–ΔP curves of five commercial screen models and the one for the currently installed screen through a series of wind tunnel experimental measurements. The pressure drop curves are shown in Figure 4, and listed in Table 2, for a screen thickness equal to 0.05 mm. A1 and A2 are the first– and second–order coefficients of the polynomial, obtained by wind tunnel experiments using the samples of the installed screen. The air exchange rate of each screen model was quantified as a function of outside wind speed.
Vent area
The side–wall windows of the test greenhouse occupy the maximum possible area (168 m2). However, roof–windows may be considerably enlarged given that they represent only 6 % of greenhouse ground area (60 m2). Therefore, this percentage was increased to 10 % and 15 % by increasing the roof–vent area up to 108 m2 and 162 m2. The new greenhouse geometries were created with the pre–processor GAMBIT, maintaining the curved shape of the roof. This allowed to quantify the impact of the vent area on the ventilation rate over a wind speed range from 0 m s–1 to 4 m s–1.
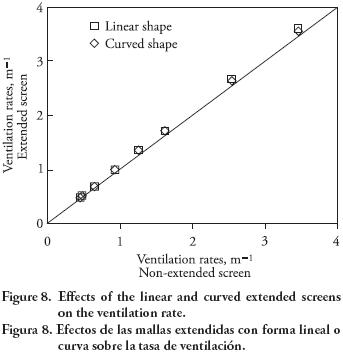
Greenhouse managers and researchers commonly assume that air exchange rates will increase when screens are extended. However, from the standpoint of fluid mechanics, this assumption may not be true since the inlet cross–sectional area to the greenhouse structure remains the same. In order to examine this unsubstantiated hypothesis, CFD simulations were performed on modified side–wall geometries shown in Figure 5. By using these two types of geometries, not only did we test the effect of extended screening, but also its shape on natural ventilation rates. CFD simulation tools are well suited for these parametric studies under various environmental conditions for different geometries. A linear extension is shown in Figure 5a, curved shape at the side–walls is depicted in Figure 5a, enlarging the contact area up to 185.6 m2 and 192 m2. With these simulations, we examined the maximum ventilation rates that this greenhouse may potentially supply upon improving the structure design. Therefore, all vents were considered open, the roof–vent area was 15 % of the greenhouse–ground area, and insect screen properties were from model L (Table 2 and Figure 4).

RESULTS AND DISCUSSION
On insect–proof screen effects
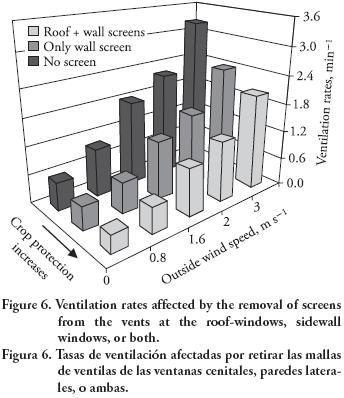
Although insect screens are always recommended for crop protection, many greenhouses do not have them on the roof vents, especially those with movable roofs. The removal of the screen from roof vents produces higher ventilation rates (Figure 6). Air changes range from 1.2 to 1.3 times more than those with screens on roof vents in addition to side–wall windows. This increase is even higher if screens are removed altogether, from side–walls as well, reaching values 1.5 to 2 times larger than under all–windows screening. The practical use of these findings is linked to the greenhouse management that each grower implements. Side–wall screening is always recommended in order to prevent major crop damages due to insects. Roof vent screens may alternatively be removed for better cooling, except if crops show high susceptibility to insects. Thus, the critical trade–off between crop protection and ventilation is shown in Figure 6. Additional simulation results in this study correspond to a greenhouse with screens mount at all vents.
The pressure drop and corresponding ventilation rate for each screen model over the range of wind speed from 0 to 4 m s–1 is shown in Table 3– It is observed that the installed screen and model SF have similar resistance characteristics. Model SF and M screens from ECONET are designed to prevent the intrusion of aphids (e.g. Aphis gossypit) and whiteflies (e.g. Bemisia argentifolit) (US Global Resources, 2008). Screens model M reduce air exchange by 10 % with respect to current screening. If model L is used, leafminer (e.g. Liriomyza trifolii) may also be excluded to reduce air exchange by 10–15 % with respect to the current screen selection. Although T and S models may provide a better crop protection, they significantly reduce ventilation (30 to 50 % with respect to current screening). As a consequence, their use in this greenhouse may be only practical in conjunction with mechanical ventilation. Thus, various screen options must be considered based on local historical pest data because potential pest damages will vary from region to region. In the subsequent section of this paper, the computational simulations are solely based on a greenhouse with model L screens.
From the information presented in Table 3, it can be observed that similar values of pressure drops do not necessarily lead to similar ventilation rates, for example, ΔP = 41.1 Pa at 2 m s–1 36.4 Pa at 3 m s–1 , and 42.6 Pa at 4 m s–1 for model S, model L, and model SF. Nevertheless, the resulting ventilation rates are 0.64, 1.76 and 2.76 min–1. Therefore, screen properties must also be taken into account when relating the pressure drop to the ventilation rate. For the chosen set of screen models, a linear regression shown in Figure 7 presents a curve fit based on the data points from Table 3 when the coefficient A2 of the v–ΔP polynomial for each screen is included. An advantage of this approach is that the CFD simulation of any new screen model can be bypassed and the ventilation rate may still be directly quantified. However, the empirical model is only valid for screen curves that fall into the pressure range (ΔP < 140). When the contact area of insect screens is extended in either a linear or a curved shape (Figure 5), the increase of the natural ventilation rate is negligible, as depicted in Figure 8.

On roof vent area
The evaluation of ventilation rates as a function of external wind speed and roof vent area is shown in Figure 9. When the roof vent area is about 10 % of the greenhouse–floor area, ventilation rates range from 0.45 to 2.87 min–1 at the wind speed from 0 to 4 m s–1. Thus, air exchange rates increase about 15–20 % with respect to the current roof vent area. As the roof vent area increases to equal 15 % of the greenhouse–floor, the ventilation rate increases from 0.48 to 3.45 min–1 or what amounts to 20–40 % higher than those with the current area at the same wind speed range. In this case, to supply at least one air change per minute, the required westward wind speed drops by 30 % (from 1.8 to 1.3 m s–1). It is important to note that the dominant wind speed in the region is low (0.6–1.5 m s–1) as indicated earlier, and the roof area can be readily extended.

In order to examine the structure orientation that may provide higher ventilation, a series of simulations were performed over a greenhouse with vent roof size equal to 15 % of the greenhouse–floor area. There is a slight difference in the ventilation rate due to eastward and westward winds, as shown in Figure 10. It is interesting to note that the westward wind produces higher ventilation rate only with high wind speed (>1.4 m s–1 based on CFD simulation results), whereas the opposite trend is observed at low wind speeds (eastward winds produce higher ventilation rates at ws<1.4 m s–1). Because local wind speed is predominantly less than 1.5 m s–1 eastward winds are therefore more beneficial for greenhouse cooling than westward winds. In this way, CFD simulations provided a guideline for the most favorable greenhouse orientation in order to achieve maximum cooling effects during the summer.

CFD tools enable to visualize flow and temperature fields developed by the external wind.
Path lines and isotherms inside and, in the vicinity of, the greenhouse are shown in Figures 11a–d; in this case, wind blew at a speed of 0.8 m s–1 and outside air temperature (To) was 293 K. In Figure 11a it is shown that for eastward winds, all roof vents are leeward, although two roof vents act as air inlets and the remaining one serves as an air outlet. Air entering through the roof vents provides little aeration within the plant zone, moving instead over the plants. Clustered path lines indicate that high air velocities are developed just above the roof due to accelerating wind over the dome. Air entering through the right side–wall window moves and decelerates while traveling from one wall to the opposite side.
The distribution of temperatures in Figure 11b completes the description of the ventilation effect on internal temperature. As the cooler outside air enters the greenhouse and mixes with the hot air inside, temperature increases gradually until it reaches 302 K (+9 K contour, with respect to outside air temperature) on the other side of the greenhouse. Figure 11c and 11d represent the case when wind blows westward. Here, only one roof vent acts as inlet and two serve as outlets (Figure 11c). Thus, the trend lowers the ventilation rates as shown in Figure 10. Consequently, the temperature gradient within the greenhouse is higher than eastward winds, and the maximum contour is equal to +11 degrees in Figure 11d. Thus, the direct correlation between ventilation rates and internal temperature is evident. It should be noted that the present study only considers incoming radiation energy, even though other energy inputs such as evapotranspiration are also significant and may further change temperature profiles. This case also illustrates that a heterogeneous internal environment may be developed under natural ventilation over three spans.
CONCLUSIONS
The present study used Computational Fluid Dynamics (CFD) to analyze the internal microclimate conditions developed in a naturally–ventilated greenhouse under the local climate in central México. The CFD models predicted higher ventilation rates of the roof vent area without insect screens. The behavior of ventilation rates as affected by outside wind speeds and vent configurations showed a critical trade–off between crop protection and greenhouse ventilation. Additionally, the direction of the roof vent (thus the overall direction of the greenhouse structure) plays a significant role. A larger roof vent area can greatly enhance ventilation, while the extension of an insect–proof screen on side walls hardly changes the air exchange rate. Thus, computational parametric studies on new greenhouse structures can contribute to identify relevant design factors that affect greenhouse cooling under specific local climate conditions.
LITERATURE CITED
Anderson, J. D. 1995. Computational Fluid Dynamics. The Basics with Applications. McGraw–Hill Inc. New York. USA. 547 p. [ Links ]
Atarassi, R. T., M. V. Folegatti, and R. P. Camponez do Brazil. 2006. Convection regime between canopy and air in a greenhouse. Scientia Agrícola 63: 77–81. [ Links ]
Bartzanas, T., C. Kittas, and T. Boulard. 2002. Numerical simulation of the airflow and temperature patterns in a greenhouse equipped with insect–proof screen in the openings. Acta Horticulturae 578: 351–358. [ Links ]
Boulard, T., C. Kittas, J. C. Roy, and S. Wang. 2002. Convective and ventilation transfers in greenhouse, Part 2: determination of distributed greenhouse climate. Biosystems Eng. 83: 129–147. [ Links ]
Boulard, T., J. F. Meneses, M. Mermier, and G. Papadakis. 1996. The mechanisms involved in the natural ventilation of greenhouse. J. Agric. For. Meteorol. 79: 61–77. [ Links ]
Campen, J. B., and G. P. A. Bot. 2003. Determination of greenhouse–specific aspects of ventilation using three–dimensional computational fluid dynamics. Biosystems Eng. 84: 69–77. [ Links ]
Choi, C. Y., and S. J. Kim. 1996. Conjugate mixed convection in a channel: Modified five percent deviation rule. International J. Heat and Mass Transfer 39: 1223–1234. [ Links ]
Choi, C. Y., and P. M. Waller. 1997. Momentum transport mechanism for water flow over porous media. J. Environ. Eng. ASCE 123: 792–799. [ Links ]
Choi, C. Y., and F. A. Kulacki. 1993. Non–Darcian effects on mixed convection in a vertical packed sphere annulus. J. Heat Transfer–Trans. The ASME 115: 506–510. [ Links ]
Haxaire, R., T. Bourlard, and M. Mermier. 2000. Greenhouse natural ventilation by wind forces. Acta Horticulturae 534: 31–40. [ Links ]
Kacira, M., S. Sase, and L. Okushima. 2004. Optimization of vent configuration by evaluating greenhouse ad plant canopy ventilation rates under wind–induced ventilation. Trans. ASAE 47: 2059–2067. [ Links ]
Kim, S. J., and C. Y. Choi. 1996. Convective heat transfer in porous media and overlying fluid layers heated from below. Int. J. Heat and Mass Transfer 39: 319–329. [ Links ]
US Global Resources. LS ECONET Website. 2005. http://insect-screen.usgr.com/econet-insect-screen.html. Accessed, May 2005. [ Links ]
3 Fluent Inc. 2005. Fluent 6.2 User's guide.

