


Servicios Personalizados
Revista
Articulo
 Inglés (pdf)
 Artículo en XML
 Referencias del artículo
 Enviar artículo por email
Indicadores
-
 Citado por SciELO
 -
 Accesos
Links relacionados
-
 Similares en
SciELO
Similares en
SciELO
Compartir

 Permalink
América Latina en la historia económica
versión On-line ISSN 2007-3496versión impresa ISSN 1405-2253
Am. Lat. Hist. Econ no.34 México jul./dic. 2010
Artículos
The Gold Rush Origins of California's Wheat Economy
James Gerber
James Gerber received his Ph. D. in Economics from the University of California, Davis. He is professor of Economics and director of the International Business Program at San Diego State University.
Fecha de recepción: junio de 2009
Fecha de aceptación: julio de 2009
Resumen
Este ensayo explora el casi simultáneo desarrollo de la fiebre de oro y la producción de cereales en la década de 1850 en California. Modelos económicos predicen que la producción de bienes de consumo, como el trigo, no se puede expandir durante un auge del sector minero si existe una fácil disponibilidad de importación, debido a que los costos del trabajo y otros insumos son altos. Diversos historiadores han enfatizado los impactos de la inmigración y el crecimiento del mercado local. Una mirada más cercana del tiempo y la secuencia de los cambios en la producción muestran que un declive de la producción de los bienes comerciales concuerdan relativamente bien con el caso californiano. Sin embargo, hubo fenómenos adicionales que facilitaron el crecimiento de la producción del trigo y otros cereales, incluyendo los cambios tecnológicos en el sector minero, el empleo de población indígena, el relativo aislamiento de California en la economía atlántica del norte y el descubrimiento de oro en Australia.
Palabras clave: Minería, época de oro, convergencia de precios, integración económica, comercio de cereales, desindustrialización, desequilibrio.
Abstract
This paper explores the near–simultaneous development of the gold rush and grain production in California during the early 1850s. Economic models predict that the production of tradable goods such as wheat are unlikely during a mineral boom due to the availability of imports and the high cost of labor and other inputs. Historians have emphasized the effects of immigration and the increase in the size of the local market. A closer examination of the timing and sequencing of production shifts shows that a decline in tradable goods production fits the California case relatively well. In addition, wheat and other cereals output increased for several reasons, including the timing of technological changes in mining, the use of native American labor, California's relative isolation from the North Atlantic economy, and the discovery of gold in Australia.
Key words: Mining, gold rush, price convergence, economic integration, grain trade, de–industrialization, disequilibrium.
GOLD RUSHES AND WHEAT EXPORTS
Agricultural histories of California during the gold rush period tend to focus on the years after 1860, by which time the chaos of the mineral boom had disappeared and grain shippers were sending large cargoes of wheat to Great Britain. One consequence of this focus is that economic historians have overlooked the decade of the 1850s, when the wage and price effects of the gold rush were still factors in the regional economy, the state's ability to feed itself was in doubt, and no one believed it would be possible to ship exports 14 000 miles across two oceans and be competitive in British grain markets. Significant production of wheat and flour did not start in the 1860s, but in 1852, the same year as the peak in gold production.1 Production took off then even though the state's leading newspaper had editorialized the year before that "It may be some years ere the State shall produce sufficient breadstuffs for home consumption."2 That is, the reality of self sufficiency and an export surplus in 1854 came as a surprise to the locals; the timing should also be surprising to economic historians because analysis of mineral booms –the so–called Dutch disease model– shows that the production of tradable goods shrinks during positive supply–side shocks such as gold rushes.3 California, however, appears to be exceptional, since it seems to be a case where a mineral boom led to an expansion of tradable goods.
The scale of grain production was remarkable. As early as 1860, California was the number one barley producing state in the nation, and by the late 1870s, between ¼ and ¾ of the grain shipped from the United States to Great Britain each year originated in California, a situation that persisted for nearly two decades.4 In the 1880s, the state produced more than a 1 000 000 tons of wheat per year, and exports to Great Britain had become "a potent factor in European food supplies".5 By 1890, California was second largest wheat producing state in the nation.6
Since the work of H. H. Bancroft in the 1880s, nearly all historians have attributed the expansion of wheat farming to immigration: the domestic market was growing and people have to eat. The economic reasoning is as follows: Let our model have two sectors, grain and other goods. Grain is labor intensive. Increase the supply of labor through immigration and Rybczynski assures us that grain production will go up.7 The problem with this interpretation is that it relies on a two sector model. Add immigrants to the mix in a three sector model with a booming mineral sector, an expanding service sector, and the logic dictates a lagging (declining) tradable goods sector. In other words, discouraged miners may have wanted to become grain farmers, but the story of how they overcame the economic disincentives cannot rely on immigration given that input prices were higher than world levels while output prices were around world levels. If, for example, the 1850s western frontier of Kansas and Minnesota had had labor costs of $4 to $6 per day for common labor instead of $1.17 to $1.22, then it seems unlikely that wheat farming would have taken off in that region.8
The early development of an export oriented agricultural sector was dependent on the confluence of several factors which have not been recognized. While many historians point to significant changes in mining technology around 1851–1852, the economic implications of the adoption of atypical (for the United States) labor relations with native Americans which Anglo–Americans adopted from Mexican and Spanish colonists, is less well appreciated. Furthermore, the consequences of the state's relative isolation from national and North Atlantic economies, and its relative closeness to grain supplies at competitive world prices from Chile and Australia have not been considered in the context of the state's agricultural take–off. In addition, the timing of the 1851 discovery of gold in Australia was an exogenous demand shock which intensified the importance of trans–Pacific economic relations, not only with Australia. Each of these factors contributed to the early growth of staple based agriculture and point to the need for a closer look at the timing of the takeoff in grain production.
THE GOLD RUSH AND GOLD PRODUCTION
Gold was discovered in California on January 24, 1848, in the foothills of the Sierra Nevada mountains. At the time, California was a sparsely populated territory in the far northwest corner of the Mexican empire. Mexico's regional capital of Monterey had been occupied for approximately eighteen months by US naval forces, and a small garrison of soldiers was stationed in the village of Yerba Buena, later renamed San Francisco. Two weeks after the discovery of gold and before the news had spread beyond the immediate vicinity, Mexico signed the Treaty of Guadalupe Hidalgo, ceding California and most of the American southwest to the US. At the time, San Francisco was relatively isolated from the world economy and served mainly as a resupply station for a Pacific whaling fleet that had been growing since the early 1840s. There were about 459 people in the town, not counting US troops, while the population of the entire state was approximately 15 000, not counting Native Americans.9 Wright divides the nonindigenous population into native Californians (7 000), US citizens (6 000) and a "sprinkling of foreigners", based on estimates of citizenship.10 Among the estimated 7 000 native Californians, for example, the share that was mestizo or indigenous is unknown. In September of 1850, two and one–half years after the gold discovery, California entered the Union, and by 1851 the customs district of San Francisco was generating more than $2 000 000 in annual import duties, the fifth highest total in the nation.11 The special state census of 1852 counted 255 122 people in the state (not counting those living outside the bounds of European American or Mexican American society) and 36 154 in San Francisco.12
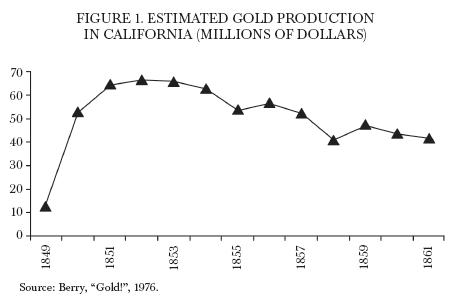
Figure 1 illustrates Berry's best estimates of the output of gold from 1849 to 1861.13 The production pattern shows a sharp rise in output during each year for four years (1848 to 1851), followed by a leveling off in 1852 and then a gradual decline. Production figures for 1848 are unknown but they were certainly less than 1849 and probably a great deal less. The smaller state population, unfamiliarity with the geography of the gold region, and ignorance of basic gold mining techniques until the arrival of Sonorans and Chileans late in 1848 and early in 1849, undoubtedly held back total production in the first year. The absolute peak came in 1852 and was concurrent with a steep drop in the marginal increase of production. The leveling off of gold output is significant because it also signaled a shift in mining technology, away from labor intensive production by independent entrepreneurs and toward capital intensive techniques with hired labor. One of the first mining engineers to survey the mineral resources of the Far West, wrote that before 1852 wage labor in mining was rare but "With the introduction of the sluice, the ditch, and the hydraulic process, it became customary to hire laborers." The earlier techniques, the pan and rocker, "were the main reliance for three or four years" and they "required every man to be his own master" (see figure 1).14
SEQUENCING AND TIMING OF PRODUCTION SHIFTS
The shift in technology that occurred around 1852 is a convenient point for marking the end of the early phase of the gold rush, the phase most closely identified with the pure theory of mineral booms. In order to show that the changes in the economy prior to 1852 closely match the predictions of theory, and to set the stage for a more detailed look at the rise of grain agriculture, it is useful to briefly review the effects of mineral booms.
The economy–wide effects of a positive supply shock caused by the discovery of mineral resources are divisible into resource effects and spending effects. Resource effects begin when a mineral boom causes an increase in the marginal products of factors in the booming sector. This draws labor and other inputs from elsewhere in the economy and leads to what economists have termed "direct de–industrialization".15 As labor leaves services (production of nontradables) and the lagging sector (production of tradables), it causes excess demand in both sectors. By definition, services are nontradable so that excess demand leads to a rise in their prices and a further migration of labor out of the lagging sector, this time into the service sector. Corden and Neary call this effect "indirect de–industrialization". Unlike services, the lagging sector produces tradables, so excess demand leads to increased imports. This follows from the rise in factor costs which make local production uncompetitive, and from the availability of goods at world prices (plus transport) which set a limit on the increase in local prices. The second set of effects, termed the spending effects, is generated by the higher incomes that result from the mineral boom. Rising incomes lead to an increase in demand for services and another upward push on their prices and further declines in lagging sector production. In the lagging sector, the increase in spending brought on by higher incomes leads to a second round of import increases but do nothing to change the underlying factor costs that make tradable goods production uneconomic.
Theory leads to two main hypotheses regarding the California economy between 1848 and 1851. First, in addition to the gold sector, there should have been an expansion in services (nontradables). Second, the production of tradable goods in California should have declined while the demand for those goods should have been satisfied by imports, at least to the extent that the region was part of a larger regional, national, or international economy. While in every economy there is some room for small scale production that avoids direct competition with internationally or regionally traded goods, it would be surprising to discover that tradable goods production took off during the first phase of the gold rush.16
California's pre–gold economy was primarily agricultural, and the idea of "deindustrialization" does not make literal sense since there was no industry. However, the term deindustrialization refers to traded goods in general. Given the agricultural base of the economy, the effects of the mineral boom should be found in that sector. Not all agricultural products are the same, however, and their varying characteristics resulted in different outcomes. Grain, for example, is relatively hardy and can be traded across great distances, while fresh fruits and vegetables are perishable and had to be produced locally. Some dairy products also travel poorly, although these were traded to some extent. Returning to the hypotheses (expansion in services, contraction in tradables), the limited tradability of fresh fruits and vegetables implies that California should have seen an expansion of market gardens that were targeted at supplying the towns and mines, while at the same time, the production of staples such as barley and wheat, which were easily imported, should have declined. Between 1848 and 1851, the theory fits the reality fairly well, particularly with respect to fruits and vegetables.
By way of illustration, consider the experiences of two famous Californians, John Sutter, the owner of the land on which gold was discovered, and John Bidwell, a leading agriculturalist during the wheat era. Sutter was a Swiss immigrant who arrived in California in 1839. Soon after, he persuaded the Mexican government to give him a land grant on the Sacramento River in the interior of the state, and by 1841 he had built a small settlement and taken up farming. Bidwell arrived in 1841 as a young man on the first wagon train to the region. He soon found employment at Sutter's Fort and was on hand when gold was discovered in 1848. The fortunes of both men were drastically altered by the gold rush. Sutter lost his entire grain crop in 1848 after news of gold leaked out and fortune seekers overran his fields, slaughtered his animals, and made it difficult to find labor for planting the next year's crop. With farming suddenly impossible, he briefly turned to mining, then to merchandising and real estate. He also struck a lucrative deal in which he leased his schooner, Sacramento, to a group setting up transportation services on the Sacramento River. In other words, Sutter shifted out of the lagging grain sector and briefly into the booming sector, then into the expanding service sector. Sutter's ability to prudently manage a business was never his strong suit, however. He briefly found gold, "but this was quickly lost; more was found and lost".17 While people around him made fortunes, his merchandising efforts failed, and his real estate sales barely brought enough to maintain his lifestyle.
Bidwell possessed a far keener sense of prudence than Sutter. In 1848, shortly after the gold discovery on the American River, he headed north and struck it rich on the Feather River. He used the money to buy a Mexican land grant that lay about 100 miles north of Sutter's holdings, yet still within the fertile Sacramento Valley. Records indicate that he spent the summer of 1849 and part of the fall working as a traveling merchant, moving around the gold fields selling tools, brandy, beef, and other items to the miners.18 By late October, 1849, and through the rest of the year, he was stocking his farm, buying wagons and other items such as livestock, feed grain, and trade goods to exchange for Indian labor. In terms of economic theory, Bidwell's trajectory was into the booming sector, then into services (merchandising), and then into market gardening (services still, in terms of the model). Although Bidwell became a major wheat producer in the state, there is no indication that he took up grain farming before 1854. In that year he purchased a pair of mill stones from Slade and Co. in San Francisco, and a Seymour and Morgan reaper from Henry McNally, also in San Francisco.19 His garden book for 1853 lists only vegetable crops (i. e., no grain) and includes the dates and kinds planted, his daily routine during the spring, and a list of sales through part of the summer.20
The dominance of fruit and vegetable farming from about 1849 through 1852 is consistent with theory and common sense. Grains required machinery –or at least labor–, but there were few flour mills and none had significant capacity. Vegetables were quick, they paid handsomely, and they could be raised with a minimum of labor since harvest was spread through the summer. Bancroft stated that market gardens were very profitable in the early years of the gold rush, although Wickson argued that the ease of production and profitability attracted new entrants that led to a glut in 1850.21 Kelly reported on a journey up the Sacramento Valley in 1849 in which he encountered fresh dairy products but as for wheat or other grains, "such a project was deemed to be so entirely preposterous that it was never attempted".22
By 1851–1852, the grain farming situation had changed.23 The most telling piece of evidence marking this period as the turning point is the fact that in 1852 the local business press began to carry price quotes for domestic wheat in its current prices section. In addition, in the same year, the business press stepped up its call for greater investment in milling facilities while it also began to issue warnings to Chileans and Oregonians that they could no longer depend on sales to the California market.24
According to the special state census of 1852, wheat production in the interior grew from 7 700 bushels in 1850 to 41 622 bushels in 1852. During the same period, barley grew from 3 500 bushels to 930 194. Wheat production in the San Francisco Bay area was around 205 385 bushels in 1852, while barley was estimated to be 1 020 133 bushels.25 In January of 1855, the governor announced that the state's 1854 output of wheat was more than sufficient to supply the local market and that the state's first exports had gone out during the previous year.26
WAGES AND PRICES DURING THE MINING BOOM
According to theory, gold mining should have pulled labor from the rest of the economy and driven up wages. Returns to labor in the placer mines set the standard for the rest of the economy. In May of 1848, the San Francisco newspaper The Californian put the average daily take in the gold placers at $20, although most other reports in 1848 put it at around $16, or an ounce of dust per person per day. Either figure was a fantastic sum at the time, and was a measure by which all could judge alternative employment. In the accounts of wages in late 1848 and 1849, $16 per day was routinely recorded as the price of carpenters and other skilled artisans and mechanics. Table 1 shows the trend for wages, 1847 to 1860 (see table 1).27
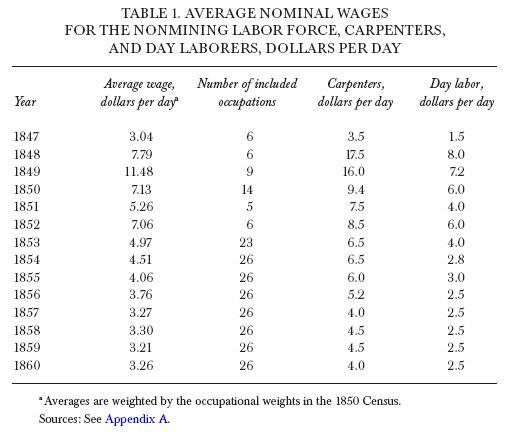
Wages were highly variable by location, particularly between northern and southern parts of the state.28 If table 1 is interpreted as an average for the parts of the state directly affected by gold mining, it is useful to compare it to East Coast wages in order to appreciate the extraordinary difference between the gold regions and other parts of the US. According to Coelho and Shepherd's estimated wage series, in 1851, the average nonagricultural day laborer in the United States earned 93.6 cents per day and carpenters earned 1.368 per day (the ratio is 1.46). Day labor wages in the San Francisco–Bay Area in 1850 averaged $6 (without board) and carpenters earned $9.42 (the ratio is 1.57).29
The gold boom should also have pushed up prices in the general economy, particularly for nontradables. In fact, all prices rose significantly, although evidence for the price level before the mining boom is sketchy at best. Berry's indices of monthly wholesale prices in San Francisco (1847–1854) have an estimate for only one month in 1847, four months in 1848, and the last five months in 1849. From March, 1847, to the peak of wholesale prices during the boom (November, 1849), the monthly index of all commodities rises from 254 to 400 (1881–1885=100), or 57%.30 Even with a large margin of error, however, a nearly 300% increase in wages (278% from 1847 to 1849) combined with a 57% increase in wholesale prices, implies a large increase in the real cost of labor (221%). Real labor costs appear to have peaked in 1849, although it is impossible to rule out peaks in 1848 or 1850.31 Nevertheless, table 1 is consistent with contemporary observers who in 1849 uniformly cited wage levels above those in the 1850 manuscript census. In addition, there were numerous workers' strikes in 1850, a phenomenon consistent with declining wages.32
OVERCOMING THE HIGH COST OF LABOR
To the extent that grain farmers could substitute capital for labor, they could at least partially offset their high labor costs through mechanization. It is not surprising then, that the history of the development of commercial farming in California is a story of intensive and rapid mechanization.33 Mechanization, however, began to arrive on the scene in the mid to late 1850s and was too late to explain the take–off of grain farming in 1851–1852.34
Another possibility that should be ruled out is that land markets permitted farmers to acquire land at below market value, and partially or entirely offset the higher costs they faced for all other inputs.35 The Treaty of Guadalupe Hidalgo guaranteed that the US would recognize pre–existing Spanish and Mexican grants, and in 1851, a federal statute provided a process to confirm them.36 The 1851 law required claimants to file a petition with a federal commission which was responsible for investigating claims and ruling on their legitimacy. The commission finished its work in 1856 but many claims remained under appeal in the courts thereafter. In 1852, land surveys began, and between the period of the establishment of the federal commission and its conclusion in 1856, Congress opened all un–surveyed lands to preemption, as long as they were outside the Mexican claims, and also granted California lieu lands in compensation for school lands located inside the claims. Uncertainty over the eventual status of the land grants –most of which were in the center of towns and on the most fertile agricultural land in the coastal valleys– created both risk and opportunity. Improvements were risky if title was in doubt, and landless immigrants undoubtedly saw opportunities to acquire the use of land, if not eventual outright title. Inevitably, conflicts broke out between preemptors and grantees, and between preemptors and purchasers. Buying part of an unsettled land claim was equivalent to buying a lawsuit, with potentially high costs for litigation and ejection of squatters.37 Nevertheless, purchases from the original grantee seem to have been not infrequent.38
The 1850 manuscript census provides clues about farm acreage, farm tools, livestock, and farm values. The census lists 590 farms with reported acreage.39 The mean average farm size (improved and unimproved acres) is 5 417 acres, a value that is skewed right by the large holdings in regions of Spanish and Mexican settlement. In the more northern regions and in the interior, where settlement spread rapidly between 1848 and 1850, means are smaller and medians conform to US units rather than the square league of Mexico and Spain.40 Given the acreage and measurement differences between older and newer areas of settlement, it can be inferred that immigrants in the post–Mexican period organized their land acquisition (total acres and units of measurement) in ways that duplicated the experience of settlers on the Western frontier.
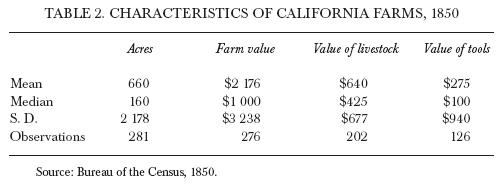
Many of the individual samples reported in the census were cattle ranches with little or no orientation towards supplying vegetables or grains. Table 2 combines data from all California counties included in the manuscript census, but omits all farms with no acreage totals or with ten or more head of cattle. This does not eliminate all ranches engaged primarily in livestock raising (e.g. horse raising enterprises), but it does give a clearer picture of developing farm characteristics. The striking feature of table 2 is its congruence with the Midwestern farms in the Atack and Bateman sample drawn from the 1850 and 1860 manuscript censuses. Owner–occupied, 160 acre Midwestern farms had mean farm values of $2 490, while implements and livestock were worth $96 and $426, respectively.41 Compared to the median of California farms in 1850, investments in livestock and tools are nearly identical. Overall, California farm values were significantly less than the whole Midwestern farm sample ($1 000 versus $2 490), but very close to the values for Kansas and Minnesota ($1 291).42 While some, perhaps many, squatters obtained land at no cost, many farmers purchased their land at considerable cost, and many grantees worked to develop their farms in order to insure the revenue stream they needed to pay the costs of patenting their claims and fending off squatters (see table 2).43
The inference to be drawn is that California farmers in the 1850s did not face a very different set of capital costs than farmers on other American frontiers, particularly where land clearing costs were minimal.44 If land, tools, and livestock values were not significantly different from farms on other frontiers, then it remains to be shown how California wheat farmers overcame high labor costs and their relative isolation from foreign markets.
Part of the answer to this question lies in the nature of the rural labor market in California and, in particular, the adoption by Anglo–California of Mexican labor relations with native Americans.45 There is an ample historical record showing the widespread use of native Americans throughout the rural economy of California in the 1850s. For example, John Bidwell learned to use native Americans during his years on Sutter's farm and, in 1849, as he provisioned his newly acquired lands, his records include invoices for items such as 100 pair of moccasins, 221 small deerskins, 32 cotton and wool shirts, 12 red sashes, 9 pair of deerskin pants, 22 pounds of white beads and 20 pounds of blue ones, and other goods useful in trade for labor.46 Given that it was standard to pay native Americans in kind rather than money wages, it is clear that his intention was to acquire their services as farm laborers. The special state census of 1852 shows that native Americans were a significant part of the population of agricultural counties around the Bay Area (8 to 62.8%) and a smaller but significant part of the populations of the Central Valley where wheat farming grew most rapidly after 1852.47 In addition, the ratios of males to females were heavily biased toward males, indicating that native Americans were valued for the ability to work and that their presence in counties of white settlement were not family units.48
CALIFORNIA'S (NON) INTEGRATION WITH THE NATIONAL ECONOMY
While the use of Native American labor was critically important, grain farming was given another boost by the lack of market integration between the West Coast and the East Coast through most of the 1850s. Relative isolation meant that immigration did matter –the size of the local market was an incentive to the state's farmers because imports were a highly variable source of supply, albeit not so variable as to permit significant production before 1851–1852.49 Consider the simple logistics in the pre–telegraph era. The average length of the voyage from New York to San Francisco (around Cape Horn) declined between 1849 and 1856, from around 185 days to 130 days. This means that, even at the later date, after technological improvements in sailing and mapping of ocean currents, it was an average voyage of over 4 months.50 If all went well, information (newspapers and letters) could make the journey in six or seven weeks across the Isthmus of Panama, but another month or two was required to arrange a shipment of goods, followed by a return voyage of three to four months. In other words, high flour prices in San Francisco during January would not trigger the arrival of a shipment from the East Coast until July at the earliest, and more likely September or October.
The difficulty of correctly guessing future market prices in San Francisco was complicated by two additional factors. First, goods arrived from many different destinations so that even though New York or Boston merchants knew what they had sent, they could not be certain about Chilean, European, or Australian merchants. Second, most vessels leaving San Francisco did not return directly to the East Coast and this delayed the flow of commercial information. More common return routes were via Central and South America to pick up goods for sale in Asia, or directly across the Pacific to pick up Asian goods. Bancroft lists the top destinations outside US Pacific ports as Peru, China, Panama and New Granada, Chile, Nicaragua, Mexico, and Manila, in addition to Australia and the US East Coast.51 Berry estimates that only 2% of the ships leaving San Francisco between 1847 and 1854 returned directly to the North Atlantic by way of Cape Horn.52
Difficulties in arranging reliable supplies of imports also arose from sources as diverse as the wet winter of 1849–1850, high labor costs, and insufficient warehouse space. Labor costs and the absence of warehousing in the first years of the gold rush caused many goods to be left out, if they were unloaded at all, where they were subject to destruction by the elements.53 Under normal conditions, sidewalks would have been constructed out of wood planks, but lumber was extremely scarce and had greater value in building construction. During the rainy winter of 1849–1850, the 49er William Shaw wrote: "Incredible as it may seem, I have found a foothold across streets and pathways on Mexican beef, bags of flour, and bales of other damaged goods."54 In addition to the mundane items Shaw mentions, first–hand accounts of sidewalk construction materials also included more valuable items such as cook–stoves, iron, sheet lead, beans, and in a rare instance, a damaged piano.55 There is no clearer evidence of market disequilibrium and an absence of economic integration with the East Coast (or anywhere else) than the use of beef, tobacco, flour, cook–stoves, and a piano as sidewalk construction materials.
Quantitatively, market integration can be examined by comparing the correlation in price movements between two or more markets.56 The simplest approach is to compare the correlation coefficients of prices between San Francisco and an East Coast market with those between two markets that are presumed to be relatively integrated. Table 3 shows the correlations of monthly wheat prices in three markets: San Francisco, New York, and Philadelphia. The correlations between New York and Philadelphia are a standard for judging the integration of San Francisco with the East Coast. Over the period as a whole, there is no link between San Francisco and the two East Coast markets, while New York and Philadelphia are tightly linked. Looking at two subperiods, however, there appears to be a significant change around the end of the decade, partially offset by the low correlation coefficient for San Francisco–New York in 1860. In figure 2, showing the average monthly wheat price correlations for each year, the trend towards market integration is clear. Beginning in 1858 or 1859, San Francisco's prices began to mirror prices elsewhere in the national market (see table 3 and figure 2).57
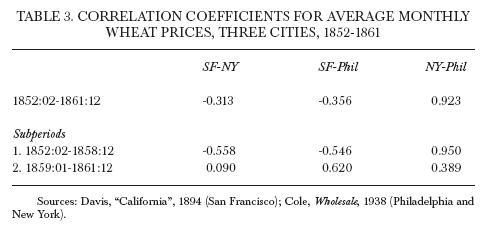
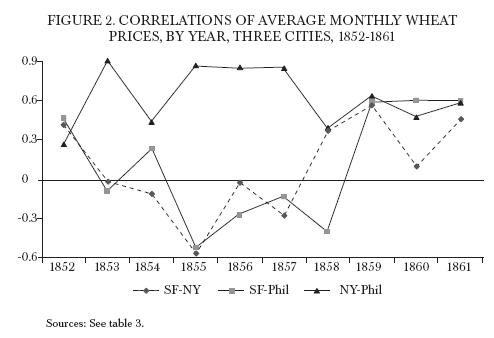
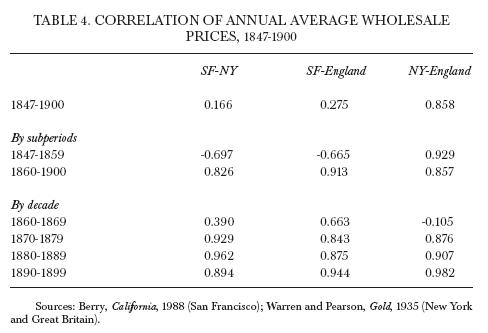
Table 4 looks at a longer period and a wider variety of products in three cities, San Francisco, New York, and London.58 Once again, the pattern of relatively higher integration in North Atlantic markets during the 1850s is followed by relatively similar integration between all three pairs of markets from 1860 to 1900.59 In sum, during the 1850s, New York and Great Britain were far more integrated than San Francisco and New York. In fact, there is scant evidence that New York price movements had any effect on California, or vice versa. This changed sometime in the late 1850s, and San Francisco and New York became approximately as integrated as New York and London (see table 4).
The lack of market integration between San Francisco (California) and the East Coast created a decade of opportunity for California's farmers. They were able to produce for the local market and Pacific regions which were also relatively isolated from world grain markets without encountering persistent direct competition from other major grain producing regions. A decade was enough, probably more than enough, for farmers and grain shippers to learn about soils, climates, shipping techniques, and foreign markets.60
Beginning in 1860, with the first significant grain shipments to Great Britain, California wheat was competitive in world markets and well integrated into the international grain trade. Even earlier, in 1858 or 1859, market information between the state and the rest of the world began to flow more freely and price movements in San Francisco started to reflect pressures in world markets. The causes of increased economic integration between the West and East Coasts must remain speculative, but several changes occurred about the same time. First, steam powered ships began to operate in the Pacific between Panama and San Francisco in early 1849. This greatly reduced the time from the isthmus to California by eliminating the long voyage east from Panama to the longitude of Hawaii that was required of sailing ships in order to avoid the winds and currents along the west coast of North America. In 1855, an overland rail route was completed across the isthmus and reduced the time and increased the comfort and safety of crossing. Thereafter, the primary route to San Francisco was across the Isthmus of Panama. Second, the Pacific Mail Butterfield Overland Mail Route between St. Louis and San Francisco began operation on September 15, 1858. It took a southern route across the US, passed through Los Angeles, and guaranteed arrival in San Francisco in less than 25 days. This cut the time for information to pass from the Midwest (and by telegraph extension, the East Coast) from more than three months to less than one–month. Second, the Pony Express began operations in April, 1860, and cut the time from 25 days to eleven days, although it carried a much smaller volume of mail. Third, and finally, in October of 1861, the telegraph was connected.61
THE BEGINNING OF WHEAT EXPORTS
The list of exceptional factors that came together and enabled grain farming to take off in the 1850s does not end with the state's isolation or its use of native American labor; at least two additional and entirely fortuitous factors must be noted. The first is the discovery of gold in Australia in 1851 and the second is the Crimean War.62 The Australian gold find eventually proved to be equivalent to California's. In addition, it too drew labor from other pursuits and led to declines in the production of most tradable goods other than gold.63 In particular, Australian wheat production decreased from 1852 through 1855, precisely when California began to look for export markets.64 In addition, Australian prices were higher than world prices. For example, the average of monthly wholesale wheat prices in Melbourne, the largest city on the continent in 1861, and the closest city to the richest gold fields, averaged 5.9 cents per pound in 1854, 6.5 cents in 1855, and 3.8 cents in 1856.65 By comparison, San Francisco wholesale prices in the same years were 2.7 cents, 2.2 cents, and 2.9 cents. Between 1854, when California started exporting, and 1860 when it sent its first significant shipments of grain to Great Britain, the Pacific markets of Australia and New Zealand absorbed nearly 2/3 of California's wheat exports, and almost ½ of its flour.66
High Australian grain prices would ordinarily have created a supply response from Great Britain, the world's largest grain market and the main trading partner for the British colony. The normal response was curtailed, however, by the onset of the Crimean War (October, 1853 to February, 1856) which closed the Black Sea and cut off one of the primary grain supply routes to Britain.67 In addition, the war disrupted the development of commercial linkages between Australia and Great Britain by postponing the start of regular steamship service to the colony from 1852 to 1856.68
After the discovery of relatively sheltered markets throughout the Pacific basin, the last significant obstacle to exports lay in the technology and availability of shipping. Prior to the gold rush, there were several trade routes linking California to other parts of the world, including a Boston–California–China–Boston route that had developed earlier in the century, and a north–south route that linked North America with Mexico, Central America, and South America.69 After 1850, ships began to leave the port of San Francisco in great numbers and the routes were fairly predictable given these pre–gold trade patterns. A large percentage (63.5%) of the more than 6 400 ships clearing San Francisco between 1848 and 1854 listed cities along the west coast of the Western Hemisphere as their next port of call (for example, San Blas, Callao, Panama, Valparaiso), while a second important group (33.8%) listed Australia, Pacific Islands, or Asia. Fewer than 125 ships (1.9%) gave ports on the East Coast as their next destination. In sum, destinations north and south along the west coast of the Western Hemisphere, together with destinations across the Pacific accounted for more than 97% of all clearances from San Francisco. It is not surprising, then, that the first important markets for California's non–mineral exports were in the Pacific basin rather than the north Atlantic. Furthermore, the development of grain exports out of California (and lumber around the same time) benefited from the availability of ships looking for cargo, especially those headed back to the East Coast by way of Asia.70 Grain and lumber not only made good ballast, but they also made the leg across the Pacific profitable.
While important, this advantage can be overstated. Beginning in 1852, departing tonnage at the port of San Francisco exceeded the arriving tonnage, and this pattern held until 1857.71 Although data are scarce for freight rates for departing goods early in the decade, during the second half of the 1850s when exports became more regular, freights out of San Francisco were not very different from rates for goods entering the city from the same destinations. In other words, there does not appear to have been a noticeable excess supply of cargo space for exports leaving the city, at least after 1854 or so.72
RETELLING THE HISTORY OF CALIFORNIA'S WHEAT ECONOMY
In retrospect, it seems unexceptional that California began exporting wheat in the 1850s while the Gold Rush was still a factor in the region's economy. The discovery of gold in 1848 led to a rapid increase in the size of the local market and while the climate and soils were new to farmers from other parts of the U.S. (although not to Chileans or Sonorans that migrated from areas geographically similar to the dry summers of California), they were well suited to grain production.73 Grain farming quickly developed into the most important agricultural activity and the largest non–mineral export for 19th century California, and while wheat's dominant role in the state's economy during the last three decades of the 19th century is largely forgotten, it was an important episode in not only West Coast history, but in the history of Britain's grain trade and Europe's food supplies.74
Most historians have relied on immigration to explain an expanding agricultural sector and rising grain exports. While the immigration story is not wrong, it is incomplete. In particular, it hides the role of native American labor and the relative importance of California's non–integration with the national economy. Furthermore, it ignores the timing of the take–off of grain farming in 1852, at the end of the gold boom and when technological changes shifted gold production to a more capital intensive basis, reducing the opportunities for independent miners. While the worst of the Dutch disease effects were over by 1852, a number of obstacles remained for export agriculture. In particular, wages were lower than in 1849 or 1850, but still far above their level elsewhere in the nation. From approximately 1852 to 1860, native American labor and California's relative isolation played important roles as farmers learned about the state's climate and soils and began to explore marketing opportunities for the developing surplus. In this regard, while Paul and Rothstein have spoken about the "tyranny of distance" that lay heavy on California wheat producers, in the early years, distance was a protective cloak that gave shelter to the state's grain farmers.75
SOURCES CONSULTED
Archives
BC Bidwell Collection, California State Library, Sacramento California.
BL Bancroft Library, Berkeley, California.
Hemerography
Alta California, San Francisco.
The Argus, Melbourne.
Californian, San Francisco.
California Star, San Francisco.
Mercantile Gazette Prices Current and Shipping List, San Francisco.
New York Journal of Commerce, New York.
Sacramento Daily Union, Sacramento.
San Francisco Mercantile Gazette and Prices Current, Shipping List and Register, San Francisco.
San Francisco Prices Current and Shipping List, San Francisco.
Bibliography
ATACK, JEREMY and FRED BATEMAN, To Their Own Soil: Agriculture in the Antebellum North, Ames, Iowa, Iowa State University Press, 1987. [ Links ]
BANCROFT, HERBERT H., History of California, vol. VI, San Francisco, The History Company, 1888. [ Links ]
–––––––––– , History of California, vol. VII, San Francisco, The History Company, 1890. [ Links ]
BERRY, THOMAS, "Gold! But How Much?", California Historical Quarterly, vol. 55, num. 5, 1976, pp. 246–255. [ Links ]
BERRY, THOMAS, California Prices and California Gold, Richmond, Virginia, Bostwick Press, 1988. [ Links ]
BIGLER, JOHN, "Governor's Annual Message (1854)", Senate Journal, 6th session, pp. 23–72, 1855. [ Links ]
BUCK, FRANK A., A Yankee Trader in the Gold Rush, R. A. White (ed.), Boston, Houghton Mifflin Co., 1930. [ Links ]
BUREAU OF THE CENSUS, United States Manuscript Census of 1850, 1850. [ Links ]
BROWNE, JOHN R., A Report on the Mineral Resources of the States and Territories West of the Rocky Mountains, House Executive Document 29, 39th Congress, 2nd Session, 1867, p. 1289. [ Links ]
CARRICO, RICHARD, Strangers in a Stolen Land, num. 2, Publications in American Indian Studies, San Diego, California, San Diego State University, 1986. [ Links ]
CLAY, KAREN, "The cost of uncertainty: squatters, contracts, and conflict in frontier California", unpublished paper, 1997. [ Links ]
COELHO, PHILIPH and JAMES SHEPHERD, "Regional Differences in Real Wages: The United States, 1851–1880", Explorations in Economic History, vol. 13, 1976, pp. 203–230. [ Links ]
COLE, ARTHUR HARRISON, Wholesale Commodity Prices in the United States, 1700–1861, Cambridge, Massachusetts, Harvard University Press, 1938. [ Links ]
COOK, SHERBURNE, The Conflict between the California Indian and White Civilization, Berkeley, University of California Press, 1976. [ Links ]
CORDEN, W. M., "Booming Sector and Dutch Disease Economics: Survey and Consolidation", Oxford Economic Papers, vol. 36, 1984, pp. 359–380. [ Links ]
CORDEN, W. M. and J. PETER NEARY, "Booming Sector and De–Industrialization in a Small Open Economy", The Economic Journal, vol. 92, 1982, pp. 825–848. [ Links ]
COUGHLAN, T. A., Labour and Industry in Australia: From the First Settlement in 1788 to the Establishment of the Commonwealth in 1901, Melbourne, Macmillan of Australia, 1918 [1969]. [ Links ]
COX, THOMAS R., "The Passage to India Revisited: Asian Trade and the Development of the Far West, 1850–1900" in JOHN ALEXANDER CARROLL (ed.), Reflections of Western Historian, Tucson, University of Arizona Press, 1969. [ Links ]
CROSS, IRA B., A History of the Labor Movement in California, Berkeley, University of California Press [New York, Johnson Reprint Corp.], 1935 [1966]. [ Links ]
DAVIS, HORACE, "California Breadstuffs", Journal of Political Economy, vol. 2, 1894, pp. 517–612. [ Links ]
DEBOW, J. D. B., "California", The Seventh Census of the United States: 1850, Washington, DC, Robert Armstrong Printers, 1853. [ Links ]
–––––––––– , "Population and Industry of California by the State Census for the Year 1852", The Seventh Census of the United States: 1850, Washington, DC, Robert Armstrong Printers, 1853. [ Links ]
DELGADO, JAMES P., To California by Sea, A Maritime History of the California Gold Rush, Columbia, South Carolina, University of South Carolina Press, 1990. [ Links ]
DILLON, PATRICE, "La California dans les derniers mois de 1849" in A. P. NASATIR (ed.), French Activities in California, Appendix F, 1849, p. 556. [ Links ]
GATES, PAUL, California Ranchos and Farms, Madison, The State Historical Society of Wisconsin, 1867. [ Links ]
–––––––––– , "The California Land Act of 1851", California Historical Quarterly, vol. 50, 1971, pp. 395–430. [ Links ]
–––––––––– , "Public Land Disposal in California", Agricultural History, vol. 49, 1975, pp. 158–178. [ Links ]
GERBER, JAMES, "The Origin of California's Export Surplus in Cereals", Agricultural History, vol. 67, num. 4, 1993, pp. 40–57. [ Links ]
–––––––––– , "Gold Rushes and the Trans–Pacific Wheat Trade: California and Australia, 1848 to 1857" in D. FLYNN, L. FROST and A. J. H. LATHAM (eds.), Pacific Centuries: Pacific and Pacific Rim History since the Sixteenth Century, London, Routledge Press, 1999. [ Links ]
GRAHAM, W. S., "The Ascendancy of Sailing Ships, 1850–1885", European Historical Review, second series, vol. 9, num. 1, 1956, pp. 74–85. [ Links ]
HASTINGS, LANSFORD, The Emigrant Guide to Oregon and California, Cincinnati, G. Conclin, 1846. [ Links ]
HELLTOWN HISTORICAL SOCIETY, Rancho Chico: The Gateway to Chico's Past, Chico, Helltown Historical Society, 1989. [ Links ]
HIGGINS, F. H., "John M. Horner and the Development of the Combined Harvester", Agricultural History, vol. 32, num. 1, 1958, pp. 14–24. [ Links ]
HITTEL, J. S., The Resources of California, San Francisco, A. Roman and Co, 1863. [ Links ]
HURTADO, A., Indian Survival on the California Frontier, New Haven, Yale University Press, 1988. [ Links ]
–––––––––– , "'Hardly a Farm House –A Kitchen without Them': Indian and White Households on the California Borderland Frontier in 1860", Western Historical Quarterly, vol. 13, 1982, pp. 245–270. [ Links ]
HUTCHINSON, JOSEPH, "California Cereals", Overland Monthly, vol. 2, num. 7, second series, 1883, pp. 8–16. [ Links ]
KELLY, WILLIAM, An Excursion to California over the Prairie, Rocky Mountains, and Great Sierra Nevada, London, Chapman and Hall, 1851. [ Links ]
LANGLEY, HENRY G. and SAMUEL MORISON, State Register and Yearbook of Facts: For the Year 1859, San Francisco, 1859. [ Links ]
LARKIN, THOMAS O., The Larkin Papers, vol. 7, George P. Hammond (ed.), Berkeley, University of California Press, 1951–1958. [ Links ]
LEBERGOTT, S., Manpower in Economic Growth, New York, McGraw–Hill, 1964. [ Links ]
MASON, R., "Letter to R. Jones", House Exec. Doc. num. 17, 31st Congress, 1st Session, pp. 528–536, 1848. [ Links ]
MADDOCK, RODNEY and IAN MCLEAN, "Supply–Side Shocks: The Case of Australian Gold", Journal of Economic History, vol. 44, num. 4, 1984, pp. 1047–1067. [ Links ]
MCCLOSKEY, DONALD, The Rhetoric of Economics, New York, Cambridge University Press, 1985. [ Links ]
M'COLLUM, WILLIAM S., California as I Saw It, Buffalo, George H. Daly Co., 1850. [ Links ]
MOERENHOUT, JACQUES ANTOINE, The Inside Story of the Gold Rush, translated by A. P. Nasatir, San Francisco, California Historical Society, 1935. [ Links ]
MOODY, JOSEPH, "A Letter from California", California Historical Society Quarterly, vol. 13, num. 1, 1934, pp. 84–85 (Letter dated Sacramento City, August 7, 1849). [ Links ]
NASATIR, A. P., A French Journalist in the California Gold Rush: The Letters of Etienne Derbec, Georgetown, California, The Talisman Press, 1964. [ Links ]
OLMSTEAD, ALAN and PAUL RHODE, "An Overview of California Agricultural Mechanization, 1870–1930", Agricultural History, vol. 62, num. 3, 1988, pp. 86–112. [ Links ]
PAUL, RODMAN, "The Wheat Trade between California and the United Kingdom", Mississippi Valley Historical Review, vol. 45, num. 3, 1958, pp. 391–412. [ Links ]
–––––––––– , "The Beginnings of Agriculture in California: Innovation vs. Continuity", California Historical Quarterly, vol. 52, num. 1, 1973, pp. 16–27. [ Links ]
PRETOT, P., "Letter to the Minister of Foreign Affairs" in A. P. NASATIR (trans. and ed.), French Activities in California, 1849, pp. 265–299. [ Links ]
RAWLS, J., "Gold Diggers: Indian Miners in the California Gold Rush", California Historical Quarterly, vol. 55, 1976, pp. 28–45. [ Links ]
–––––––––– , Indians of California: The Changing Image, Norman, Oklahoma, University of Oklahoma Press, 1984. [ Links ]
RHODE, PAUL, "Learning, Capital Accumulation, and the Transformation of California Agriculture", Journal of Economic History, vol. 55, num. 4, 1995, pp. 773–800. [ Links ]
ROTHSTEIN, MORTON, "West Coast Farmers and the Tyranny of Distance: Agriculture on the Fringes of the World Market", Agricultural History, vol. 49, num. 1, 1975, pp. 272–280. [ Links ]
–––––––––– , "Centralizing Firms and Spreading Markets: The World of International Grain Traders, 1846–1914", Business and Economic History, second series, vol. 17 , 1988. [ Links ]
RYBCZYNSKI, T. M., "Factor Endowments and Relative Commodity Prices", Economica, vol. 22, num. 84, 1955, pp. 336–341. [ Links ]
SHAW, WILLIAM, Golden Dreams and Waking Realities, London, 1851. [ Links ]
SOULE, FRANK, JOHN GIHAN and JAMES NISBET, The Annals of San Francisco, New York, D. Appleton and Co, 1855. [ Links ]
STIGLER, GEORGE J. and ROBERT A. SHERWIN, "The Extent of the Market", Journal of Law and Economics, vol. 28, num. 3, 1985, pp. 555–585. [ Links ]
TAYLOR, BAYARD, El Dorado, or Adventures in the Path of Empire, New York, G. P. Putnam, 1850. [ Links ]
THOMAS, D., "On Agricultural Statistics of the State", Transactions of the State Agricultural Society, 1859, in Appendix to the Assembly Journal (1859), 11th Session, 1859, pp. 323–348. [ Links ]
UNITED STATES CENSUS, 12th Census of the United States, Agriculture, Part II, Washington DC, US Census Office, 1902. [ Links ]
UNITED STATES DEPARTMENT OF COMMERCE, Historical Statistics of the United States, Washington, DC, GPO, 1975. [ Links ]
VAMPLEW, WRAY (ed.), Australians Historical Statistics, New South Wales, Australia, Fairfax, Syme, and Weldon Associates, 1987. [ Links ]
WARREN, GEORGE, F. and FRANK A. PEARSON, Gold and Prices, New York, John Wiley and Sons, Inc., 1935. [ Links ]
WEEKS, Joseph, Report on the Statistics of Wages in Manufacturing Industries with Supplementary Reports, US Congress, House of Representatives, doc. 42, vol. 13, part 20, 47th Congress, 2nd Session, Washington DC, GPO, 1886. [ Links ]
WERTH, JOHN J., A Dissertation on the Resources and Policy of California: Mineral, Agricultural, and Commercial, including a Plan for the Disposal of the Mineral Lands, Benicia, California, St. Clair and Pinkham, 1851. [ Links ]
WICKSON, E. J., Rural California, New York, The Macmillan Company, 1923. [ Links ]
WRIGHT, DORIS MARION, "The Making of Cosmopolitan California: An Analysis of Immigration 1848–1870", California Historical Society Quarterly, vol. 19, num. 4, 1940, pp. 12–40. [ Links ]
1 Berry, "Gold!", 1976; DeBow, "Population", 1853; Thomas, "Agricultural", 1859.
2 Alta California, January 20, 1851.
3 The general equilibrium effects of a sudden expansion of one sector brought on by the discovery of gold or other minerals is often referred to as "Dutch disease". The term comes from the deindustrializing effects on the Dutch economy of the discovery and development of North Sea natural gas. See Corden and Neary, "De–Industrialization", 1982; Corden, "Dutch", 1984; for application to the Australian gold rush, Maddock and McLean, "Supply–Side", 1984.
4 Paul, "Wheat", 1958; Rothstein, "Centralizing", 1988.
5 Davis, "Breadstuffs", 1894, p. 528.
6 United States Census, Agriculture, 1902.
7 Rybczynski, "Endowments", 1955.
8 Coelho and Shepherd, "Differences", 1976, table A. 2.
9 CaliforniaStar, August 28, 1847; Wright, "Cosmopolitan", 1940.
10 Wright, "Cosmopolitan", 1940.
11 New York, Boston, Philadelphia, and New Orleans were larger, in that order. AltaCalifornia, September 25, 1852.
12 DeBow, "Population", 1853.
13 Berry, "Gold!", 1976.
14 Browne, Mineral, 1867, pp. 16, 20–21.
15 Corden and Neary, "De–Industrialization", 1982; Corden, "Dutch", 1984.
16 Direct and indirect deindustrialization are the terms used in the literature, but as applied to California, they are slightly misleading. The region's dominant activities prior to the mineral boom were ranching and farming, which makes "deagriculturalization" a more apt term for the effects of the mineral boom.
17 Bancroft, History, vol. VI, 1888, p. 100.
18 Bidwell Collection (BC), AccountBook, 1848–1853.
19 BC, ms. box 136, folders 9 and 15.
20 Ibid. Judging by his purchase of mill stones and a reaper early in 1854 (April and May) it is safe to assume Bidwell planted wheat in 1854. In 1852, he was still buying barley instead of growing it.
21 Bancroft, History, vol. VII, 1890, pp. 28–29; Wickson, Rural, 1923, pp. 96–97.
22 Kelly, Excursion, 1851, p. 182.
23 Hutchinson, "Cereals", 1883, quotes J. P. Raymond of Salinas City, a farmer who had been skeptical about wheat farming in California: "it was never thought that it could be done here except in greatly favored localities. But the complete success of that season (1852) made farming a business in California."
24 SanFranciscoPricesCurrentandShippingList, May 1, June 1, June 15, July 14, October 15, 1852.
25 See DeBow, "Population", 1853. The 1850 census returns for San Francisco, Santa Clara and Contra Costa counties (all in the San Francisco Bay area) were destroyed. According to Werth, Dissertation, 1851, pp. 71–74, Santa Clara County at the southern end of the San Francisco Bay produced 40 000 bushels of wheat in 1850 and 20 000 of barley. During the gold rush, Santa Clara was the region's most important agricultural county.
26 Bigler, "Governor's", 1855.
27 Wages are an occupationally weighted average of wages in the Central Valley and the San Francisco Bay Area. The 1850 census is used to derive the weights. Mining wages were consistent with the pattern in tables 1 and 2. See DeBow, "California", 1853. In 1867, J. Ross Browne reported to Congress that wage labor in the gold mines was uncommon until 1852. Browne, Mineral, 1867, pp. 20–21, wrote: "In 1852, wages were $6 or $7 per day; the next year about $5, since which time they have generally fallen, until now they are from $2 to $3.50 per day; the skillful quartz miner commanding the latter sum."
28 See Bureau of the Census, Manuscript, 1850. Wages from the South–Central coast region were excluded because they were significantly lower. For example, according to the 1850 manuscript census, farm hands in the northern parts of the state averaged $117 per month compared to an average of $33.33 in the Central and South coast counties. Non–farm labor was similarly divergent: day laborers without board average $6 per day in the gold and Bay Area regions, and $4 per day in the Central and South coast regions. The huge difference in wages indicates that the state was not a well integrated economic region and that it is more accurate to view it as two separate regions. It also should raise flags of caution when using figures that combine all parts of the state into a single region. For example, historical statistics reported by U.S. Department of Commerce, Historical, 1975, series 705–714, report farm labor wages for California as an aggregate for the Northern and Southern parts of the state in 1850 and 1860. The Commerce Department uses estimates taken from Lebergott, Manpower, 1964, who provides similarly aggregate numbers.
29 See Coehlo and Shepard, "Differences", 1976, pp. 210, 227. The estimate of the average money wage for 1860 given in table 1 is slightly less than Coelho and Shepherd's estimate for the Pacific region for 1861, the first year for which they have data. They estimated a daily wage of $3.62, based on two observations. The Weeks Report has no data for the Pacific region during the 1850s. These are lower bound estimates of wages in California since they are from the Manuscript Census for 1850 and do not include returns for San Francisco, Santa Clara, and Contra Costa counties. Santa Clara was the most important agricultural county in the state at the time, and had one of the largest populations (after San Francisco) in Northern California. The returns for these three counties were destroyed in a fire. Partly for this reason, and due to a serious undercount in the mining areas, a second census was taken in 1852.
30 Berry, California, 1988, p. 231. It should be noted that indices of commodity subgroups show considerable variation and that intra–month variation was also significant in the years after 1849 when Berry's data series becomes continuous. Presumably, intra–month variation was high before 1849 as well. Anecdotal evidence, some of which is touched on below, supports this notion.
31 An interesting feature of table 1 is the rise during 1852 in nominal wages (Berry's price series shows a similar rise). One explanation is the effect of the 1851 discovery of gold in Australia which equaled in magnitude t he size of the California find. The effects of the Australian find began to push up wages and prices in that region in late 1851. See Maddock and Maclean, "Supply–Side", 1984; Gerber, "Gold", 1999.
32 See Cross, History, 1935, pp. 14–18.
33 See Olmstead and Rhode, "Overview", 1988; Paul, "Beginnings", 1973; Gates, Ranchos, 1967.
34 As early as 1854, a Santa Clara Valley farmer named John Horner used a combined harvester shipped from the Midwest to harvest 600 acres of wheat. While Horner did not use the harvester the following year, promoters of agriculture in the 1850s repeatedly called for more mechanization to overcome the scarcity of labor and others began experimenting with machinery. See Higgins, "Horner", 1958; Gates, Ranchos, 1967, pp. 42–44.
35 Spanish grants were far fewer in number and were mostly reconfirmed by the Mexican government. In effect, therefore, they were nearly all Mexican grants.
36 Gates argues that this set the pattern of land ownership in California and was a strong force in the development of more concentrated land holdings. Gates, "California", 1971, and "Public", 1975.
37 Clay, "Uncertainty", 1997.
38 It is not possible to accurately characterize prices that prevailed in rural land markets in the 1850s. In 1852, the governor authorized the sale of 500 000 acres from the state's federal grant. Unsurveyed land was sold in 160 and 320 acre blocks at $2 per acre, with individual purchases limited to 640 acres. In 1855, state swamplands (much of it dry) were opened for purchase at the price of $1 per acre, payable within five years and limited to 320 acres. Both types of land warrants soon depreciated to below $1 an acre. See Gates, "Public", 1975. Clay ("Uncertainty", 1997) describes several examples of rural land sales in the 1850s. For example, Thomas Larkin, a San Francisco merchant and US consul during the American occupation, offered parcels at $10 an acre to squatters on his extensive holdings in the Santa Clara Valley. Located at the south end of the San Francisco Bay, the valley was the most developed and richest agricultural region in Northern California throughout the 1850s. At the other end of the spectrum is the case of John Bidwell, already mentioned. Bidwell purchased the Dickey land grant, Rancho del Arroyo Chico, in a region of the Sacramento Valley that was devoid of Anglos and Hispanics, for about 50 cents an acre for 22 240 acres. See Helltown Historical Society, Rancho, 1989.
39 See Bureau of the Census, Manuscript, 1850. The manuscript census lists more than 590 farms but a small percentage is illegible, and a much larger percentage has no reported acreage. The census is also incomplete due to the loss of returns from three important counties (San Francisco, Santa Clara, and Contra Costa) all of which are in the San Francisco Bay region. Furthermore, Santa Clara and Contra Costa were two of the most important agricultural counties in Northern California.
40 For example, in Los Angeles, Santa Barbara, and Monterey counties, the means are 7 436 acres, 12 644 acres, and 8 320 acres, respectively. The median acreage in these counties is 4 424, 8 880, and 4 447, which are approximately equivalent to one and two square leagues, the unit of measurement of Spanish and Mexican land grants. In the northern and interior counties the means were smaller and measurement was more often in acres. For example, Calaveras (mean 185, median 160), Napa (mean 856, median 640), Sacramento (mean 656, median 200), Solano (mean 3614, median 640), and Yolo (mean 250, median 160) were either newly settled counties in 1850, or counties that received significant immigration after the gold discovery.
41 Atack and Bateman, Soil, 1987, pp. 134–136.
42 Medians instead of means are used in the California case because the incidence of preexisting Mexican land grants of one or more square leagues skews the data to the right.
43 Gates, Ranchos, 1967, chapter 3.
44 One other important capital cost to farmers was interest rates. Rates in California were extremely high, averaging 9.2% per month in 1850, 4.6 in 1851, 2.9 in 1852, and 3.5 in 1853. See Berry, California, 1988, table A–6, p. 242. Rhode ("Learning", 1995) argues that interest rates influenced crop choice, causing farmers to prefer grains which produced a return in one season, as opposed to fruits which required lengthier investments. Gates, Ranchos, 1967, chapter 3, points out that the uncertainty of land titles had a similar effect on crop choice. The impact of high interest rates would be against farming if it required land to be purchased on credit.
45 By "Mexican labor relations" I mean that native Americans were drawn into the labor force rather than isolated on reservations. A number of institutional practices helped accomplish this: special Indian indenture laws, including a vagrancy provision that that antedated the Black Codes by 15 years, and a thriving practice of kidnapping. See Gerber "Origins", 1993; Cook, Conflict, 1976, pp. 308–309; Carrico, Strangers, 1986; Hurtado, "Hardly", 1982, and Survival, 1988, pp. 129–131; Rawls, "Diggers", 1976 and Indians, 1984, pp. 86–96.
46 BC, ms. box 136, folders 9 and 15.
47 Two counties (Sacramento and Yuba) with less than 1% of their population native American had large concentrations of Chinese, 6.5 and 10.6%, respectively. See DeBow, "California", 1853.
48 Gerber, "Origins", 1993.
49 The Dutch disease model of positive supply shocks assumes that imports are reliably available at world prices.
50 Graham, "Ascendency", 1956; Berry, California, 1988, pp. 119–120.
51 Bancroft, History, vol. VI, 1888, pp. 120–122.
52 Berry, California, 1988, p. 123.
53 Not uncommonly during the first years, ships were pulled up on the beach and turned into warehouses while many sat at anchor in the bay, fully laden with cargo, and without any hope of off loading. "In July, 1850, fully 500 abandoned vessels lay rocking in front of the city, some with cargoes undisturbed, for it did not pay to unload with costly labor upon a glutted market. [...] Towards the close of 1850, the return of disappointed miners permitted the engagement of crews with which to spread the long–folded sails." Bancroft, History, vol. VII, 1890, p. 125.
54 Shaw, Dreams, 1851, p. 47.
55 Bancroft, History, 1888, p. 198; Nasatir, Journalist, 1964, note 53 to letter 2.
56 McCloskey, Rhetoric, 1985, pp. 143–147; Stigler and Sherwin, "Extent", 1985.
57 In order to eliminate possible spurious correlation due to non–stationary variables, I calculated correlation coefficients for the first differences in the logarithms of prices. All the resulting correlation coefficients are lower in absolute value, but the pattern of increased integration remains.
58 From 1862 to 1878, the official dollar price for gold was suspended and the metal rose in value. San Francisco remained on an unofficial gold standard, however, as both foreign and domestic gold coins remained the medium of exchange and greenbacks, called "legal tenders" on the West Coast, were a small fraction of the money supply. San Francisco newspapers regularly reported the discount on the paper notes. As a result of the differences in the money supply of the two coasts, the New York price index is adjusted for the changes in the gold value of currency, as reported in Warren and Pearson, Gold, 1935, p. 153. In effect, this puts New York prices on the same footing as San Francisco and presents both cities' prices in gold terms. British prices, which are given for comparison purposes, require no similar adjustment since the gold value of the pound sterling did not deviate from official prices.
59 Correlations for first differences of logarithms were also checked.
60 One of the more important lessons was the need to ship grain in bags rather than in bulk. The 14 000 mile journey to Great Britain was too far and too long for grain to arrive in good condition when it was shipped in bulk. See Paul, "Wheat", 1958.
61 The beginning of a stage route in late 1858 explains a significant and important share of the reduction of wheat price differences between San Francisco and New York.
62 Australian gold was actually discovered as early as 1839, and again in 1841, but the authorities managed to contain the news, presumably because they feared the consequences of a gold rush in a society built upon convict labor. By 1851, conditions had changed. See Coughlan, Labour, 1918 [1969], p. 563.
63 Maddock and McLean, "Supply–side", 1984; Gerber, "Gold", 1999.
64 Vamplew, Australians, 1987, series Ag, pp. 46–54.
65 See TheArgus, various editions, 1854–1856.
66 Davis, "Breadstuffs", 1894.
67 Rothstein, "Centralizing", 1988.
68 See Coughlan, Labour, 1918, p. 549. The war also raised grain prices in general. For example, during the 36 months prior to the war, the average monthly price of flour in New York was $4.94 per barrel. During the war, the price was $8.59, and for the 36 months after the war's end, the price averaged $5.36. Flour prices are from Cole, Wholesale, 1938.
69 Delgado, California, 1990, pp. 4–6. He adds that "Before the first shots were fired in the Mexican–American War, California had already fallen by sea to Boston trade ships."
70 Cox, "Passage", 1969.
71 Langley and Morrison, Register, 1859, p. 117.
72 Berry cites an average figure of $13.88 per ton during 1855 for goods shipped from New York to San Francisco. Return freight out of San Francisco during August of 1855 was reported to be $10 to $15, a range that spans the charge for incoming freight. By 1858, freights to San Francisco from New York had fallen to $12, while return cargo was $8 to $10. See Berry, California, 1988, p. 127. See also Prices Current, August 8, 1855, May 27, 1858, and December 27, 1858.
73 To my knowledge, no one has determined the agricultural contribution of Chileans or Sonorans. It is well known that they taught Anglo–Americans mining techniques.
74 Davis, "Breadstuffs", 1894; Paul, "Wheat", 1958, and "Beginnings", 1973; Rothstein, "Agriculture", 1988.
75 Paul, "Wheat", 1958; Rothstein, "Agriculture", 1988.
ABOUT THE AUTOR
JAMES GERBER: James Gerber received his Ph. D. in Economics from the University of California, Davis. He is professor of Economics and director of the International Business Program at San Diego State University. From 2002 to 2009 he served as the director of the Center for Latin American Studies, also at SDSU. He has been a visiting lecturer at the University of Calgary, Universidad Autónoma de Baja California Sur, El Colegio de la Frontera Norte, and the University of Debrecen, in Debrecen, Hungary. His recent publications include Fifty Years of Change on the U.S.–Mexico Border: Growth, Development, and the Quality of Life (2008), with Joan Anderson, and winner of the 2008 Association for Borderlands Studies Book Award; the edited volume Agriculture and Rural Connections in the Pacific, 1500–1900 (2006), with co–editor Lei Guang, and International Economics, 4e (2007).

