nueva página del texto (beta)
 Inglés (pdf)
 Artículo en XML
 Referencias del artículo
 Enviar artículo por email
 Citado por SciELO
  Similares en
SciELO
Similares en
SciELO 
 Permalink
Introduction1
Essentially, the distribution of total income in an economy can range from maximum equality, in which every citizen receives the same income, to maximum concentration, in which one citizen receives all the income of the economy while the rest of the citizens receive nothing. In recent times, the equality of income distribution appears to have worsened in many advanced countries (Goda et al., 2017) . According to the Nobel Prize-winning economist Stiglitz (2012) , at present the United States (US) is close to the level of inequality that characterizes dysfunctional societies like Iran, Jamaica, Uganda and the Philippines. The evolution of income concentration over the last four decades in the US has been termed as “dramatic” (Ravenscroft and Denison, 2014) and is having major social consequences (Albrecht and Albrecht, 2007) . Some authors even feel that the inequality entailed could threaten the survival of the tradition of democratic institutions (Fukuyama, 2012) . Meanwhile, in Europe, some authors draw attention to personal and social consequences. Deurzen et al. (2015) state that individuals in countries with greater income inequalities report more depressive symptoms, while Delhey and Gravolov (2014) demonstrate that Europeans are somewhat less happy in more unequal places. Gini’s concentration ratio (Gini, 1914) , which measures the extent to which the distribution of income or salaries among individuals within an economy deviates from a perfectly equal distribution, increased more than seven percentage points in Germany over the 1980 to 2010 period (IMF, 2012) , just 1.5 points less than in the US.
The case of Spain deserves special attention because of the fast and dramatic worsening that total disposable income concentration has been noticed over the last few years, a process accelerated during the economic crisis. Indeed, disposable income inequality has grown significantly as of 2008, with Spain now having one of the largest rates of the European Union (EU), surpassed only by Latvia and Lithuania (Eurostat, 2014). This concern can be largely explained by the gradual impairment registered in the concentration of salaries among workers, which grew from 0.322 in 2008 to 0.340 in 2012 (INE, 2014). In fact, wage inequality, understood as the degree of concentration of salaries among workers, is closely related to disposable income concentration. Despite total personal income also depends on other sources such as labor income, property income, personal contributions to social insurance or transfer payments, among other issues (Treyz et al., 1991) , in general high wages imply high disposable income and the reverse is also true. Thus, minimizing inequality in the distribution of wages would result in a more equal disposable income distribution.
From a gender approach, gender equality is a matter of capital concern in itself as inequality between women and men violates fundamental rights. Promoting gender equality and empowering women are one of the main aims of United Nations in order to achieve sustainable development worldwide by 2015 (UN, 2000). Furthermore, the European Union recently presented their 2010-2015 strategy for equality between men and women (COM, 2010). Under the principle of “equal pay for equal work and work of equal value”, a baseline has been established to contribute to improve the place of women in society. Consequently, wages and its distribution among individual citizens and social groups emerge as a key determinant of inequality between men and women.
In this gender framework, the case of Spain also deserves special attention because gender equality has been considered a political priority over the last three decades, leading to a rapid development and consolidation of gender equality policies both at national and regional government levels (Bustelo, 2016) . However, advances toward a more egalitarian society in terms of gender could be at risk because of the fast and dramatic worsening that total disposable income concentration has been registering over the last few years. The increase in concentration of total disposable income has been accompanied by a change in the distribution of wages within gender groups that has altered, for the worse, the distribution of wages between gender groups thus jeopardizing the achievements of three decades of policy oriented towards reducing inequality between men and women (Lahey and de Villota, 2013) .
Assuming that the ultimate goal of this research is to contribute to a more informed debate in order to advance toward more egalitarian societies in terms of wages not just for the populations as a whole but also among mean and among women, this paper pays particular attention to the study of wage concentration from a gender-focused approach. In particular, this paper decomposes total wage inequality into two summands: the first one regarding female and males’ wage inequality (so called within groups), and the second one regarding gender inequality (so called between groups). We show not only inequality among women and among men but also how to measure gender wage inequality. This is understood to be as the differences in wages between each man and each woman, excluding the differences among men’s wages and among women’s wages. Identifying those groups of workers among who female or male wage inequality and gender wage inequality (between groups) are greater would result in a better understanding of the nature of the wage inequality problem; only in this way could policy-makers undertake concrete actions to reduce it.
Within this conceptual framework, our research questions can be stated as follows: (i) How does gender wage inequality compare to total wage inequality? (ii) How does wage inequality among women compare to that among men? In other words, is the distribution of salaries among women more worrying than that among men, or not? Moreover, calling for this issue to be discussed in greater depth, we analyze inequality in terms of the workers’ personal and labor characteristics as well as in terms of company characteristics. So, a third question should be added: (iii) Do wage inequality and gender wage inequality correlate alike to observable individual and labor characteristics?
In order to avoid confusion, we would like to highlight that inequality in the distribution of wages from a gender approach is really a more complex issue than the well-known persistence of the gender pay gap (average differences), although both concepts are closely linked. A wide gender pay gap implies high gender wage inequality, and certainly, narrowing the gender pay gap between women and men should lead to a shrinking in gender wage inequality figures. However, wage inequality within gender groups could remain unaffected. In fact, Morris and Western (1999) already warned that while the decline in the gender wage gap was widely seen as heralding a new era of progress for women, the sharp polarization in earnings among women, as well as among men, made it clear that the benefits of this new era were going to be distributed more unequally than before. In this line, as Shen (2014) states in her recent study, it is important to note that while the gender pay gap has narrowed in the US, overall wage inequality has increased in the past three decades, which means that the gap between the richest and the poorest individuals has widened significantly.
Assuming this relationship between inequality in the distribution of wages and gender pay gap, in a novel way, there is a good reason to look at how some of the determinants of the gender pay gap, which have been abundantly studied, can also be related to gender wage inequality. There is a significant amount of literature on the study of the determinants that affect gender pay gap. Huffman (2013) points out that workplace stratification and gender segregation are one of its principal determinants; while Blau and Kahn (2007) , Corbett and Hill (2012) and Halaby (2003) identify as determinant factors of the gender pay gap the differences in labor market experience, the segregation in higher education preferences, and personal free choices versus gender roles. So, in this sense, this research follows Shen (2014) who indicates that future studies should not only focus on the average wage gap between men and women, but more importantly, they also analyze the determinants of the gap between the richest men and poorest women. In addition, we would add that this should be extended to the gap between the richest women and poorest men and, furthermore, the overall distribution between men and women.
The rest of the paper is organized as follows. Section 2 briefly summarizes the literature on gender inequality focusing on gender pay gap determinants in Spain and other developed countries. Section 3 describes the data set and the methodology of index decomposition used in the analyses. Section 4 illustrates the use of index decomposition for the Spanish case and examines to what extent both within-gender and between-gender wage inequality depends on individual and labor characteristics. Finally, section 5 discusses the main findings of the study.
Does inequality in the distribution of wages respond to the determinants of the gender pay gap?
Theories of Gender Inequality
Generally speaking, explanations of gender differences in the labor market focus on dissimilarities in individual choice mechanisms and on structural labor market constraints (Shen, 2014) . At individual level, neoclassical human capital theory highlights the sharp increase in women’s educational attainment as the reason for the narrowing trend in the gender pay gap (Burton-Jones and Spender, 2012) , while gender differences in education and work experience are resorted to explain the persistence of the gap (Erosa et al., 2010) . Although women are on average more likely than men to complete higher education, men are still more likely than women to graduate from prestigious colleges and universities, and mainly from study programs in engineering, technology, and computer science, while women still make up the vast majority of graduates from health care and education fields, as Corbett and Hill (2012) report. With data from Germany, Ochsenfeld (2014) states that men are overrepresented in lucrative fields and that a disproportionate number of women graduate from disciplines that yield lower wages in the labor market. Additionally, women tend to accumulate less labor market experience than comparable men, which also helps explain gender wage gap from a human capital perspective. Blau and Kahn (2007) found that as much as 11 percent of the wage gender gap in the US could be explained by the fact that women, on average, have 3.5 years less of full-time work experience than men.
An ongoing debate about the human capital explanation is whether the observed gender disparities in educational and work experiences are the result of individuals’ personal free choices, as economic theory assumes, or rather the consequences of social construction in terms of gender roles. Three main sociological approaches—gendered socialization, statistical discrimination, and social capital—try to explain how social values, conventions, and systems shape individuals’ choices in driving work-based careers. The gendered socialization approach postulates that the differences between men and women’s preferences for occupational sectors mirror different social expectations attached to gender roles (Sallee, 2011; Pant, 2014) . An illustration can be found in Halaby’s (2003) study using the Wisconsin Longitudinal Survey. This shows how women are more risk averse in their occupational choices and express weaker preferences for high-risk, high-return job values, than men because their socialization process is less strongly oriented toward reaching economic success in the labor market. The statistical discrimination approach suggests that the proportion of gender pay gap unexplained by human capital determinants highlights the fact that when employers hire personnel they need to predict how individuals will perform in the workplace and, consequently, will assign men and women to different jobs according to average, instead of individual, productivity (Fang and Moro, 2010; Belley et al., 2012) . The social capital explanation of gender pay gap postulates that the women’s network assistance is weaker than that of men. Consequently, women are more likely to have lower entry salaries and less likely to gain assistance via networks to get promoted to the high-responsibility, high-pay jobs necessary for further career development (Timberlake, 2005) .
Gender Pay Gap Determinants
At structural and aggregate levels, the explanations for gender pay gap in recent times focus mainly on the shifts in the industrial structure and the changes in both industrial relations and employment arrangements driven by skill-biased technology change and globalization. The literature on gender pay gap —see, Olson (2013) , for a recent review in which many countries are considered— provides answers that can indicate concrete actions to undertake in order to reduce the pay gap between men and women, a determinant of gender inequality which has proven to be both persistent and universal. The gender wage gap is accounted for to a substantial degree by the gender composition of occupations and industries. In his review of the organizational bases of gender pay gap in the US, Huffman (2013) points out that workplace stratification and gender segregation are still crucial determinants of gender differences in average earnings. Indeed, as a report from the European Parliament shows, men and women continue to work in different activity sectors and within different occupations in the European Union countries (COM, 2010), and the same is true for other advanced economies. Gauchat et al. (2012) found that the effects of occupational segregation on gender pay gap in the US are only slightly diminished by the presence of globalization. In the same line of thought, the analysis by Baron and Cobb-Clark (2008) of the sources of gender wage gap across public and private sector wage distributions in Australia points to a prominent role of gender segregation within sector-specific occupations in explaining relative wages.
Additionally, cultural differences, such as the presence of stronger gender stereotype patterns attached to traditional gender roles can help explain why women still earn lower average wages than otherwise comparable men. In this respect, Castagnetti and Rosti (2013) point out, using data from Italy, that in contexts where gender stereotypes are most likely to occur, tournaments appear to be less fair and, consequently, the unexplained component of the gender pay gap is higher.
Because of all these social and economic determinants, Shen (2014) puts forward suggestions on how the persisting gender pay gap and gender wage differences might be corrected. She suggests taking actions: (i) to guide children and youths to discover their potential talents which lie beyond gender stereotypes; (ii) to evaluate women’s work performance fairly, free from statistical discrimination; (iii) to implement family-friendly policies to increase the proportion of mothers who re-enter the work force; (iv) to strongly enforce equal opportunity employment policies that help eliminate gender wage differentials resulting from sectoral and occupational segregation; and, (v) to increase unionization in part-time jobs in the service sector, where a higher percentage of women work.
However attempting to reduce not just the gender pay gap but also the gap between the richest and the poorest requires the analyses of wage concentration to be focused on the way total wage in the economy is shared among specific groups of workers, including gender groups. This is required because, as stated by Aláez-Aller et al. (2011) after analyzing 13 European countries, paradoxically Spain, Greece and especially Portugal are the countries with the greatest wage dispersion due to differences in the upper part of the distribution. However, there is a modest middle class with low wages (in the context of the EU) albeit very concentrated and very uniform in their pay levels, both for men and for women. As a part of their study of gender and leadership in Spain, Hernandez et al. (2014) analyze the underlying mechanisms of gender inequality, suggesting that the economic crisis appears to have had a negative effect on gender wage equality in Spanish society by triggering a regression toward more traditional gender roles, instead of providing new chances for gender equality development. For example, Yun (2011) analyses the effects of the recent recession on gender wage inequality in the US, showing that discrimination against women in wage payment value has not improved over the recession, in spite of some signs pointing toward a reduction in gender inequality. Indeed, inequality among men seems to have narrowed, while inequality among women stayed relatively steady.
Hypothesis about wage inequality from a gender perspective. Expected results
Although most empirical research on gender inequality aims at explaining observed differences in average wages between men and women (i.e., gender pay gap), the findings can also help to understand gender-related differences in the degree of concentration of the distribution of wages; this is the aim of our study. Accordingly, we can predict from our research hypotheses some of the patterns of wage concentration indexes that are likely to be found in Spain in light of the existing evidence about gender pay gap and taking into account Spanish idiosyncrasy. To begin with, we expect both total and gender inequality to be relatively low among the youngest groups of workers and relatively high for the eldest groups. We expect this as a consequence of the cumulative nature of work experience, a source of human capital, over the life cycle of individuals. A growing pattern for inequality in the distribution of wages can be expected also in terms of the workers’ education, the other main source of human capital, in spite of the increasing participation of women in higher education. The main reason is that highly educated women in Spain continue to be more likely to work in positions with low monetary returns to education than men (such as teachers, nurses, social service workers, as well as in administrative and business support occupations), while men are still more likely than women to work in high return occupations (such as business management, engineering, and computer- and science-related occupations).
In terms of job characteristics, we expect to find a more unequal distribution of annual wage among workers in part-time jobs than among workers in full time jobs as a consequence of the greater variance in the number of hours actually worked per year of the former group. Total inequality in the distribution of wages per hour should be lower than that in the distribution of annual wages. However, as in Spain women are much more likely to work part-time than men, a high degree of gender inequality in the distribution of wages per hour is also expected for part-time workers as compared with full-time workers.
As for the type of work contract, higher levels of wage inequality and gender wage inequality are expected for those in permanent employment than for those in temporary contracts. The main reason is that the successive waves of deregulatory labor market legislation in Spain have resulted in a landscape where the younger cohorts of workers no longer have access to permanent employment arrangements. Consequently, younger workers —for whom inequality should be lower in relation to the human capital explanation— hold the largest number of temporary contracts and, therefore, inequality among workers with temporary work contracts should be lower than among workers with permanent work contracts.
The size of work organizations may have an influence on both total and gender wage inequality. On the one hand, one would expect lower total wage inequality among those working for large organizations as a reflection of the much lower presence and negotiation power of unions in micro and small companies. However, on the other hand, one would expect higher gender wage inequality as the size of the companies grows because in Spain the vast majority of business directors and executive managers working for big corporations are men, while women continue to work largely in administrative and business support positions.
Finally, in terms of the type of corporate control, both total and gender wage inequalities are expected to be much lower among workers of publicly ruled organizations than among those working in private, market-oriented companies. In Spain, as well as in many other countries, pay scales in the public sector are narrower than in the private sector, and, additionally, there is a legal mandate for the public sector to apply equal opportunity principles in their recruitment, job-assignment, and internal promotion policies. This idea is strengthened by Arulampalam et al. (2006) , who state that the public sector tends to compress wage distribution.
Methods
Data
To study income inequality in depth in Spain, this paper deals with the one of latest available data regarding wage distribution included in the four-year Spanish Structure of Earnings Survey conducted in 2010 (SES, 2012). The main objective of the survey (N=216,769) is twofold: (i) to gain knowledge about wages, not only average levels but also about their distribution, and (ii) to gain knowledge about the determinants of the wage structure, both from the point of view of composition and of the variables with an influence on wages. The 2010 SES survey implements common European methodological criteria, that is, common definitions and harmonized methodologies (EC, 1995; EC, 1999; EC, 2005; EC, 2009) . Micro-data records for individual workers include information on salaries as well as on personal attributes and characteristics of their workplaces (see Table 1).2
Variables
The study considers the distribution of the variable “gross annual wage by worker”, including payments in kind, in order to study the levels of wage inequality within the different groups of workers, as well as gender wage inequality. Additionally, the distribution of the variable “earnings per hour and worker” is also analyzed to isolate the effect that the significant presence of women in part-time jobs has on their annual wage in Spain.
The 2010 SES survey covers information regarding 25,104 Social Security contribution accounts (companies) and 216,769 individual workers. The random unit selection procedure followed a two-stage stratified sampling design, with first stage units corresponding to Social Security contribution accounts, and workers being the second stage units. In particular, the first-stage units were classified into 26 activity groups (sections and subsections of CNAE [2009]), which were regarded as independent populations for sampling purposes. Each activity was stratified by size in eight intervals (from 1 to 4 workers; 5 to 9; 10 to 19; 20 to 49; 50 to 99; 100 to 199; 200 to 499; and more than 500 workers) and by region (17 Autonomous Communities plus the autonomous cities of Ceuta and Melilla, 18 in total). All Social Security contribution accounts with more than 500 workers were selected in the first stage and random selection was applied in the rest of strata. Sample sizes per stratum were obtained by prefixing an admissible error of 5% in the scope of activity and Autonomous Community.
The list of units selected in the first stage was sent back to the Social Security General Treasury which obtained the list of workers who made social security contributions during the whole of October in the reference year, 2010. Individual workers, the second-stage units, were randomly selected from this second list.
Measure
In dealing with the quantitative analysis of inequality among values of a frequency distribution, Gini’s ratio (Gini, 1914) has been the most commonly used tool in the scientific literature over the century of its existence (Basulto and Busto, 2010; Giorgi, 2005) . The ratio is based on the relative differences between the cumulative proportion of population  and that of their aggregate income
 , where
  and
and  represents the individual income values ranked in increasing order.

By definition, the value of Gini’s ratio ranges between zero and one. Zero corresponds to a situation of perfect equality (minimum concentration) in the distribution of aggregate income, while one corresponds to a situation of perfect inequality (maximum concentration) in the distribution of aggregate income. The higher the figure the greater the concentration of the distribution, or, equivalently, the stronger the degree of inequality.
Unfortunately, equation (1) can only be applied when there are no repeated values in the ranking of individual income values  . This fact means that Gini’s ratio as expressed in equation (1) cannot be calculated with sample data from surveys because the system of weights required to infer population values from sample values always implies that any given value of income appears more than once, and can even appear a non-integer number of times in most situations. When dealing with sample data from surveys, Gini’s ratio is computed through an alternative formula (Larraz, 2015):
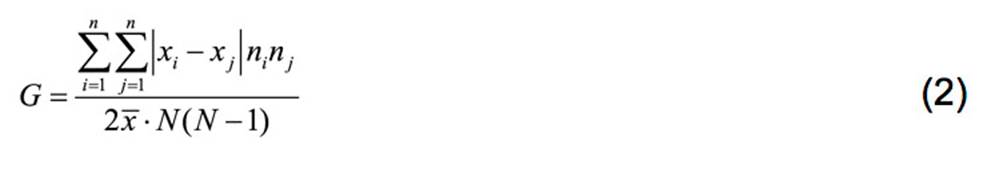
where population is N elements, where  of them earn
  monetary units.
To identify the contribution of gender inequality (between-groups) and that of male and female inequality (within-groups) to total inequality, we use Larraz (2015) decomposition of Gini’s index:  where
where  measures within-group inequality contribution to the total index (i.e., the contribution of the inequality within the male group and within the female group to the total index) and
  measures gross between-group inequality contribution to the total index (gender inequality, seen as Gini’s mean difference between women and men income). Note that this decomposition considers Dagum’s between-groups inequality measure (Dagum, 1997) based on Gini’s mean difference instead of that of Theil (1967) , which is based on the assumption that every individual inside each group has the same income: the average. Theil’s assumption does not consider variability within men’s and women’s groups, nor the asymmetry of the distribution of wages. The method adopted here is particularly appropriate for gender inequality studies because it applies to overlapped population groups, instead of only to non-overlapping groups, as is usually the case in poverty analysis.
It is worth highlighting that changes of scale do not influence the value of the inequality index, which implies, for example, that the fact that inequality among less educated people is lower than among university graduates is not a consequence of their lower incomes, but due to real, higher inequality in the distribution of aggregate income among people with lower educational attainment than among university graduates.
The Gini concentration index and its decomposition jointly offer a new way of disclosing income inequalities among different groups of citizens. This opens new research avenues to carry out more in-depth studies of gender inequality by focusing on how total inequality splits up in within-gender inequality and between-gender inequality for specific groups of people defined in terms of personal attributes and labor market characteristics. From a statistical point of view, however, the estimators involved are non-linear and do not show simple expressions for their second-order moments, which are required to estimate the standard errors and correlations needed to derive statistical tests for significant differences in inequality. Hence, to overcome this difficulty, the sampling distribution of the estimators has been obtained by bootstrapping, a technique that enables the estimation of the sampling distribution of almost any statistic (Efron and Tibshirani, 1993) . In particular, the estimates for the second-order moments of the inequality indexes have been obtained by independent resampling with replacement, hundreds of times, in each stratum (Rao and Wu, 1988) .
Results
Total wage inequality analysis
Estimates from SES (2012) survey show, using simple descriptive statistics, a noticeable gender pay gap (see Table 2), both annually and per hour. Likewise, scrutinizing distributions (see Table 3), we can see that the value of the general inequality index in the distribution of annual wage is 0.3272 for the Spanish working population as a whole. For a better understanding of where wage inequality in Spain ranks within the international context, the figure can be compared to the data provided by Eurostat (2014) on disposable income inequality in 2010. Figure 1 shows that disposable income inequality in Spain is one of largest of the European Union (EU) and that it has worsened during the economic crisis. Stiglitz (2012) suggests that countries that are reasonably well-distributed have a 0.3 Gini’s coefficient for income inequality, while countries with high inequality exceed 0.5.
In order to correct the statistic-disturbing issue of the unequal proportions of part-time workers by gender, it is useful to include the distribution of wage per hour into the study. If we focus on inequality in wage per hour distribution, we note that the figure reduces to 0.2879, reflecting that the distribution of wage per hour among all workers is more egalitarian than the distribution of annual wages, because differences in salaries due to the type of job (part-time and full time job) disappeared. Nevertheless, due to the higher proportion of women working part-time (30.41%) compared with men (11.33%) in Spain, the effect of dealing with annual salaries or wages per hour varies depending on the type of index considered (female, male or gender inequality index) (see Figure 1 and Table 3).
Between and within groups wage inequality analysis
Figure 2 shows that the inequality index between gender groups is higher than the total inequality index in Spain, especially when the indexes are measured in terms of wages per hour. This fact is due to the inequality in distribution of wages among women and men, which can be partly explained by the existing gender pay gap. Considering women and men separately, as different groups, in terms of annual wages, it is worth noting that women present more wage inequality among them than men do, despite their salaries being on average clearly lower than those of men. Moreover, the difference between those indexes is statistically significant, as it is observed in Table 3, where female and male inequality index significant differences have been flagged (α=0.05) by row with an asterisk. However, in terms of wage per hour, the degree of inequality among men is higher than that among women. Analyses by labor characteristics will show the underlying causes of this fact.
The decomposition of the general index reveals that almost half of the total inequality (49.3% or 49.9% in annual wage or wage per hour, respectively) is due to differences among people of the same gender (female and male inequality) and the other half (50.7% or 50.1%, respectively) to inequality between gender groups (see Figure 2).
The following subsections analyze wage inequality for specific groups of workers defined in terms of (i) individual characteristics of workers, (ii) the type of jobs they perform, and, (iii) characteristics of the companies they work for. The analysis is conducted separately in annual wage terms and wages per hour terms to highlight the influence of part time jobs on inequality as previously discussed. Numerical results may be consulted in Tables 4 to 6 in annual wages and in Tables A1 to A3 on the supplementary (online) material (Appendix I). A graphical presentation of the figures is also provided to make the analyses easier.
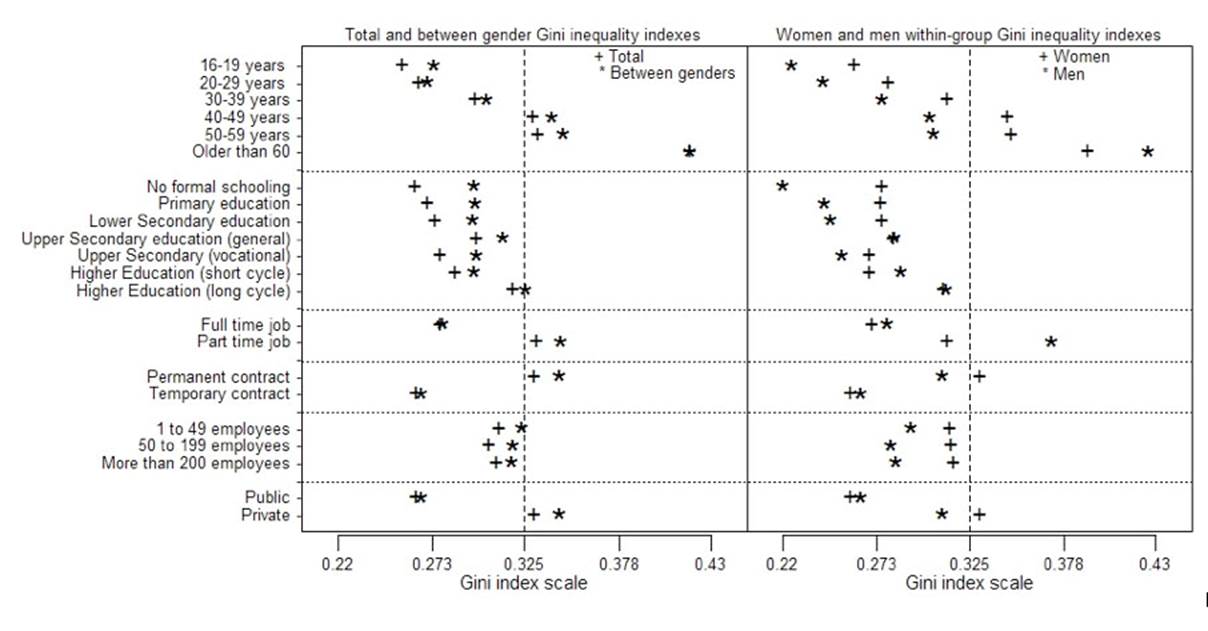
A joint graphic display of the inequality indexes for annual salaries available in Tables 4 to 6 is shown in Figure 3, from which some patterns clearly emerge. On the one hand, it is easy to observe that gender inequalities are systematically higher than total inequalities despite their closeness and that, as a rule, the distributions of female wages are more unequal than those of men. On the other hand, it also highlights the strong relationships that exist between total and gender inequalities and between female and male inequalities. Indeed, from a regression analysis (without intercept) conducted to capture the relationship between gender wage inequality (between groups) and total wage inequality, we conclude that gender inequality is, on average, almost 4% higher than total inequality on annual salaries (and 2% higher on average when considering wages per hour, see Figure A1). When comparing female inequality with male inequality on annual salaries, Figure 3 shows that, although most of the subgroups present greater inequality within women than within men, a smaller linear relationship in a regression without intercept exists and consequently more variability would exist over the 4% higher average estimated inequality among women than among men.
Apart from the female-versus-male inequality significance tests (flagged in Tables 4 to 6 and A1 to A3 by row, using asterisks), other tests have also been performed within each gender inequality index to compare differences between each combination of two levels of characteristics. Results are reported in Appendix II of the (online) supplementary material, see Figures A6 to A13. We have shaded the intersections whose corresponding inequality indexes are significantly different (α=0.05).
Wage inequality by workers’ characteristics
To avoid too many figures and tables, wage per hour results are depicted in Appendix I in the supplementary (online) additional material. Figure 4 (upper panel) illustrates the estimates of inequality indexes in the distribution of annual wage for workers classified according to their age (see Table 4). Apparently, total inequality in the distribution of annual wages and wages per hour increases with the worker’s age, and the same occurs with gender inequality, the latter being more serious than total inequality for all age groups. Inequality indexes within gender groups in annual wages also increase with age for both men and women. The distribution among women, however, is less egalitarian than among men for all the age groups, with the only exception being the group of workers aged 60 or more, for whom inequality among men is markedly higher than inequality among women.
In wages per hour (see Appendix I), it is worth highlighting the only exceptions of the groups of workers are those younger than 19 and older than 60; for these two groups at the ends of the age scale the distribution among men is less egalitarian than that among women, less egalitarian than between-gender distribution, and less egalitarian than the global distribution as well.
Figure 4 (second panel) illustrates the estimates of inequality indexes in the distribution of annual wage for workers classified according to their educational attainment (see also Table 4). By educational groups, total inequality in the distribution of annual salaries and wage per hour appears to increase with the level of educational attainment. However, the relation between inequality and education level is not monotonous, since the group of workers with academic upper secondary education shows higher inequality than the group with short-cycle higher education. Inequality between genders according to education level is higher than total inequality irrespective of the education level considered. It is worth noting that the inequality indexes in the distribution of wage per hour among women are lower than those among men, reflecting a more egalitarian distribution of wage per hour among women than among men for all the education levels. The relations between female and male inequality indexes in annual salaries are shown on the right panel of Figure 4.
Wage inequality by jobs’ characteristics
Figure 4 also shows the estimates of inequality indexes in the distribution of annual wage for workers classified according to observable characteristics of the job they perform (third and fourth panels). Numbers are shown for workers in part-time vs full-time jobs in the upper panel of Table 5, and for workers with permanent vs temporary jobs in the lower panel. Results show that total inequality is clearly lower (and significant; see Table 5) for full-time workers than for part-time workers. Indeed, all the estimates of inequality indexes (total, between-genders, among women, and among men) are higher for workers in part-time jobs than for those in full-time jobs, reflecting the smaller variance in the total number of working hours per year for the group of full-time workers. Noticeably, between-gender inequality figures are higher than total inequality figures irrespective of the type of job considered. For part-time workers, inequality among men is higher than among women, and it is also higher than between-gender inequality. The decomposition of the total inequality index shows that the contribution of within gender inequality to total inequality is greater than the contribution of between genders inequality, particularly for part-time workers.
Turning our attention to the type of work contract, the inequality indexes are higher for workers with a permanent contract than for those with a temporary contract. Again, the distribution of wages is less egalitarian in between-gender groups than the total distribution, the distribution among women, and the distribution among men. The distribution of annual wage for workers with permanent contracts is less egalitarian among women than among men, while the opposite holds true for workers with temporary contracts: inequality for workers with temporary contracts is higher among men than among women. The decomposition of the total index reveals that both within-gender inequality and between-gender inequality have a similar contribution, around 50 percent, to total inequality.
Wage inequality by companies’ characteristics
The analysis of some of the companies’ characteristics leads to interesting findings. Figure 4 (fifth panel) illustrates the estimates of inequality indexes in the distribution of annual wage for workers classified according to company size, as measured by the number of employees. The results show that inequality indexes in the distribution of annual wage do not change much across company sizes, being slightly higher for employees working in small companies than for employees of medium or large firms (see Table 6). However, between-gender inequality is more intense than total inequality irrespective of company size. Within gender groups, inequality among men is always lower than among women for employees in companies of any size. Nevertheless, considering wage per hour (see Appendix I), we clearly find that inequality increases with company size and in small companies, male inequality is higher than female one.
Regarding the dominant type of corporate control, public or private, all four inequality indexes of the distribution of annual wages and wages per hour are higher for individuals working in companies under private control than for workers in publicly controlled work organizations. The distribution of annual wage between genders is less egalitarian than the total distribution for those working in privately controlled firms, but not so for those working under public control. Studying annual wages, inequality among women is higher than among men in private companies, while the opposite is true in public corporations. Nonetheless, the distribution of wage per hour appears to be less egalitarian among men than among women for both types of work organization.
Conclusions and discussion
This paper develops a depth of knowledge regarding wage inequality in Spain, understood as the degree of equality in the distribution of wages in total and gender terms and depending on labor characteristics. Overall, the wage inequality of the whole population is dependent on wage differences among people of the same gender to the same extent as on wage differences among people of different gender. This fact suggests the need for policies to reduce both types of inequalities; policies oriented to reduce total wage differences by reasonable limitation of excessively high remunerations and effective policies that help to reduce gender wage inequality.
The analysis shows that inequality between genders (partly caused by the existing gender pay gap) is greater than total inequality in all cases. As long as men earn more per hour on average than women, gender wage inequality (understood as the differences on wage between each man and each woman) will remain. As long as a large proportion of the total payroll per hour continues to rest with men, gender inequality will continue to exist. It is only by combating the gender pay gap between every man and woman, and not just on average, that gender inequality will decrease. The issue, however, requires further research.
In the case of feminine gender, because so many women are part-time workers in Spain, we appreciate that women present more inequality among themselves than men with respect to annual salaries. Promoting the incorporation of women into full-time work would reduce female inequality. In contrast, in terms of wage per hour, we detect greater differences among men than among women. Inequality among men could be reduced by closing the gap between the highest and lowest salaries, and trying to share, as much as possible, the total wage bill. This should be addressed as a policy priority.
Of course, wage inequality as well as gender pay gap depends on the personal and labor worker’s characteristics and on company features. In this sense, the analysis confirms our initial predictions of increasing inequality with age, with the level of educational attainment and with work experience. Indeed, inequality amongst older men is the highest in the whole study because some of them hold the best remunerated jobs in Spain. Focusing on the high gender wage inequality that exists among workers older than 40 years, but more specifically among those older than 60 years, we can conclude that differences in work experience between genders could explain such high value, in line with what the theory of gender pay gap states. Nevertheless, what the approach showed in this paper also finds is that such differences can be also found to a greater extent among men, because inequality among them is also greater than between both genders in this case.
Additionally, workers on permanent contracts present greater wage inequality among themselves than do those with a temporary one, confirming that permanent jobs are predominately staffed by older and more experienced workers because of the difficulties that the younger generations have in Spain to sign a long-term contract.
The concern that in Spain the vast majority of directors and senior executives working for big companies are men is at the root of the problem, because total and gender inequality wage increases also with company size in wage per hour terms. In this point, we can look at the presence of strong gender stereotype patterns attached to traditional gender roles cited to explain the gender pay gap also to explain the high gender inequality in the larger companies. In this sense, to reduce this gap, senior managers’ salaries should also be included in union negotiation, because, ethically how much should the ratio be between top-level management and an employee’s average wage? This inequality, which is affecting women more severely than men, is also greater amongst workers in private companies than in public. This is due to the narrower pay scales present in the public sector than in private companies, and because of the gender equality legislation, which seems to be more appropriately addressed in the public sector. Likewise, in line with our expectations, we found more unequal distributions among workers in part-time jobs, being these more noticeable within the group of men.
On the other hand, contrary to our expectations, we do not observe lower total wage inequality among those working for large organizations neither higher gender wage inequality as the size of the companies grows. It seems that the size of the company has not any effect on the distribution of salaries, the high levels of inequality indexes observed in Spanish companies do not depend on company size.
Finally, it is important to highlight that the approach suggested in this paper shows us that, apart from the gender pay gap, also great inequalities are present among women and among men. We conclude that, to reduce total inequality policy makers should take actions in order to: (i) bridge the gap between high-wage and low-wage workers; (ii) reduce gender inequality by promoting full-time female employment; and, (iii) reduce the gender pay gap in order to share the work and income. Additionally, the implementation of policies should pay special attention to those most vulnerable groups of workers, which this study helps identify. The answers to the questions raised in the introduction allow us to map the nature of wage inequality in Spain by identifying the most vulnerable citizens as those nested in groups for whom both total wage inequality and gender wage inequality are higher. Consequently, we disclose the main traits of wage inequality in Spain, an insight that may help establish an agenda designed to support decision-making processes leading to an effective reduction of disposable income inequality across the whole population. On the one hand, reducing gender wage inequality resulting from occupational segregation would require the enforcement of consistent equal-opportunity employment policies. Furthermore, women’s work performance should be evaluated fairly, independent from statistical discrimination, which would require that employers publicize employees’ income information and adopt transparent procedures for recruitment and promotion evaluation processes. On the other hand, gendered socialization still plays a crucial role regarding the youths’ perceptions of their talents and limitations, preferences and future career paths; to reduce its effects in the long-run, early-stage training programs would help guide young people to realize their potential beyond prevalent gender stereotypes. Family-friendly policies may help to compensate the fact that family roles still hinder advances in gender equality in accessing on-the-job training opportunities and accumulating work experience. In addition, reducing total wage inequality could lead to a reduction in disposable income inequality and, in so doing, a reduction of future poverty risks. Moreover, such measure could lead to a greater empowerment of women and, therefore, to the development of more effective gender equity policies. Finally, future research on other potential covariates of wage inequality, such as occupation or activity sector, will help governments to map gender inequality in detail in order to enable more effective actions and policies to reduce gender inequality.