


 nueva página del texto (beta)
 Inglés (pdf)
 Artículo en XML
 Referencias del artículo
 Enviar artículo por email
 Citado por SciELO
  Similares en
SciELO
Similares en
SciELO 
 Permalink
Introduction
There is considerable interest in estimating forest biomass for several reasons, among which practical topics of forestry and scientific inquiry are outstanding. Forest biomass is essential because of commercial uses, while scientific studies investigate ecosystem productivity, nutrient, and energy flow, and the contribution of forest terrains in the global C cycle (Pan, Birdsey, Phillips, & Jackson, 2013). Thus, vegetation inventories are necessary to estimate variations in the C stock and net emissions of greenhouse gases (GHG) over time (Houghton, 2012).
In the field of measurement methods and analysis of C sequestration, both direct and indirect measurements, generated through modeling, are used. The methods differ in precision, verifiability, cost, and application scale (Food and Agriculture Organization of the United Nations [FAO], 2000). Usually, measuring the C stock variables for a given area increases as the desired precision and landscape heterogeneity increase (MacDicken, 1997; FAO, 2000). In recent decades numerous studies on direct measurements have been conducted to relate the characteristics of trees, such as diameter at breast height and total height, to biomass (Návar, 2009; 2014; De Lima, Alves, de Oliveira, da Silva, & Ferreira, 2017).
The bases of the allometric equations are in the allometry (Huxley, 1932), i. e. in the relationship between the size and shape of live organisms. The premise is that size influences the behavior of structural, mechanical, and chemical systems (Niklas, 2004). These equations are used in studies on forests, to relate the biomass of some components of the tree to easily measured auxiliary variables, such as tree dimensions. This procedure was called initially dimensional analysis (Whittaker, & Woodwell, 1968). Biomass data and tree dimensions are recollected by measuring individual trees covering a representative size range of the population. The relationship between tree´s biomass or one component of this biomass derives from a regression analysis, which provides an expected value of the dependent variable (biomass of a component) for a given value of the independent variable (dimension or dimensions measured on the tree). Along with the prediction, an associated error and a test of confidence are obtained (Niklas, 2004).
The peculiar conditions of the sites where the equations are applied must be a consideration. One of these considerations is to use equations generated for species found in similar ecological conditions (Ter-Mikaelian, & Korzukhin, 1997; Litton, & Kauffman, 2008). If there are several equations reported for a given species, the generation of a new equation from available data is possible (De Lima et al., 2017). The implementation of these procedures becomes complex in certain ecological regions, such as the TDF since most of the developments of allometric relationships have been for temperatecold climate forest species and wet tropical forests (Ter-Mikaelian, & Korzukhin, 1997; Chave et al., 2005; Návar, 2014). Information on TDF is limited (Martínez-Yrízar, Maass, Pérez, & Sarukhan, 1996; Návar, 2014), and generally, the genera-tion of these relationships is more problematic (De Lima et al., 2017).
Objectives
The specific objectives of this study conducted in TDF were: (1) to generate an allometric model to estimate total aboveground biomass based on the diameter at breast height (dbh) of the dominant species; (2) to compare the models generated for dominant forest species and explore the possibility of using a single equation for the group of analyzed species; and, (3) to generate a multiple linear regression model that would permit predicting aboveground biomass from the basal area (BA), specific wood density (SWD) and height (h) of the different species studied.
Study site
The study was conducted in a representative site in Sierra de Huautla Biosphere Reserve located in the southern part of the state of Morelos, Mexico, within the Ejido El Limón. The tree vegetation in the selected experimental site is representative of the entire woody area. The geographical coordinates of the site are 18° 31' 15" to 18° 32' 12" N, and 98° 55' 20" to 98° 55' 60" W, and the altitudinal range is from 1219 m a.s.l. to 1361 m a.s.l. Native vegetation is characteristic of the tropical dry forest (TDF). The prevailing climate is warm subhumid with summer rains; that is, it is markedly seasonal with a dry season from December to late May. Only 13% of the annual rainfall (900 mm to 1000 mm) falls during this period. The mean annual temperature is 22 ºC to 23 ºC. Soils are predominantly Haplic Feozems (Hh) with medium to fine textures, rocky on the surface and throughout the profile. The substrate is andesite and riolithic volcanic breccias interstratified with volcanic tuffs of medium nature. Dominant topoforms are steep mountains with intermountain valleys.
Species
We selected the following species for the development of allometric equations: Acacia cochliacantha Humb. and Bonpl. ex Willd (Mimosaceae), Lysiloma microphyllum Benth (Fabaceae), Ipomoea arborescens (Humb. & Bonpl. ex Wild.) G. Don (Convolvulaceae), Conzattia multiflora Rob Standl (Caesalpinaceae) and Euphorbia schlechtendalii Bois (Euphorbiaceae). The relative abundance of these species in the TDF of the Sierra de Huautla Biosphere Reserve was the bases for the selection.
Generation of the allometric equations to estimate biomass
Eight trees per species were selected and measured before felling them. The tree diameter at breast height (dbh) was registered. Small trees (2.5 cm < dbh < 10 cm) were cut at ground level. Species branching out close to the trunk base (A. cochliacantha and E. schlechtendalii), were also cut at ground level, but the main branches (primary and secondary) were separated, and their diameter also measured at breast height. These branches have an architecture like the mother tree, therefore, they were considered as individual units for conducting the measurements. The base of the main trunk was distributed proportionally among the different units, using the basal area (BA) of individual branches as a reference. The sum of the dbh from different secondary branches of each tree counted as a single value for each primary branch. Cut and measured material was weighed fresh in the field and later transported to the laboratory where it was dried on greenhouse benches for 30 days to constant weight to obtain biomass dry weight. The largest trees (dbh > 10 cm) were cut into sections, both the main trunk and branches, to obtain sub-samples. By following the criteria proposed by Acosta, Vargas, Velásquez and Etchevers (2002), trees total biomass was estimated. Projections of the total biomass and dry weight/fresh weight ratio were obtained from data recollected from seven slices (approximately 5 cm thick) cut at different height positions in the main trunk of individual trees having a dbh > 10 cm. The first three slices (P1 to P3) came from the section corresponding to the clean shaft; P1 at 0.30 m above ground level, P2 at 1.3 m (breast height), and P3 midpoint between P2 and the base of the crown. The other four slices were obtained by dividing the crown into four sections from the base to the apex. The slices corresponded to the base of each of these sections.
Each tree individual fresh weight was determined separately from the tree section (trunk and crown) from where slices were collected. In all cases, foliage and small branches corresponding to each tree section were included. All recollected material was dried to constant weight. To obtain the dry weight of each trunk section, we used the ratio dry weight/fresh weight ratio of each slice.
The same procedure was applied to obtain dry weight of branches (including foliage) of each section of the crown from the dry weight/fresh weight ratio of the sample branches. The sum of the trunk and crown sections' dry weights of each tree yielded the total biomass. After obtaining the biomass and dbh for each tree, the model of allometric relationships used by Acosta et al. (2002) and proposed by Ter-Mikaelian and Korzukhin (1997) was applied since it is one of the most frequently used.
Where Y is aboveground biomass (kg), X is dbh (cm), and a and b are the statistical parameters estimated using the minimum squares method.
By expressing model (1) in its linear form using logarithmic transformations of the variables involved and fitting it with the Y and X data as dependent and independent variables, respectively, model (2) is obtained and is expressed by equation 2 (Acosta et al., 2002):
Where Y, X, a and b have the same meaning as in equation (1) and ln(Y), ln(a) and ln(X) are the natural logarithms of Y, a and X, respectively.
The data were analyzed using SAS software (Statistical Analysis System [SAS], 2000). Parameters a and b corresponding to each species were compared to determine whether they belonged to the same model. The null hypothesis established for parameters a and b was the same, regardless of the species, and therefore, a single model would be sufficient to estimate the biomass of the five species. Complementarily, we explored the possibility of grouping the species that fit the same model.
The literature provides a considerable number of equations that are different from the form of equation (1) or that include additional, or different, independent variables, such as tree height, specific wood density, diameter at the crown base, crown dimensions, base diameter, and BA (Návar, 2009; 2014; Fayolle, Doucet, Gillet, Bourland and Lejeune, 2013). To determine whether there is an acceptable statistical correlation with other variables besides dbh and to estimate biomass of the different species, a multiple linear regression was performed based on data transformed from log10 of BA (cm2), SWD (g cm-3), and h (m) (Martínez-Yrízar et al., 1996). The SWD values were determined as the ratio of weight (g) of the dry samples from the trees to the volume of displaced water (cm3) when the samples, protected in plastic film, were completely submerged in a recipient filled with water. The multiple linear regressions had the following form (Kleinbaum, Kupper, & Muller, 1988):
Where Y is log10 of the biomass (kg); X 1, X 2, X 3, X i, are log10 of the independent variables; β 11 is the coefficient of regression of Y as a function of the variable X 1, and βo is the regression constant at the intercept of Y.
For determining if the participation of each variable in the model was significant, the strategy used was to analyze the contribution of each variable (X 1 , X 2 and X 3 ) by establishing a simple linear relationship with each of the variables (Kleinbaum et al., 1988):
Comparison of forest species models
A test to compare the parameters a and b of the simple linear regression models adjusted to the five tree species was conducted to establish the possibility of obtaining coincidental lines. This test consisted of the following hypothesis (Kleinbaum et al., 1988; Acosta et al., 2002): if, a simple linear regression where n observations can form M groups, with the m th group with n m observations, then the complete general model comprises M equations, such that
Equation (2) can represent the reduced model (RM), considering the data on all species simultaneously To test the hypothesis H0: β 01 = β 02 =...= β 0M ; β 11 = β 12 =...= β 1M , the statistic of the F test was used:
To test the hypothesis:
where F 0 = calculated value of the statistic F; RM = reduced model; CM = complete model; SS E = sum of the squares of the residuals; df = degrees of freedom.
To obtain the parameters of the complete model (4) the M regression equations were fit for each species, and SS E (CM) was found by adding the sums of the squares of the residuals of each regression. The degrees of freedom (df) for SS E (CM) were:
where n m = number of observations for species m.
RM was fit using model (2), but the data on the five species were included as one. The sum of squared errors of this model SSE (RM) was obtained from the regression analysis with n-2 df (df RM ).
The value of F
0 obtained with equation (5) was com pared with the tabulated value
Results
Dasometric characteristics
Diameter at breast height varied among the sampled trees in the range of 3.5 cm to 32.9 cm (Table 1). The variation in dbh among the species was significant (p < 0.001): in descending order, Ipomoea arborescens, Lysiloma microphyllum, Conzattia multiflora, Euphorbia schlechtendalii and Acacia cochliacantha. The last two of these species branched out less than one meter from the ground. Biomass varied among the species by more than two orders of magnitude: in descending order, L. microphyllum, I. arborescens, C. multiflora, A. cochliacantha and E. schlechtendalii. The first is a tall tree with high specific wood density, while the last species is a bush with low specific wood density. The variation in biomass between species was also significant (p < 0.005). Finally, dbh and biomass were highly variable within each species (CV = 32% to 63% for dbh and CV = 77% to 163% for biomass). The broad sampling range of dbh and biomass of each species can explain such variability.
Table 1 Diameter at breast height and biomass of trees sampled by species for generation of allometric equations.
| dbh (cm) | Biomass (kg DM tree-1) | ||||||||||
| Species | n | Mean | Min | Max | SE | CV | Mean | Min | Max. | SE | CV |
| A. cochliacantha | 8(26 *) | 6.8 | 3.5 | 12.0 | 0.9 | 33.8 | 21.1 | 4.4 | 76.2 | 6.2 | 77.3 |
| C. multiflora | 8 | 12.7 | 4.9 | 25.2 | 2.5 | 52.0 | 52.3 | 2.4 | 206.3 | 26.2 | 132.3 |
| E. schlechtendalii | 8(10*) | 9.4 | 5.0 | 16.0 | 1.1 | 31.9 | 10.3 | 2.9 | 34.1 | 3.7 | 96.1 |
| I. arborescens | 8 | 16.9 | 8.0 | 32.4 | 3.2 | 50.9 | 59.3 | 5.7 | 288.8 | 36.5 | 163.1 |
| L.microphyllum | 8 | 14.9 | 4.0 | 32.9 | 3.6 | 63.1 | 153.3 | 4.8 | 538.0 | 73.4 | 126.7 |
| F | 7.97 | 4.25 | |||||||||
| p | <0.001 | 0.005 | |||||||||
DM, dry matter; n, number of individuals sampled of each species; SE, standard error; CV, coefficient of variation; *, individual branches; F, statistic F; p, significance level for each estimated parameter
There were trees of all the species considered that had larger dimensions than those sampled in the field, but it was not possible to use them since felling in the reserve is controlled. This previous consideration means that the allometric equation's validity restricts the range of variation of the dimensions of the trees included in the sample. Therefore, the equations can be applied, with reserve, to individuals with larger sizes than those sampled. The previous comment implies that these equations are useful to determine the biomass of the same species in other sites or regions with similar ecological conditions, if there are similar growth characteristics (Ter-Mikaelian, & Korzukhin, 1997; Urquiza, Dolman, & Peres, 2007).
Table 2 presents the sampled tree characteristics to estimate the multiple linear regression models. The specific wood density (SWD) was higher in L. microphyllum and A. cochliacantha, both with similar values (p = 0.999) that were higher (p < 0.001) than those of the other tree species by about a factor of 2.0. Specific wood density of C. multiflora was also very similar (p = 0.323) to E. schlechtendalii, and different from those of I. arborescens (p < 0.001), whose SWD was the lowest of all the species studied. The variation in SWD within each species was generally below 10% (CV = 7.2, 10.0, 7.0, 12.1 and 9.6, all in percentage, for A. cochliacantha, C. multiflora, E. schlechtendalii, I. arborescens and L. microphyllum, respectively).
Table 2 Specific wood density and height of trees sampled by species to determine multiple regression models.
| SWD (g cm-3) | Height (m) | ||||||||||
| Species | n | Mean | Min | Max | SE | CV | Mean | Min | Max | SE | CV |
| A. cochliacantha | 8(26)* | 0.83 | 0.70 | 0.92 | 0.02 | 7.2 | 5.80 | 4.4 | 6.8 | 0.21 | 9.7 |
| C. multiflora | 8 | 0.40 | 0.34 | 0.49 | 0.02 | 10.0 | 7.44 | 3.6 | 11.0 | 1.11 | 39.4 |
| E. schlechtendalii | 8(10)* | 0.43 | 0.38 | 0.51 | 0.01 | 7.0 | 4.39 | 3.4 | 5.2 | 0.27 | 16.4 |
| I. arborescens | 8 | 0.33 | 0.26 | 0.39 | 0.02 | 12.1 | 6.54 | 4.1 | 11.0 | 0.87 | 35.3 |
| L.microphyllum | 8 | 0.83 | 0.68 | 0.97 | 0.03 | 9.6 | 8.22 | 5.1 | 12.2 | 0.95 | 30.7 |
| F | 390.6 | 4.52 | |||||||||
| p | <0.001 | 0.005 | |||||||||
n, number of individuals sampled of each species; SE, standard error; CV, coefficient of variation; *, individual branches; F, statistic F; p, significance level for each estimated parameter
The height of the sampled trees varied among the species studied (p < 0.005) in the following order L. microphyllum ~ C. multiflora> I. arborescens> A. cochliacantha> E. schlechtendalii. Small significant differences between L. microphyllum ~ C. multiflora and E. schlechtendalii allowed the formation of a statistically homogeneous group (p = 0.939), (p = 0.004 and 0.03, respectively). The smaller species are those with a structure that branches out near the base (A. cochliacantha and E. schlechtendalii); they showed minor variations within the species and lower CV (9.7% and 16.4%, respectively). The shorter height within species is attributed to the species' peculiar phenology (Guízar, & Sánchez, 1991). The other three species had a CV above 30% (CV=30.7%, 39.4% and 35.3% for L. microphyllum, C. multiflora and I. arborescens, respectively).
Models for estimation of biomass
The regression equations generated had coefficients of determination (R2) of more than 0.93 (p < 0.001) for the forest species that branched out above 1.3 m and more than 0.88 (p < 0.001) for species that branch out at lower heights (Table 3). C. multiflora and L. microphyllum attained the highest R2 coefficient (R2 = 0.99).
Table 3 Values of the parameters in the ln(Y)=β 0 + β 1 ln(X) model fit for each specie.
| Species | n | β0 | P | β1 | p | R 2 | df |
| A. cochliacantha | 8(26)* | -1.291 | 2.3x10⁻⁴ | 2.178 | 6.0x10⁻¹³ | 0.89 | 24 |
| C. multiflora | 8 | -3.739 | 1.5x10⁻⁵ | 2.819 | 3.8x10⁻⁷ | 0.99 | 6 |
| E. schlechtendalii | 8(10)* | -3.101 | 1.6x10⁻³ | 2.333 | 5.3x10⁻⁵ | 0.88 | 8 |
| I. arborescens | 8 | -4.005 | 2.4x10⁻³ | 2.653 | 1.0x10⁻⁴ | 0.93 | 6 |
| L. microphyllum | 8 | -1.852 | 5.3x10⁻⁴ | 2.378 | 5.2x10⁻⁷ | 0.99 | 6 |
n, number of individuals sampled of each species; β0 , value estimated from the ordinate to the intercept; β1 , value estimated of the slope; df, degree of freedom of the model; p, significance level for each of the estimated parameters; *individual branches
Intercept to the ordinate (β 0 ) for each species were diverse, with a difference in ln(a) of 2.714 between extremes. This value is related directly with SWD, decreasing as SWD decreases; factor "a" values were 0.2750, 0.1569, 0.0450, 0.0238 and 0.0182 for A. cochliacantha, L. microphyllum, E. schlechtendalii, C. multiflora and I. arborescens, while SWD were 0.83, 0.83, 0.43, 0.40 and 0.33, respectively. This result agrees with values reported by Pilli, Anfodillo and Carrer (2006), authors that established a relationship between the "a" parameter and specific wood density, as speculated by Zianis and Mencuccini (2004). The regression slope (β 1 ) or “b” parameter of equation 1 had a difference of 0.64 between the extreme’s values (C. multiflora and A. cochliacantha) correlating negatively with factor "a", coinciding with reports by Pilli et al (2006). However, the parameter "b" in our study differed slightly for some species from the theoretical value estimated by West, Brown and Enquist (1997) by 2.67 and from that reported by Zianis and Mencuccini (2004) by 2.3679. These differences may be associated with the diverse growth characteristics, crown form, and specific wood density of the different species (Acosta et al., 2002). The level of significance for the estimated parameters, both from ordinate to intercept (β 0 ) and slope (β 1 ) were acceptable (p < 0.001 in all cases).
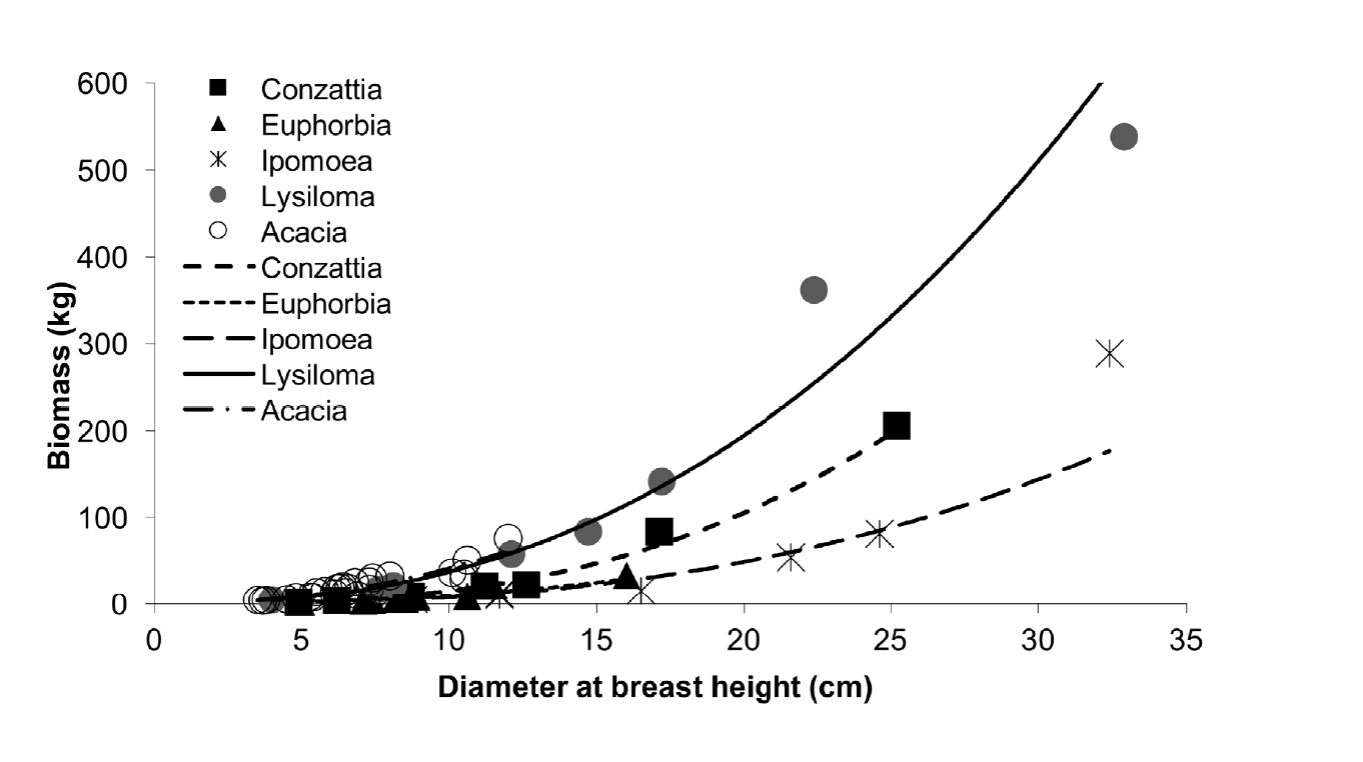
The relationship between the aerial biomass and dbh was heterogeneous (Fig. 1), suggested that the regression parameters cannot easily belong to a single model representing five species. L. microphyllum and A. cochliacantha showed a more significant increment in biomass when dbh increased than I. arborescens, C. multiflora and E. schlechtendalii since dbh of the former two species was larger. According to the models of table 3, the factor "a" which multiplies the independent variable (dbh), is considerably more prominent in the species with higher SWD. This factor distinguished two more or less well-defined subgroups: (1) L. microphyllum and A. cochliacantha and (2) C. multiflora, E. schlechtendalii and I. arborescens (CEI).
Comparison of the allometric models
Comparison of the regression parameter homogeneity of the five species determined rejection of the null hypothesis, and thus, a single model cannot be fit satisfactorily to the database of the species involved in the present study (F0 = 45.75; Ft = 1.60, p = 0.05) (Table 4).
Table 4 Values of the allometric model fit and analysis of variance for the group that includes all tree species and for two subgroups.
| Group/ subgroup | n | Β 0 | P | Β 1 | P | R2 | df | F0 | Ft | |
| All the species | 60 | -1.217 | 6.8x10⁻⁵ | 1.886 | 1.5x10⁻²⁰ | 0.668 | 58 | 45.75 | > | 1.60 |
| LA | 34 | -1.399 | 1.1x10⁻¹⁰ | 2.225 | 6.8x10⁻²⁹ | 0.955 | 32 | 1.06 | < | 1.82 |
| CEI | 26 | -3.515 | 9.5x10⁻⁹ | 2.652 | 6.1x10⁻¹⁴ | 0.908 | 24 | 6.39 | > | 2.07 |
LA subgroup, L. microphyllum y A. cochliacantha; CEI subgroup, C. multiflora, E. schlechtendalii and I. arborescens; n, number of individuals sampled of each species; β 0 , estimated value of the intercept; β 1 , estimated value of the slope; df, degree of freedom of the model; p, level of significance for the estimated parameters; F 0 = estimated value of F; Ft = F value from tables with a probability value of p = 0.05.
However, the subgroups formed based on SWD were again subjected to a hypothesis test, assuming that each subgroup's parameters were homogeneous. The first sub-group (subgroup LA) included the species with higher SWD and similarities in biomass increment when dbh increased (L. microphyllum and A. cochliacantha), while the second subgroup (subgroup CEI) included the species with lower SWD (C. multiflora, E. schlechtendalii and I. arborescens). The results of the new hypothesis test showed that the parameters within subgroup LA were homogeneous (F0 = 1.06; Ft = 1.82, p = 0.05); however, in subgroup CEI and the model that groups all the species, the parameters were heterogeneous. Thus, it is only possible to use a single equation for the species of the first subgroup, but not for those of the second or all species together (Table 4). Figure 2 presents the tendency of bio mass to increase when dbh varies in the three estimated models.
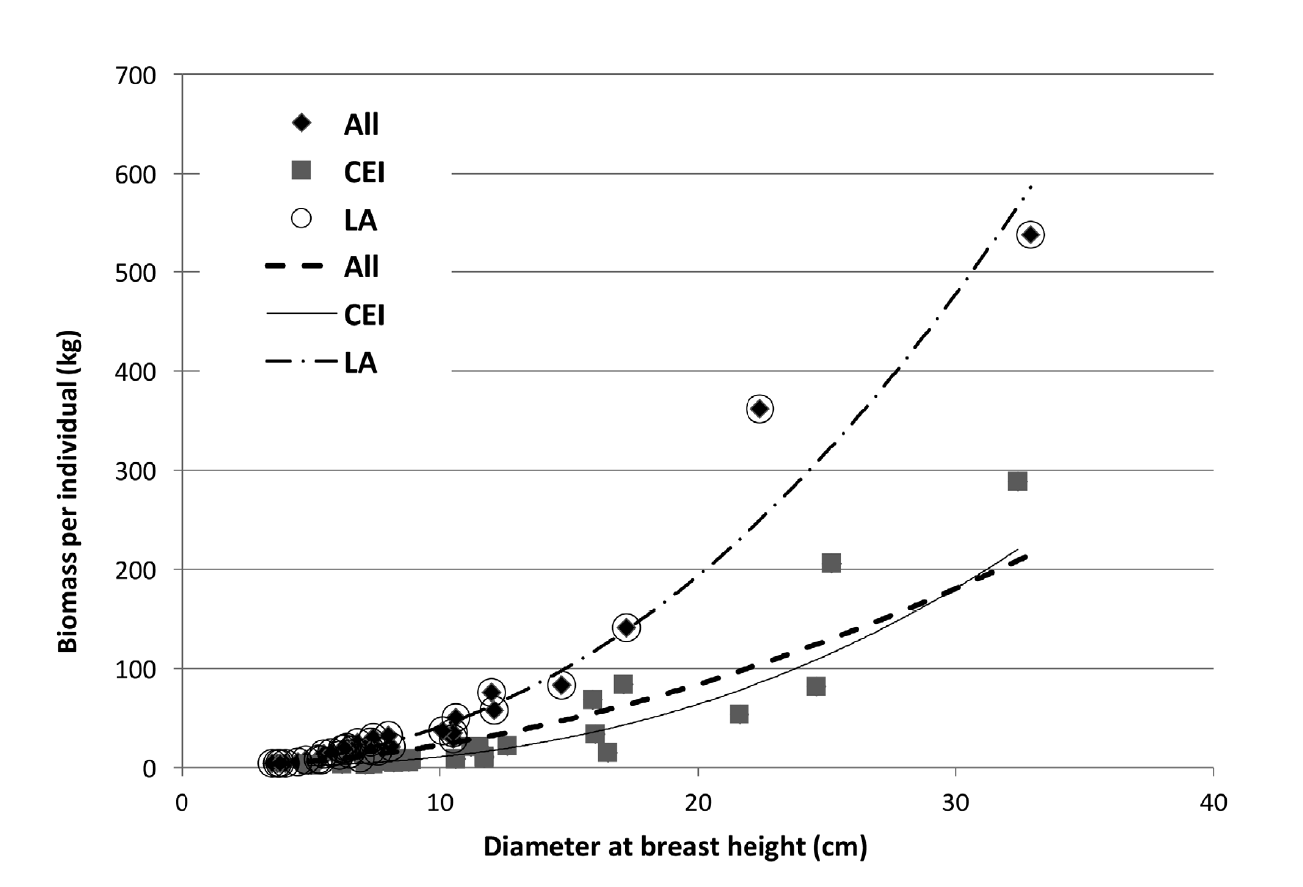
Figure 2 Trend of the expected aboveground biomass values based on linear regression models (data transformed from the logarithmic model) for the two subgroups and for the group of all studied species.
In the subgroup LA of species with higher SWD, β 0 was considerably higher than that of the low SWD sub-group CEI, fitting to the trend described above of the relationship between the "a" statistical parameter and SWD. The β 1 (b) value also correlated negatively with “a”, with a lower “b” value for group LA, whose “a” value was higher (Table 4), coinciding with Pilli et al. (2006). The model that groups the five species had the highest β 0 value but had the lowest slope value β 1 . When applying both parameters to the power model, the trend line is intermediate between the two subgroups. Finally, the regression coefficient of the model (R2) for each subset was above 0.90. In the case of the model that group all the species, this parameter was only 0.67. Significance level was higher in the subgroup LA model for all the parameters than in the subgroup CEI model (1.1 × 10⁻¹⁰ vs 9.5 × 10⁻⁹ for β 0 , and 6.8x10⁻²⁹ vs 6.1 × 10⁻¹⁴ β 1 , for LA and CEI, respectively).
It is possible to extrapolate the generated allometric functions in this study for estimating biomass of the tree stratum of the plant groups found in TDF in localities different from those of this experiment, even though it was not possible to obtain a single equation for the species analyzed. For the latter, a grouping considered sub-groups of similar SWD and the equation was applied to the subset (subgroup) with high values for this parameter (i.e., LA), given that it showed good statistical fit and minimized the level of error of the general model. The model for the low SWD subgroup CEI, which did not fit the probability value studied (p = 0.05), reduced the general model's error. The use of other specific models described in the literature to estimate biomass for multiple species of these plant communities (Návar, 2009; De Lima et al., 2017) should not be ruled out.
Multiple linear regression models for estimating biomass
Table 5 presents multiple linear regression equations based on tree BA to estimate the biomass of each species. Although SWD and tree height increased the precision of predictions, the contribution of these variables, together with BA, was not significant. Contribution of SWD (p < 0.05) was significant only in the case of E. schlechtendalii. The scarce contribution of these variables, additional to BA, is demonstrated by the variation in the standard error of the log10 estimation of biomass, which in most cases decreased slightly when incorporated into the model.
Table 5 Multiple linear regression equations for estimate aboveground biomass as function of the basal area (cm2), specific wood density (Mg m-3) and the tree height (m) of the studied tree species.
| Species | β 0 | Regression coefficient of Y in the X (β 1i ) variables | SE | R 2 | F | ||
| Log 10 BA | Log 10 SWD | Log 10 h | |||||
| A. cochliacantha | -0.446** | 1.089*** | - | - | 0.302 | 0.889 | 192.0 |
| -0.669 ns | 1.180*** | -0.890 ns | - | 0.301 | 0.890 | 92.6 | |
| -0.756 ns | 1.087** | -0.277 ns | 0.379 ns | 0.290 | 0.893 | 61.2 | |
| C. multiflora | -1.476*** | 1.409*** | - | - | 0.033 | 0.989 | 557.4 |
| -0.835ns | 1.309*** | 1.115ns | - | 0.028 | 0.991 | 280.5 | |
| -1.089ns | 1.180* | 0.719ns | 0.424 ns | 0.026 | 0.992 | 160.5 | |
| E. schlechtendalii | -1.171** | 1.124*** | - | - | 0.183 | 0.826 | 42.8 |
| 7.444* | -0.690 ns | 14.560* | - | 0.075 | 0.928 | 51.9 | |
| 7.279* | -0.691 ns | 14.377* | 0.157 ns | 0.075 | 0.929 | 30.6 | |
| I. arborescens | -1.522** | 1.277*** | - | - | 0.136 | 0.942 | 97.0 |
| -3.418 ns | 1.573* | -2.437 ns | - | 0.129 | 0.945 | 42.7 | |
| -3.504 ns | 1.353 ns | -2.299 ns | 0.819 ns | 0.091 | 0.961 | 32.6 | |
| L. microphyllum | -0.679** | 1.189*** | - | - | 0.040 | 0.988 | 501.7 |
| 0.845 ns | 0.743 ns | 7.078 ns | - | 0.029 | 0.991 | 285.9 | |
| 1.086 ns | 0.237 ns | 10.628 ns | 1.239 ns | 0.015 | 0.996 | 303.5 | |
| All the species | -0.415* | 0.928*** | - | - | 5.938 | 0.647 | 108.1 |
| -0.306*** | 1.084*** | 1.666*** | - | 1.375 | 0.918 | 325.7 | |
| -0.836*** | 0.843*** | 1.291*** | 1.140*** | 0.814 | 0.952 | 373.8 | |
BA, basal area; SWD, specific wood density; h, tree height; β0 , estimated value of the intercept; β1i , estimated value of the slope; SE, standard error; F= statistical parameter F; R2, regression coefficient; ***Level of significance p< 0.001; **Level of significance p< 0.01; *Level of significance p< 0.05; ns, not significant.
Rejection of the null hypothesis occurred when comparing the homogeneity of the five species' regression parameters, for both: the models in which biomass was estimated from BA (F0 = 47.23; Ft = 1.60, p = 0.05) and in those that included BA and SWD (F0 = 5.42; Ft = 1.63, p = 0.05). Therefore, a single model cannot satisfactorily fit the database of the species involved in this study using the parameters described (Table 6).
Table 6 Multiple linear regression model and variance analysis for the Reduced Model that includes all tree species and the Complete Model with the group of equations of each specie.
| Variables | Model | SS of the residuals | FO | Ft | ||
| BA | Complete | 0.694 | 50 | 47.23 | > | 1.60 |
| Reduced | 5.938 | 58 | ||||
| BA + SWD | Complete | 0.562 | 45 | 5.42 | > | 1.63 |
| Reduced | 1.375 | 57 | ||||
| BA + SWD+ h | Complete | 0.497 | 40 | 1.59 | < | 1.66 |
| Reduced | 0.814 | 56 |
SS, Square sum; BA, basal area; SWD, specific wood density; h, tree height; df, degree of foredoom; F0 = estimated value of the statistic parameter F; Ft= F value from tables with the significance of p = 0.05.
However, in the model that included all the species studied, although BA was the variable that best explained variation in biomass, SWD and tree height (h) increased the prediction of biomass significantly and decreased the standard error (Table5). In this case, the contribution of the two additional variables was significant (p < 0.001) and fit satisfactorily (F0 = 1.59; Ft = 1.66, p = 0.05) (Table 6).
Discussion
The allometric model proposed for predicting the biomass of individual species growing in the Sierra de Huautla Biosphere, Morelos, México, and considered in this study, fitted resulting in high coefficient of determination values using only the variable diameter at breast height. The relationship was much more reliable for trees that branch above breast height. However, because of the variability in the growth pattern, tree architecture, and specific wood density, it was impossible to fit a single biomass estimation model using only the dbh. When formed groups of species with similar SWD, we achieved a model suitable for more than one species using this parameter.
Comparisons of the biomass equation for total aboveground biomass for the tropical seasonally dry forest of this study with other equations developed for other tropical dry forests, considering only dbh as the single predictor variable (Martínez-Yrízar et al., 1996; Brown, 1997; Návar, 2009), produced mixed results (Fig. 3).
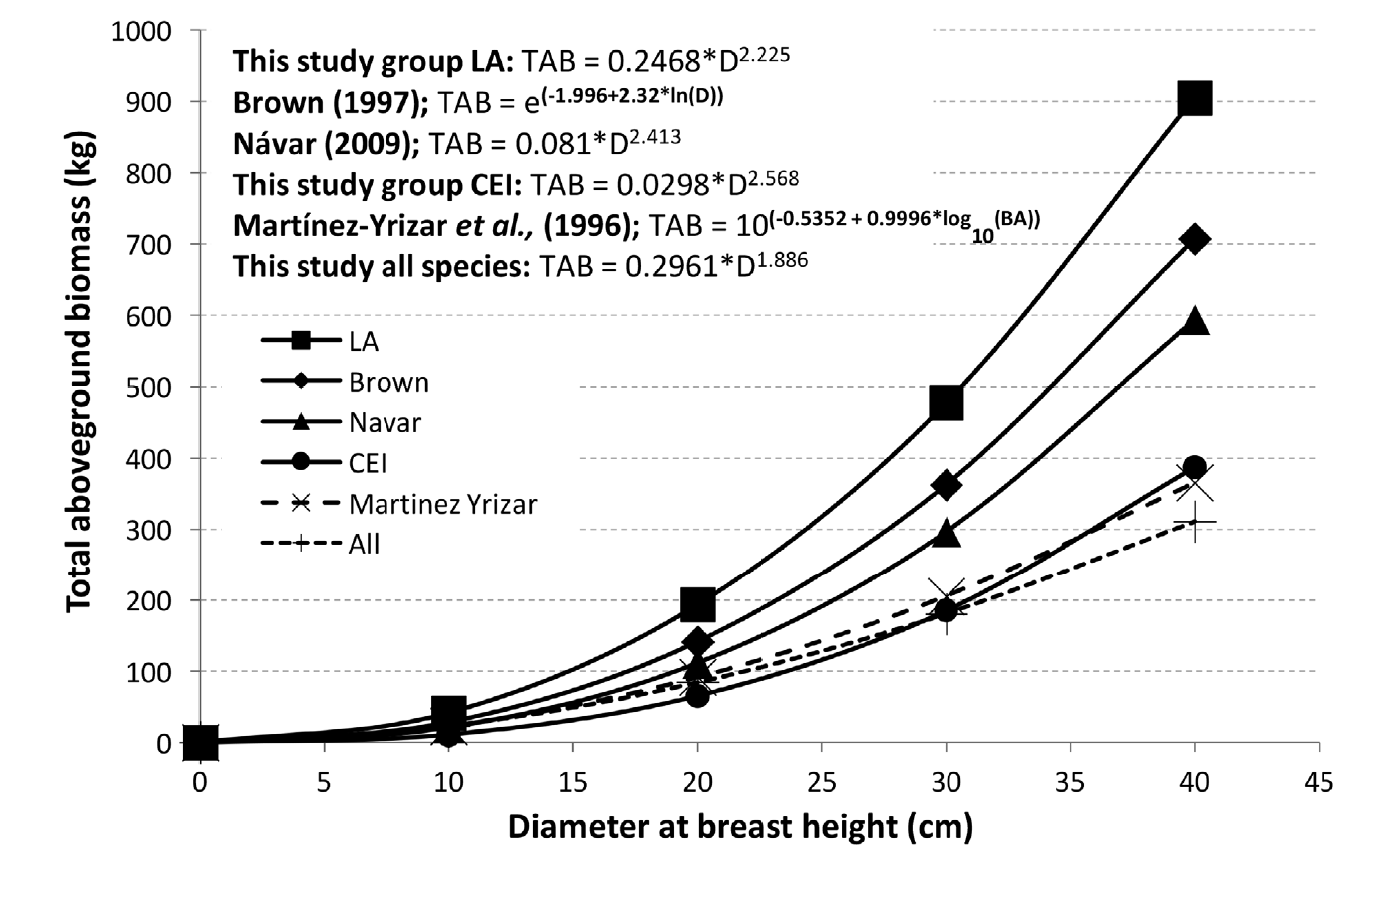
Figure 3 Comparison of equations developed to estimate aboveground biomass for tropical dry forests. (TAB, total aboveground biomass; D, diameter at breast height; BA, basal area).
The estimated aboveground biomass for each tree was similar up to a dbh of 10 cm employing the different equations analyzed. The algorithm for the group of trees studied in Sierra de Huautla, Morelos, having densities above 0.6 g cm-3, represented by the subgroup LA (L. microphyllum and A. cochliacantha), obtained the highest biomass per tree as the dbh increases. This data is consistent with results reported as part of a study conducted with pines and oaks in Durango and Chihuahua by Návar (2009). This researcher separated several species of pine with SWD values of 0.39 g cm-3 to 0.55 g cm-3 from other hardwoods (oaks) with SWD of 0.60 g cm-3 to 0.64 g cm-3 and explained that similar increases in dbh resulted in more significant gains in biomass in the species with higher SWD (oaks). The aboveground biomass estimated with the equation developed by Brown (1997) for data collected from TDF worldwide were similar the one reported by Návar (2009) for TDF from eastern Sinaloa, however with higher values, than those reported by Martínez-Yrizar et al. (1996) for a TDF of Chamela, Jalisco, Mexico, as dbh increases. However, the biomass values estimated with the model for all the species of the present study and group CEI with SWD of 0.3 g cm-3 to 0.5 g cm-3, represented by C. multiflora, E. schlechtendalii and I. arborescens was similar. Our results suggest that for selecting the most suitable model, we need to determine SWD and certain characteristics associated with the conditions of the environment where there are dominant species of TDF (Chave et al, 2005, Fehrmann, & Kleinn, 2006). Brandeis and Suárez (2005) recommended using the equation developed by Martínez-Yrizar et al (1996) to estimate biomass in TDF of the Caribbean zone with < 900 mm/year rainfall, and in areas with higher precipitation, their recommendation was to consider the equation developed by Brown’s (1997).
There are published equations that relate the trees dbh, SWD, and their height to predict the biomass of TDF. These relationships developed for several situations refer to species, mixed composition forests, specific sites, biogeographical regions, and climate-related biomes (Martínez-Yrízar et al, 1996; Chave et al, 2005; Návar, 2009; Gomez, Etchevers, Monterroso, Campo, & Tinoco, 2011; Návar, 2014). In the present study, the multiple linear regression equations for the species treated individually and for which BA, SWD, and tree height were jointly used, revealed that biomass estimation was explained significantly by basal area. Only in the joint model for all species, specific wood density, and tree height increased precision, relative to the individual models. The same model had a significant fit, permitting biomass estimation of TDF species for a group.
Comparing biomass equations for total aboveground biomass for the tropical dry forest of this study with other equations developed for other tropical dry forests and considering dbh, SWD and height (Chave et al, 2005; Martínez-Yrízar et al, 1996) produced also mixed results (Fig. 4).
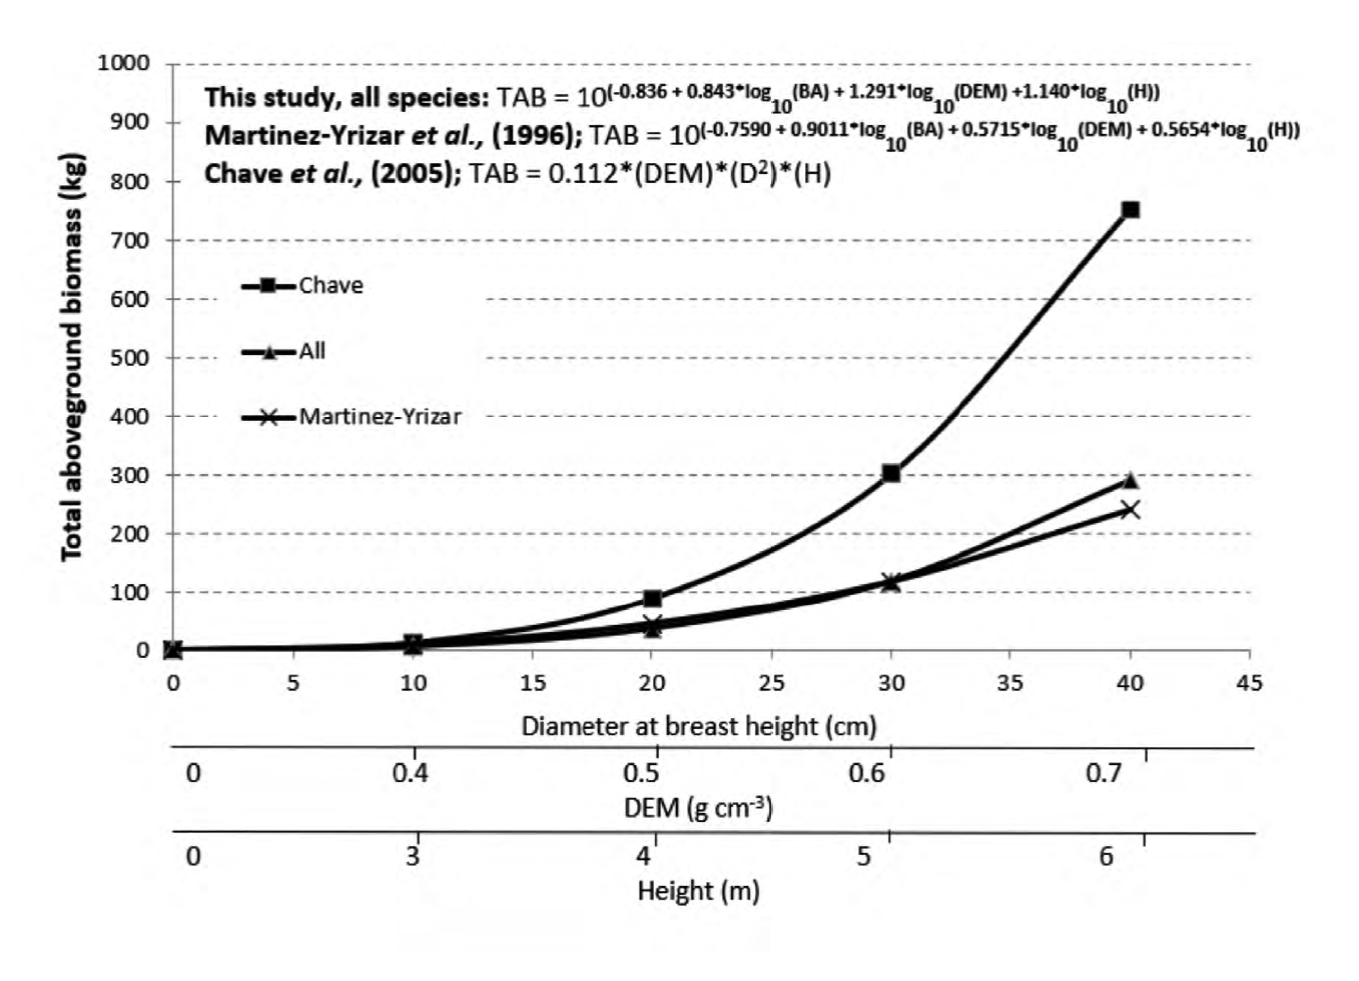
Figure 4 Comparison of multiple linear regression equations developed for estimating aboveground biomass for tropical dry forest.
Aboveground biomass estimated with our model gives similar results than estimations produced with the Martínez-Yrizar et al (1996) model developed for a TDF of the coastal region of Jalisco, Mexico. However, biomass estimates resulted in being significantly inferior to the values obtained with the model generated by Chave et al. (2005) for a TDF of Australia, Brazil, French Guiana, Guadeloupe, India, Indonesia, Malaysia, Mexico, and Venezuela.
The SWD varies in function of tree age, site productivity, and individual structure of the species, all of which generate imprecision in biomass estimations (Acosta et al, 2002). Precise height measurements are complicated to obtain and are rarely available in forest inventories. Given that aboveground biomass correlates well with dbh, several authors have suggested that height not be included in estimations of biomass (Chave et al, 2005; Nogueira et al, 2008).
Conclusions
The allometric model proposed for predicting the biomass of each species growing in the Sierra de Huautla Biosphere Reserve, Morelos, Mexico, and considered in this study was fitted resulting in high coefficient of determination values using only the variable diameter at breast height. The relationship was much stronger for trees that branch above breast height. However, because of the variability in the growth pattern, tree architecture and specific wood density, it was not possible to fit a single biomass estimation model using dbh, but when the species were grouped by similarity in specific wood density, a significant fit of the model was achieved for more than one species, specifically those that had high values for this parameter.

