


 nueva página del texto (beta)
 Inglés (pdf)
 Artículo en XML
 Referencias del artículo
 Enviar artículo por email
 Citado por SciELO
  Similares en
SciELO
Similares en
SciELO 
 Permalink
Introduction
Biomass and carbon are key factors in estimating the contribution of forest ecosystems to the carbon cycle (Picard, Saint-André, & Henry, 2012). Allometric equations used to predict biomass and carbon within a tree from easily measured dendrometric characteristics, such as tree diameter or height, are very common (Dickinson & Zenner, 2010). Once developed, they have the benefit of providing an expeditious method for estimating biomass-carbon content, avoiding the need for costly destructive sampling. Canga, Dieguez-Aranda, Afif-Khouri, and Camara-Obregon (2013) stated that the first studies to estimate biomass productivity of several species are those conducted by Burger (1945, 1953) on Larix decidua and Picea abies. These authors point out that later research focused on the allocation of dry weight among tree components. Navar (2014) classifies aboveground allometric biomass equations according to the spatial scale from which trees are harvested: (1) local, site-specific equations focused on a single species within a small area, (2) general non-site-specific equations developed for single species but not limited by geographical boundaries, and (3) regional equations that encompass all tree species within an ecosystem.
Allometric equations have been developed for tree species all over the globe. Extensive reviews of such equations exist for Canada (Lambert, Ung, & Raulier, 2005), North America (Jenkins, Chojnacky, Heath, & Birdsey, 2003; Chojnacky, Heath, & Jenkins, 2014), Europe (Zianis, Muukkonen, Mäkipääand, & Mencuccini, 2005), Eurasia (Somogyi et al., 2008), and Latin America (Navar, 2009). Chaturvedi and Raghubanshi (2015), however, point out that errors occur when researchers apply allometric equations beyond areas from which they are developed, as different edaphic and environmental conditions, stand structure, species composition, and other key factors may prevail. Furthermore, different tree species have different architecture and average wood density; consequently, it would be desirable to develop allometric equations that are species-specific, reducing the uncertainty due to species variation. According to Brown, Sathaye, Cannell, and Kauppi (1997), “biomass estimates for forests of tropical countries, in particular, are needed because globally they are undergoing the greatest rates of change and reliable biomass estimates are few”. Tropical forests have the highest potential for CO2mitigation given that they are conserved and properly managed (Brown et al., 1996).
The relevance of forests as carbon (C) sinks is directly related to their biomass content (Intergovernmental Panel on Climate Change [IPCC], 2003). As with biomass, research studies on C content in trees have been broadly conducted. Thomas and Martin (2012) assessed and summarized research efforts concerning carbon content in tropical trees and found only a small number of studies have incorporated species-specific carbon fractions when assessing forest carbon. In addition, these authors emphasize that the assumption that biomass consists of 50% carbon on a mass/mass basis is a matter of concern. Recent studies indicate errors close to 5% in forest carbon stocks estimates when carbon fraction is assumed to be 50%. Conifers tend to have significantly higher wood C content than angiosperms. Gifford (1994) estimated C content to be 50.5% of tree biomass for species of eucalyptus vs 54.1% for Pinus Radiata. Lamlom and Savidge (2003) reported a C content of 51.5% in conifers against 48.4% in angiosperms, while Thomas and Malczewski (2007) reported 50.9% vs 49.6% in conifers and angiosperms, respectively. Lamlom and Savidge (2003) asserted that larger C content for conifers might be due to higher lignin content, with approximate values around 30% compared to 20% in conifers vs angiosperms, respectively. Absence of reliable data regarding carbon concentration of tropical forest species based on chemical analyses has been considered a breach on relevant information that needs to be filled (Elias & Potvin 2003; IPCC 2006). Since then, more species-specific wood carbon data from an array of forest types have become available, reducing the error associated with estimated carbon sequestration.
Endemic Pinus species of the Caribbean islands include P. caribaea Morelet var. caribaea, P. caribaea Morelet var.bahamensis, P. tropicalis Morelet, P. cubensis Grisebach, P. maestrensis Bisse (not officially recognized) and P. occidentalis Swartz. Accurate biomass and carbon content estimates for these species are limited. No studies regarding carbon content or tree allometry were found for either P. caribaea var. bahamensis or P. occidentalis, Sw. In terms of carbon content, tropical conifers have been subject of few species-specific research reports. We found three records for P. caribaea (Arias, Calvo-Alvarado, Richter, & Dohrenbuschc, 2011; Rojas, 2014; Duca de Lima, Barreto-Garcia, Sanquetta, Brito de Novaes, & Clímaco de Melo, 2016), and one for P. oocarpa (Alberto & Elvir, 2008). Martin and Thomas (2011) point out that no major efforts have been placed to accurately convert tropical aboveground biomass to standing carbon stocks. Regarding biomass allometry, twenty-two studies were found for the Caribbean pines (Lugo, 1992; Vidal et al., 2002; Blanco & Gonzáles 2010; Sandín-López, González-Izquierdo, & Barrero-Medel, 2013; Toirac-Argüelle, Bravo-Iglesias, Barrero-Medel, Vidal-Corona, & Ajete-Hernández, 2015; Barrero-Medel et al., 2015; Alarcón-Martínez, Toirac-Arguelle, Bravo-Iglesias, Barrero-Medel, & Aguilera-Torres, 2016; Márquez-Montesino, Cordero-Alcántara, Rodríguez-Mirasol, & Rodríguez-Jiménez, 2001; Vidal-Corona, Rodriguez, Benitez-Naranjo, Alvarez-Rivera, & Rios, 2002; Viquillón-Grecesqui et al., 2016).
Pinus occidentalis is the only softwood species allowed to be managed at great scale in the Dominican Republic. Because it is the main commercial species and its distribution is coincidentally located in the most critical watersheds for the region, P. occidentalis management has a considerable effect on the quality of life of the inhabitants of this country. In addition to them being a source of softwood timber, the pine forests also perform many important ecosystem services, including carbon sequestration. In 2012, P. occidentalis Sw. forests occupied an area of approximately 331 557 hectares (ha) within the Dominican Republic, representing 17.52% of forestland and 6.87% of total land base (Bueno-López & Bevilacqua, 2010). Within the study area, this species occupies approximately 34 937 ha, 10% of this area in pure stands (Bueno-López, 2009).
Objectives
The objectives of the study were two-fold. First, develop site-specific allometric models for P. occidentalis total aboveground dry biomass (BT) using diameter at breast height (DBH, 1.30 m) and total tree height (H) as predictor variables, individually and in combination. Model development will employ both linear and nonlinear regression techniques and two fitting methods for each: Weighted Least Squares (WLS) and Maximum Likelihood with variance modeling. Second, assess the variation in carbon concentration among stem plus bark, branches, and foliage by means of chemical analyses to quantify the potential of the species for carbon storage.
Specifically we present: (1) site-specific allometric models developed to estimate BT for naturally occurring P. occidentalis trees, (2) select the best model to predict BT based on goodness-of-fit statistics following 100% cross validation, (3) measure and assess variation in percent C among stem plus bark, branches and foliage, and (4) estimate total C stored on individual trees. To our knowledge, we provide the first published allometric equations and reported C content in different tissues for P. occidentalis.
Materials and Methods
Site description
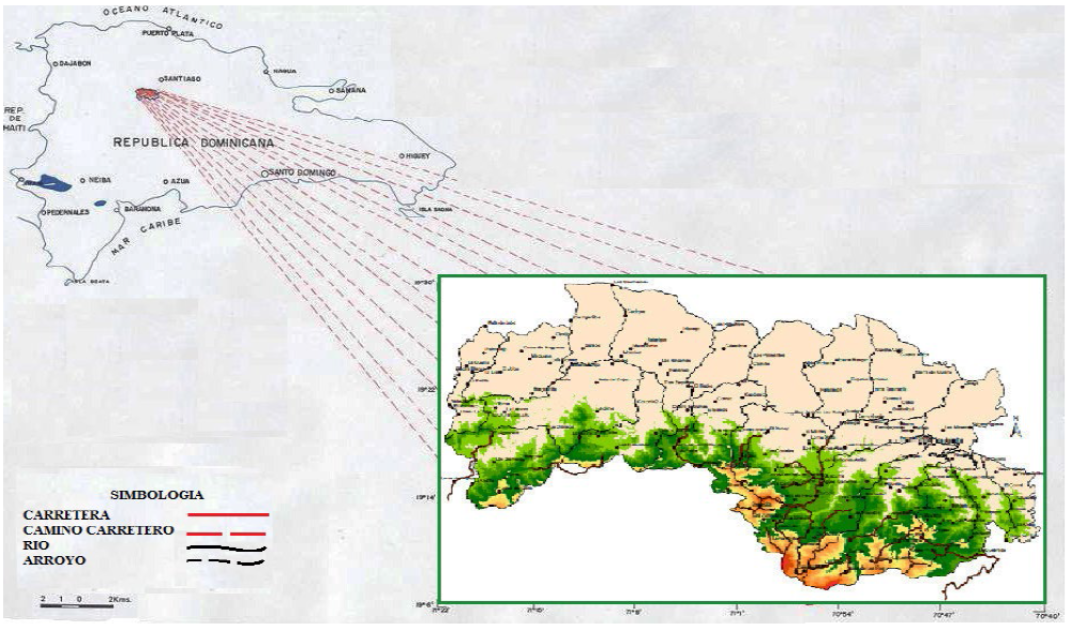
The study was conducted in Santiago de los Caballeros Province, an effective area of 448 km2 (19º 10’ - 19º 20’ N; 70º 45’ - 71º 05’ W), within the northcentral portion of Cordillera Central, Dominican Republic, in a region known as La Sierra (Fig. 1). La Sierra itself encompasses an area of 1800 km2. Its climate varies depending on the altitude (from low montane to montane) and precipitation (from wet to very wet). Elevations above sea level range between 500 and 1600 m. Although irregular, rains manage to maintain a certain level of moisture in the soil for a large part of the year. Average precipitation ranges from 800 mm to 1600 mm annually; average annual temperature is around 24 ºC (Bueno-López, 2009). The pine forests on these higher elevation slopes usually develop in shallow, carbonate, lateritic, low-producing soils, located primarily on land with rugged topography being this area more than 90% mountainous with slopes varying from 0% to 70%. Soils have a sandy texture although higher proportions of clay and silt can be observed in some places. They are usually well-drained, and where the surface is well protected with vegetation, fertility increases (Bueno, 2009).
Sampling and analytical procedures
Selection of stands for plot installation involved placing a 2 km × 2 km grid on each of seven 1:20 000 scale maps, each map representing an area of 64 km2 developed using SPOT panchromatic satellite images from 1991. The sampling frame for selecting stands included 120 non-overlapping pairs of grid central coordinates. From these, 24 central coordinates were randomly selected and undisturbed stands closest to each grid center that were unburned, reasonably free of wildlings, and free of apparent damage from insects and/or fungi were chosen as sampling units. Twenty-four temporary circular plots (350 m2), one in the approximate center within each stand, were established, encompassing different stand densities to represent the whole study area. In each plot, all trees were identified and measured for diameter at breast height at 1.30 m above ground (DBH, cm) and total height (H, m). Quadratic mean diameter (QMD, cm), density (trees/ha) and basal area per hectare (BA, m2/ha) were computed. Two trees per plot were selected, and a total forty-eight trees from dominant, codominant and intermediate classes were destructively sampled to measure biomass and C content of three components; stem plus bark, branch and foliage.
Trees were felled as close as possible to the ground (~10 cm). After felling, total tree height was measured to the nearest centimeter. Diameters to the nearest 0.5 cm and bark thickness to nearest cm were measured at stump and every two meters up the stem to a minimum top diameter of 4 cm. To partition each tree into component parts, branches were cut at their intersection with the main stem and foliage twigs with at most 1 cm diameter were separated from them. The main stem was cut into 2 m logs up to 4 cm minimum top diameter. Green weight of each component was determined in the field using heavy duty scales. Sawdust weight from main stem cuttings was also recorded and, added to its weight.
Subsamples from the main stem plus bark involved cutting 5 cm thick disks at stump height, 0.5 relative height, and 0.8 relative height. Subsamples from branches in the lower, middle and, upper portions of the canopy were also taken using 5 cm disks. Subsamples from foliage were taken from the lower, middle and upper portions of the canopy. All tissues from this subsampling stage were weighted in the field for green weight determination using high precision balances. For biomass determination, all sampled tissues were encoded, placed in Ziploc bags, and transported to the lab for further processing.
In the lab, samples were oven-dried at 105 ºC until constant weight was acquired. After drying, dry weight was measured, and dry weight / green weight ratio of components determined. Total dry biomass of each component (stem plus bark, branches, and foliage) was computed using
where:
Bi = total dry biomass of component i
BGi = total green weight of component i
Si = sample dry weight of component i
SGi = sample green weight of component i
Summary statistics for variables from temporary plots and sample trees are shown in Table 1.
Table 1 Summary statistics of plot and sample tree characteristics for P. occidentalis in La Sierra, Dominican Republic.
| Variables | Min | Max | Mean | Std.Dev. | |
| Temporary Plots (n=24) | Density (trees/ha) | 86 | 1371 | 344 | 233 |
| DBH (cm) | 16.79 | 36.33 | 25.02 | 4.64 | |
| H (m) | 13.30 | 29.01 | 18.87 | 3.40 | |
| QMD (cm) | 17.39 | 36.34 | 26.04 | 4.73 | |
| BA (m2/ha) | 5.99 | 38.7 | 15.16 | 7.75 | |
| Sample Trees (n = 48) | DBH (cm) | 12.00 | 44.00 | 25.73 | 7.04 |
| H (m) | 13.00 | 29.6 | 20.13 | 4.03 | |
| BS (kg) | 31 | 905 | 286 | 185 | |
| BB (kg) | 2 | 307 | 49 | 51 | |
| BF (kg) | 6 | 132 | 42 | 31 | |
| BT (kg) | 40 | 1345 | 377 | 252 |
DBH = Diameter at breast height measured outside bark, H = Total tree height; QMD = Quadratic mean diameter, BA = Basal area of the stand, BS = Stem plus bark dry biomass, BB = Branch dry biomass, BF = Foliage dry biomass, BT = Total aboveground dry biomass, Min = Minimum; Max = Maximum, Std.Dev. = Standard deviation.
Graphic exploration of the data
As a first step in developing our models, we visually assessed the relations between our dependent variable, total above ground dry biomass (BT); and predictor variables, DBH, H, and D2H, to be able to specify the mean relation and form of the error between these variables. We proceeded to plot coordinate points as a cluster to determine the nature of the mean relation and the form of the variance. If we found that the residuals were not constant (heteroscedasticity), we would adopt a power model to link the variance of the residuals to the effect variable included in the model.
Model fitting
Five different types of models were fitted to establish the relationship between BT and predictor variables. For each type, two fitting methods, Weighted Least Squares (linear (WLLS) and non-linear (WNLLS)) and Maximum Likelihood, and two variance forms were assessed. Table 2 shows the combination of model types, variance forms, and fitting methods along with the model reference number in the study. Diameter was measured in centimeters and total height in meters.
Table 2 Combination of model types, variance forms and fitting methods along with the model reference employed to assess the relationship of aboveground dry biomass and effect variables of P. occidentalis trees in La Sierra, Dominican Republic.
| Model Number | Model | Variance Form | Fitting Method |
| 1 |
|
|
WLLS1 |
| 2 |
|
|
WLLS |
| 3 |
|
|
WNLLS2 |
| 4 |
|
|
WNLLS |
| 5 |
|
|
WNLLS |
| 6 |
|
|
M. Likelihood3 |
| 7 |
|
|
M. Likelihood |
| 8 |
|
|
M. Likelihood |
| 9 |
|
|
M. Likelihood |
| 10 |
|
|
M. Likelihood |
1. Weighted Linear Least Squares, 2. Weighted Non-Linear Least Squares, 3. Maximum Likelihood.
Weighted regression models
Models 1, 2, 3, 4, and 5 were fitted by applying WLLS and WNLLS methods, aiming to stabilize the variance of the residuals assuming that each observation has its own variance, which is inversely proportional to the common residual variance. In equation form, this relationship can be depicted as follows:
where
Picard et al., (2012) also suggested that
the exponent
Linear and Non-linear models with a modeled variance
For models 6, 7, 8, 9, and 10 we explicitly modeled the variance of the residuals, assuming again that the residual standard deviation of the observations is a power function of effect variable DBH, such that:
Coefficients
Checking hypotheses
We proceeded to produce quantile-quantile plots to visually verify that the residuals followed a normal distribution. The constant variance hypothesis of the residuals was assessed by visual inspection of scatter plots relating the residuals as a function of the predicted values, specifically making sure that the cluster of points would not show any particular trends in their structure.
Best model selection
Models developed were quantitatively evaluated by means of “100 Fold” cross validation (Efron & Tibshirani, 1993). The distribution, bias, and precision of residuals was assessed to determine the accuracy of estimations (Vanclay, 1994). The residuals were computed by subtracting the predicted from the observed aboveground total dry biomass values. Relative root mean square error (as percentage of average observed values) (RMSE%), relative bias (B%), mean absolute deviation (MAD), and coefficient of determination (R2) were calculated as follows:
where n = number of observations in the validation dataset
m = number of 𝛽 𝑖
parameters excluding
Ranking
To select the best model for total aboveground dry biomass estimation, we ranked the models based on four evaluation criteria (RMSE%, B%, MAD and R2). We assigned an independent score to each of these statistics based on its absolute magnitude. The lower the magnitude, the higher the rank. We then summed the assigned ranks and selected the one having the lowest score as the best model.
Carbon content
To estimate carbon content in the main stem, subsamples at each of three heights in three positions (heartwood, middle portion of sapwood, and outer portion of sapwood including bark) along the stem were pooled together after grounding. Subsamples from each of the three positions within the canopy of branches and foliage within the crown were pooled together after grounding for carbon content determination in each of these tissues. To obtain the carbon fraction (C), weights of approximately 50 mg from each of these components were placed on a Rapid CS cube (manufactured by Elementar Analysensysteme GmbH), which converts carbon compounds by oxidation at 950 °C into carbon dioxide (CO2) which is measured via infrared (IR) detection.
Assessment of carbon content variation among tissues and its relationship with specific density
Analysis of Variance (ANOVA) was carried out to assess carbon content variation among stem wood, specifically, the outer portion of stem sapwood including the bark, foliage and branches. Within the stem itself carbon content variation between the pith, middle portion of sapwood and outer portion of sapwood including the bark at three different heights, was also examined by means of Two-Factor ANOVA. Also examined by Correlation Analysis was the relationship between C fraction and wood density.
Results
Mean total dry biomass in the main stem including bark, branches and foliage represent 76%, 13% and 11% of the mean total aboveground dry biomass, respectively, of individual P. occidentalis trees in our study (Table 1).
Graphic exploration of the data
The results of the graphic exploration of biomass against the effect variables DBH, DBH 2 and, DBH 2 H are shown as scatter plots in Figure 2. The relationship between biomass and DBH (left panel) is not linear, and the variance of the biomass increases with DBH. Between biomass and DBH 2 , the pattern is linear (central panel), but the variance of the biomass increases with DBH 2 . The association between biomass and DBH 2 H (right panel) is also linear, but again, the variance of the biomass increases with DBH2H.

Weighted regression models
To stabilize the residual variance shown in our exploratory analysis of biomass
against the effect variables assessed in the study, we employed as previously
stated, weighted linear (WLLS) and non-linear (WNLLS) regression models as well
as linear and non-linear models with a modeled variance. For the application of
the weighed regression, we estimated coefficient

Figure 3 Plot showing the relationship between the standard deviation of the biomass against the log of the median DBH for each of five DBH classes in logarithmic scale
The points are approximately aligned along a straight line confirming that the
power model is appropriate for modeling the residual variance. The resulting
equation has a residual standard error = 0.233 on 4 degrees of freedom,
coefficient of determination = 0.929, and P-Value = 0.008. The slope of the
regression is 1.953, which is our corresponding
Best model selection
After performing “100 Fold” cross-validation, we proceeded to compute goodness-of-fit statistics from the 10 models predicting BT. Once these statistics were computed, we assigned ranked points to each model based on absolute values of four of these statistics: RMSE% model 14, BIAS% model 15, MAD model 16 and R2 model 17. Ranks of RMSE%, BIAS%, MAD and R2 were summed and lowest summed rank score represented the best model (Table 3).
Table 3 Goodness-of-fit statistics and rank scores from cross-validation analysis for each model evaluated for predicting total aboveground biomass in P. occidentalis. Value in parentheses represents model rank within column.
| Model | RMSE (%) | BIAS (%) | MAD | R2 | Cumulative Rank Score | |||||
| 6 | 6.173 | (1) | 0.481 | (9) | 0.046 | (1) | 0.947 | (1) | 12 | (1) |
| 1 | 6.229 | (2) | 0.439 | (7) | 0.046 | (2) | 0.946 | (2) | 13 | (2) |
| 4 | 6.297 | (3) | 0.404 | (4) | 0.046 | (3) | 0.945 | (3) | 13 | (2) |
| 5 | 6.369 | (5) | 0.043 | (2) | 0.047 | (5) | 0.944 | (5) | 17 | (4) |
| 9 | 6.305 | (4) | 0.477 | (8) | 0.046 | (4) | 0.945 | (3) | 19 | (5) |
| 10 | 6.431 | (6) | 0.063 | (3) | 0.047 | (6) | 0.943 | (6) | 21 | (6) |
| 3 | 9.554 | (7) | 0.024 | (1) | 0.066 | (7) | 0.873 | (7) | 22 | (7) |
| 2 | 9.869 | (8) | 0.407 | (5) | 0.069 | (8) | 0.865 | (8) | 29 | (8) |
| 8 | 9.957 | (10) | 0.430 | (6) | 0.070 | (10) | 0.862 | (10) | 36 | (9) |
| 7 | 9.937 | (9) | 0.726 | (10) | 0.069 | (9) | 0.863 | (9) | 37 | (10) |
RMSE=Root mean squared error, MAD= Mean absolute deviation, R2= coefficient of determination.
Based on ranked goodness-of-fit scores, the best model to predict total aboveground dry biomass of P. occidentalis is model 6 followed closely by models 1 and 4. Each of these three models incorporates DBH 2 H as the predictor variable. Table 4 shows the parameter estimates and their corresponding standard errors for models 1, 4 and 6, along with t statistic and P-Values. Total aboveground dry biomass predictions for P. occidentalis by models 1, 4, 6, and 9 are depicted graphically as follows (Fig. 4).
Table 4 Parameter estimates for three best models, associated approximate standard errors and summary statistics.
| Model | Parameter | Estimate | Std. Error | t value | P-Value |
Exponent
|
| 1 | Intercept | 5.843e-04 | 6.748e-03 | 0.087 | 0.931 | -- |
| DBH2H | 2.472e-05 | 5.591e-07 | 44.22 | < 0.0001 | -- | |
| 4 | Intercept | 2.327e-05 | 7.721e-06 | 3.015 | 0.0004 | -- |
| DBH2H | 1.006e+00 | 3.445e-02 | 29.212 | < 0.0001 | -- | |
| 6 | Intercept | 1.150e-03 | 6.122e-03 | 0.188 | 0.852 | 2.177 |
| DBH2H | 2.469e-05 | 5.625e-07 | 43.896 | < 0.001 |
Std. Error=Standard Error

The predictions made by models 1, 4, and 6, which were fitted with this effect variable, are shown in Figure 5.

Hypotheses assessment for WLLS and WNLLS regression models
Figure 5 depicts, from left to right, the graph of the weighted residuals against the fitted values above the quantile-quantile (Q-Q) plots for models 1 through 5, respectively. These residual plots do not show any trend. There is a little bit of structure in the residual and Q-Q plots but nothing of major concern.
Linear and Non-linear models with a modeled variance
To explicitly model the variance of the residuals, we assumed that the residual
standard deviation is a power function of the effect variable DBH as depicted in
equation 13. The coefficients
Carbon content
We determined the carbon fraction on the stem including bark, branches, and foliage of individual P. occidentalis trees, through samples collected from 48 harvested trees. In total, 384, 48 and 48 randomly selected subsamples from each of above tissues, respectively, were analyzed. Table 5 shows summary statistics of carbon fraction (%) and content (kg) among tree components.
Table 5 Carbon fraction (%) and content (weight) by tree component and total for 48 P. occidentalis trees in La Sierra, Dominican Republic.
| Aboveground Dry Biomass (kg) | Carbon Content1 (%) | Carbon Content (kg) | |||||||||
| Statistic | Br | Fol | S+B | Tree | Br | Fol | S+B | Br | Fol | S+B | Tree |
| Mean | 44.45 | 38.10 | 259.45 | 342.01 | 46.37 | 49.80 | 45.96 | 20.87 | 19.05 | 117.03 | 156.94 |
| Min. | 1.81 | 5.44 | 28.12 | 36.29 | 44.56 | 41.46 | 43.80 | 0.91 | 2.72 | 12.70 | 16.33 |
| Max. | 278.51 | 119.75 | 821.00 | 1220.1 | 51.88 | 58.58 | 49.09 | 127.91 | 68.95 | 372.85 | 568.80 |
| Std.D. | 47.17 | 28.12 | 165.11 | 228.61 | 1.17 | 3.38 | 1.41 | 21.77 | 14.51 | 77.11 | 107.05 |
Br: Branches; Fol: Foliage, S+B: Stem plus bark. Carbon content = Bi*C%i, where Bi = biomass of component i, C%i = carbon fraction of component i. Min = Minimum, Max = Maximum, Std.D. = Standar deviation.
Significant differences in C% (by means of chemical analyses) among tree components were observed (P-value < 0.0001). Carbon concentrations were found to be lowest in the stem (42.059% ± 1.008% [95% C.I.]), followed by branches (46.355% ± 0.3385% [95% C.I.]), and foliage (49.80% ± 1.953% [95% C.I.]).
Wood C content within the stem varied significantly radially (P-value < 0.0001) with C concentrations from the pith (45.355% ± 2.157% [95% C.I.]) being statistically different to C content in the sapwood (40.988% ± 0.823% [95% C.I.]) and bark (39.659% ± 1.387% [95% C.I.]) at same stem heights. Results showed weak or no correlation between C fraction in any of the tissues and wood density, which was additionally estimated for each of the subsamples. Overall, if assuming general C fractions of 0.50, C stocks of this species would be overestimated by, on average, 13.25% in individual trees.
Discussion
To date, there are no equations published for endemic P. occidentalis species, nor were we able to find any reported estimates of carbon content for aboveground tree components. This prompted the current study. The validity of the equations generated in this study should be restricted to the range of variation of the dimensions of the trees included in the sample and the geographical area. Extrapolation can only be made to the same species in other sites or regions provided they present similar growth characteristics. We argue that biomass allometry is not simple (i.e., can be modeled by a power model) but rather complex due to the inherent heteroscedasticity in this type of data.
To correct this problem, a common approach taken when developing predictive equations is to convert non-linear relationships into linear equations by taking the natural logarithm of both sides with an additive error term (Moore, 2010). The log transformation resolves the heteroscedasticity problem but affects the mean relation and the form of the error term. The error in the log-transformed data is additive and follows a centered normal distribution of constant standard deviation. If we use exponential transformation to return to the original data, the residual error becomes a multiplicative factor (Picard et al., 2012). Bias arises from logarithmic back transformations and correction factors need to be applied. Although least squares estimates of parameters remain unbiased and consistent, they are inefficient, and therefore, their standard errors are incorrect and usual significance test cannot be applied (Canga et al., 2013). Packard and Boardman (2008) have questioned the appropriateness of log-linear regression and proposed that a nonlinear least-squares method (nonlinear regression) be used for developing allometric equations when variables related to biological phenomena are studied (Packard and Birchard 2008). For this reason, different approaches to stabilize the residual variance, namely employing WLS and ML techniques, are employed.
Aerial biomass in tree components
Mean dry-weight of biomass in main stem including bark, branches and foliage represent 74.5%, 13.3% and 12.1% of the mean total aboveground biomass, respectively. Individual trees had an average aboveground dry weight of 377 kg. With an estimated average 657 trees per ha at an average age of approximately 30 years (Bueno-López, 2009), total aboveground dry biomass is approximately 247.69 Mg ha-1. In a similar site for another close relative, P. caribaea (695 trees per hectare, 25 years), Ambagahaduwa, Prasad, Gunatilleke, Seneviratne, and Gunatilleke, (2009) estimated mean aboveground biomass at 194 Mg ha-1. These authors also report that biomass distribution among main stem including bark, branches, and foliage was 60%, 17%, and 13%, respectively. Subasinghe and Munasinghe (2011) found that the average aboveground biomass on individual trees of a 27-year-old P. caribaea plantation was 369 kg.
Allometric models
P. occidentalis stem allometry for constructing volume and taper equations have been studied before (Bueno-López and Bevilacqua, 2010; Bueno-López and Bevilacqua, 2012) but not to establish biomass relations. In contrast to the approach used in this study, most reported biomass equations for Caribbean region pine included bias in biomass estimation introduced using log transformation. Goodness-of-fit statistics for our models (n = 48, RMSE% = 6.17-9.96, BIAS% = 0.024-0.726, MAD = 0.05-0.07, R2 = 0.86-0.95) show that total aboveground dry biomass predictions are generally good. Overall, models using DBH2H as the only predictor variable performed best based on goodness-of-fit statistics from cross-validation data.
Weighted and variance component models
Based on our ranking, model 6, fitted by modeling the variance of the residuals by Maximum Likelihood performed best, followed closely by models 1 fitted by WLLS and 4 fitted by WNLLS. Variance component models differed from the weighted regression models because the coefficients for weighing were parameters that needed to be estimated, and the least squares method could no longer be used to estimate model coefficients.
Model similarities
If we were to compare the predictions of total aboveground biomass made by these two techniques, WLS and ML, few differences between them could be discerned (Fig. 5). In fact, except for the intercept, the coefficients are very similar. Parameter coefficients for matching pairs of models - i.e., 1 and 6, 2 and 7, 3 and 8, 4 and 9, and 5 and 10 - are very close in their magnitude.
Carbon fraction among tree components
Carbon concentrations for P. occidentalis were found to be lowest in the stem and highest in needles (Table 5). Within the stem, wood C content varied significantly radially (P_Value < 0.0001) with C concentrations from the pith being greater and statistically different to C content in sapwood and bark at same stem height. We explored the possibility of developing separate equations to predict total carbon in individual trees and determined that it would be possible to accomplish these predictions from explanatory variables such as DBH and total tree height (R2 = 0.83 and 𝜎=0.049). Overall, assuming that the generic C fraction is 0.50, it would lead to an overestimation of C stocks by 13.25% for this species.
Model predictions are very similar for WLS and ML models, especially for those having as DBH2H as the predictor variable (Fig. 5). Therefore, we conclude that regardless of the fitting method, aboveground dry biomass allometric equations using DBH2H as the predictor variable are the best for this species. Among the three statistical techniques used to fit BT prediction models - namely weighted linear (WLLS) and non-linear (WNLLS) least squares as well as maximum likelihood with a modeled variance (ML), model 6 was the best, which was fitted by modeling the variance component and applying the Maximum Likelihood method. This selection was based on a ranking of four goodness-of-fit statistics, evaluated after performing 100-fold cross validation.
On average, each individual tree is storing 175 kg of carbon in the aboveground biomass components. Significant differences in the three tissues were obtained from an analysis of variance (P-value < 0.0001). Overall, assuming generic C fractions of 0.50, C stocks of this species would be overestimated on average by 13.25% in each individual tree. If we apply the conversion factor of C to CO2 equivalent units (3.67), at this point of time, the amount of CO2 equivalent per hectare stored in these P. occidentalis stands is 421.96 Mg. In our country, we do not have information regarding specific carbon concentration in forest trees. We consider that reporting C fraction for this tropical species, will significantly contribute to improve local estimates of terrestrial C stocks.

