


 nueva página del texto (beta)
 Inglés (pdf)
 Artículo en XML
 Referencias del artículo
 Enviar artículo por email
 Citado por SciELO
  Similares en
SciELO
Similares en
SciELO 
 Permalink
Introduction
The Chaco region is a vast alluvial plain that occupies about 106 million hectares of South America, between north Argentina, west Paraguay, southeast Bolivia and a narrow strip in southwest Brazil. This region is naturally covered by a variety of plant physiognomies, such as thorny semi-deciduous forests, thorn dry forests, open forests, savannas, savannas with palm trees, and pastures (Morello & Adámoli, 1974; Prado, 1993). Currently, the region is one of the deforestation hotspots in the world (Hansen et al., 2013). In the Argentine Chaco, about 4 million hectares of forest were lost between 2002 and 2010 (Piquer-Rodríguez et al., 2015) because they were transformed into croplands or pastures.
The other productive activities carried out in the region, which are less intense but persistent, also have different effects on the forest structure. These include ranching (Trigo et al., 2017), selective logging (Tálamo, López de Casenave, & Caziani, 2012), and exploitation for firewood and charcoal (Rueda, Baldi, Gasparri, & Jobbágy, 2015). This use of resources is not planned, causing forest degradation and sustained loss of the natural heritage in the region (Morello, Pengue, & Rodríguez, 2007). Therefore, there is a variety of forest conservation states, with varying degrees of impact and/or recovery levels, which will surely have their counterpart in functional aspects. However, the latter have been less studied.
Net Primary Production (NPP) is one of the most integrative descriptors of ecosystem functioning and represents the C gains by plants. Vegetation indices derived from satellite images like Enhanced Vegetation Index (EVI) and Normalized Vegetation Index (NDVI) are widely used to describe carbon gains and ecosystem functioning (Volante, Alcaraz-Segura, Mosciaro, Viglizzo, & Paruelo, 2012) because are closely related to above-ground net primary productivity (ANPP). Empirical relationships between vegetation indices and ANPP are well documented in the literature (Paruelo, 2008). Attributes like annual mean (an estimate of total C gains), annual relative range (description of the intra-annual variation of photosynthetic activity, an indicator of the seasonality of carbon fluxes), annual maximum and minimum (descriptor of vegetation phenology, indicating the intra-annual distribution of the period with maximum and minimum photosynthetic activity), derived from the seasonal curves of vegetation capture most of the variance in C gain dynamics across vegetation types (Cabello et al., 2008; Volante et al., 2012). These attributes can be considered synthetic variables describing the performance of vegetation and hence of ecosystem functioning focused on the dynamics of primary productivity (Paruelo, 2008). Functional characterization of vegetation based on remote sensing has been applied in different types of vegetation at regional scales (Brando et al., 2010; Pennec, Gond, & Sabatier, 2011), but there are only a few studies at local scale. The functional characterization of vegetation, which is complementary to the structural characterization, is very important because the functional responses against different environmental changes are faster than the structural ones (Paruelo, 2008). Therefore, knowledge on the functioning of the vegetation, and not only on its structure, provides better information for the management and conservation of forests particularly at local level.
Some studies have addressed the relationships between structural and functional parameters of the vegetation in the Chaco region. Regarding productivity, there was observed a clear seasonality pattern with maximum values from December to April (Clark, Aide, Grau, & Riner, 2010; Zerda & Tiedemann, 2010) during the growing season, according to climatic patterns in the region. At the same time, forest showed higher values of NPP and lower seasonality than natural grasslands in the region (Volante et al., 2012; Zerda & Tiedemann, 2010). For the semiarid Chaco forest, some authors have found a relationship between the normalized vegetation index (NDVI) in the dry season and above-ground biomass (Gasparri & Baldi, 2013), which could be explained by differences in the phenology of trees, shrubs and herbs (Gasparri, Parmuchi, Bono, Karszenbaum, & Montenegro, 2010). Although it has been suggested that studies of the structural and functional complexity of forests should be performed at different scales (Gasparri & Baldi, 2013), there are yet no studies addressing this issue at local level in the Chaco region.
Objectives
The aims of this work was: a) to establish a zonation of an area of native forests and savannas of the semiarid Chaco forest, based on the composition and structure of the woody plant community; b) to analyze the relationships between the structure of the community of woody plants and its productivity (estimated by the EVI). We expect to find higher values and lower seasonality in the ANPP of those vegetation classes with higher density and basal area of woody plants.
Materials and methods
Study area
The study was conducted within an agricultural-cattle establishment in Chaco Province, Argentina (61.5° W, 27.6° S), located in the Dry Chaco ecoregion within the “Chaco Subhúmedo Central” (Subhumid Central Chaco) complex (Morello, 2012a). Toward the south of the study area is the “Bajos Submeridionales” (Submerdional Lowlands) complex (Fig. 1). The establishment has near 1100 ha of natural cover, corresponding to native forests and savanna. Main productive activities in the establishment are breeding of cattle and cultivation of agricultural and forage crops. Forest and savanna are exposed, in some areas, to grazing and trampling due to the presence of cattle. Currently there is not timber extraction, but selective logging was carried out more than 60 years ago in the forest. According to this low anthropic pressure, forest presents a relatively well conserved structure.
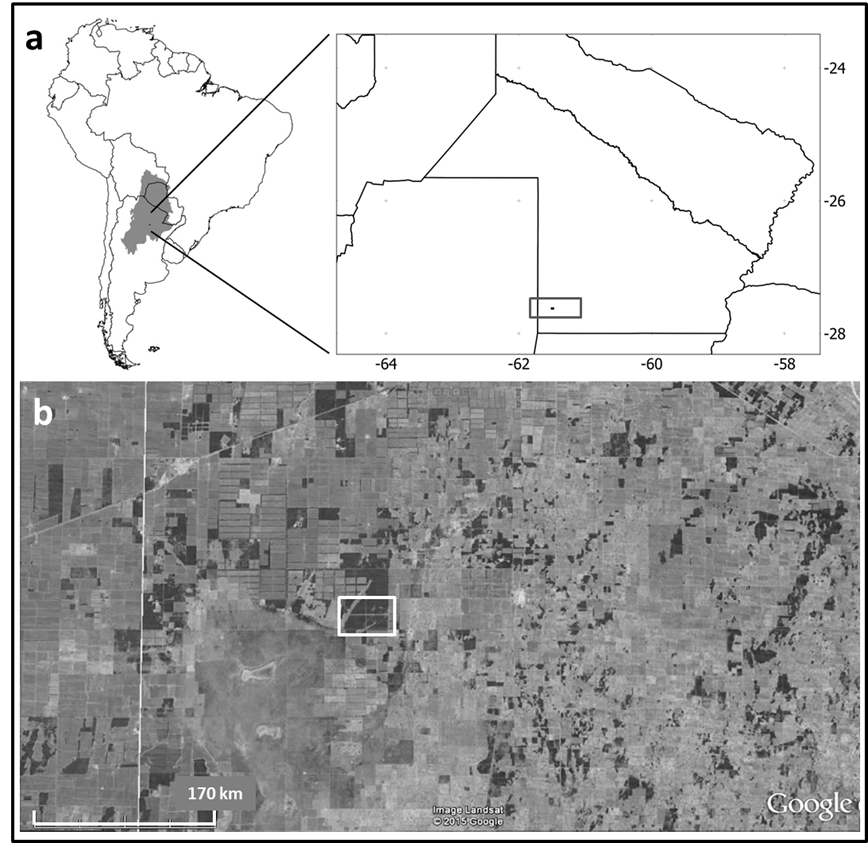
The rectangle highlights the study area.
Figure 1 a. Chaco region in South America and location of the study area in Argentina. b. Satellite image of the area showing the forest fragments (dark gray) within an agricultural matrix (light gray).
The natural cover in the “Chaco Subhúmedo Central” consists of semi-deciduous forests on well-drained soils alternated with not floodable open savannas and flooded grasslands (Morello, 2012a). The area is one of the hotspots of agricultural expansion in the region (Vallejos et al., 2015) and the current landscape is characterized by the presence of forest fragments, most of which are < 200 ha, immersed in an agricultural matrix (Torrella, Oakley, Ginzburg, Adámoli, & Galetto, 2011) (Fig. 1).
The climate has a marked seasonality with average temperatures of 27 °C in summer and 14 °C in winter, and an average annual rainfall between 900 mm and 1000 mm, concentrated mostly in spring-summer (Bianchi & Cravero, 2010).
Zonation
To identify differences within the study area, we performed an unsupervised classification of the Landsat 8 OLI image (228-79, November 3rd, 2014). The parameters of the classification were 50 classes, maximum 40 iterations and 0.99 convergence threshold, and isodata algorithm. The classes that corresponded to forests were identified by simultaneous comparison with a high-resolution satellite image (Google Earth - April 22nd, 2014). This area was selected from the original Landsat image to make a second classification, with 10 new classes. Based on this second classification and the spatial pattern obtained, homogeneous areas within the forest were identified. Finally, from the initial classification of 50 classes and observing the satellite image, we manually identified areas corresponding to savannas (a natural herbaceous matrix with scattered woody elements). Image classification and GIS analysis were performed in QGIS 2.4 (Quantum GIS development Team, 2014).
Vegetation sampling
We used a random stratified sampling with a total of 26 plots: 10 plots in each forest class and 6 in the savannas, given the small area that they occupy. Forest plots were located randomly in each class and with the following restrictions: avoiding roads and edges by at least 50 m, and distanced from each other by at least 150 m. In the case of the savannas, they were limited to the spatial location of the open areas.
Sample units were 4 m × 100 m for individuals of tree species (any size) and individuals of shrubby species with a diameter at breast height (DBH) ≥ 5 cm, and 2 m × 50 m for shrubs with DBH < 5 cm, because of their high density (Tálamo & Caziani, 2003; Torrella et al., 2011). We considered each stem as an individual and recorded the species and stem diameter for each individual. Individuals with DBH < 5 cm were measured at 10 cm from the soil (D10). Individuals with D10 < 1 cm were considered as not definitely established, and thus not taken into account.The number of individuals was used to calculate the density (individuals per hectare, ind ha-1), and DBH and D10 were used to calculate the basal area (m2 ha-1). Taxonomic identification was carried out in the field. When that was not possible, we used a dichotomous identification key. All taxonomic names were checked with the Instituto de Botánica Darwinion [Iboda] (n.d.). Fieldwork was conducted between August 2013 and November 2014.
Functioning characterization of vegetation classes
We analyzed the time series of the enhanced vegetation index (EVI) produced by the MODIS MOD13Q1 product to evaluate the functioning of the vegetation classes obtained. The EVI is a spectral index developed to optimize the vegetation signal with a correction of atmospheric influence on the soil and vegetation (Huete et al., 2002). The MODIS product has a spatial resolution of 250 meters and a temporal resolution of 16 days, using the maximum value composite of observations for each pixel. The EVI time series was analyzed for the period 2000-2014, obtained from the MODIS SUBSET platform (http://daacmodis.ornl.gov), for each hydrological year from September to August.We selected the MODIS pixels, which include at least 60% coverage of the vegetation class assigned during the mapping. For each class, we obtained the following attributes: the mean, minimum, maximum and relative range (RREL = [MAX - MIN] / Average) of each year. We used the command r.series of the Grass complement in QGIS to obtain the functional attributes and spatial query to obtain the values of each class.
We also obtained the total annual and mean monthly precipitation values for the period 2000-2014 (Administración Provincial del Agua, 2010). Also, we performed the annual curve (hydrological year) for each class of vegetation with the mean EVI values for the same period.
Data analysis
Using relative abundance, we elaborated rank-abundance curves to analyze community diversity of each class. In this way, we were able to graphically compare species richness, species relative abundances and evenness of the vegetation classes communities.
From the measurements taken in the plots, we calculated the total and per-species basal area (m2 ha-1) and density (ind ha-1) for each vegetation class. Then, we evaluated the differences in structure and composition between classes using these estimates at both community and population level. For the analysis, we separated the data in: “adults” (tree and shrub species with DBH > 5 cm in 4 m × 100 m plots), “saplings” (tree species with DBH < 5 in 4 m × 100 m plots) and “shrubs” (shrub species with DBH < 5 cm in 2 m × 50 m plots).For all pixels of each class per year, we averaged the values of each functional attribute. We analyzed the temporal trend of the EVI for each class by using linear regressions. We made a correlation between the trend of the mean EVI and mean precipitation values in the period 2000-2010, according to Iglesias, Barchuk and Grilli (2010).
We used general linear models to compare the classes identified, both for the structural and functional attributes. Each of the attributes corresponded to the response variable, and vegetation classes were included as a fixed factor. For the structural attributes, different variance structures (varIdent, varPower and varExp) were tested. For the functional attributes, we included models with three structures of residual covariance: (i) independent residuals, (ii) compound symmetry and (iii) autoregressive order 1.
In all statistical analyses, we tested the assumptions of normality and homogeneity of variance with Shapiro-Wilk and Levene’s tests, respectively. When necessary, we modeled heteroscedasticity. We compared different models and selected the best according to the lowest Akaike Information Criterion (AIC) value. For cases in which there was no adjustment of residues to a normal distribution, we used the non-parametric Kruskal-Wallis test. When we found differences among the three vegetation classes, we performed comparisons with the Post-hoc Tukey test. The significance level used was 0.05. The statistical analysis was performed in the R software (R Development Core Team, 2012).
Results
Zonation
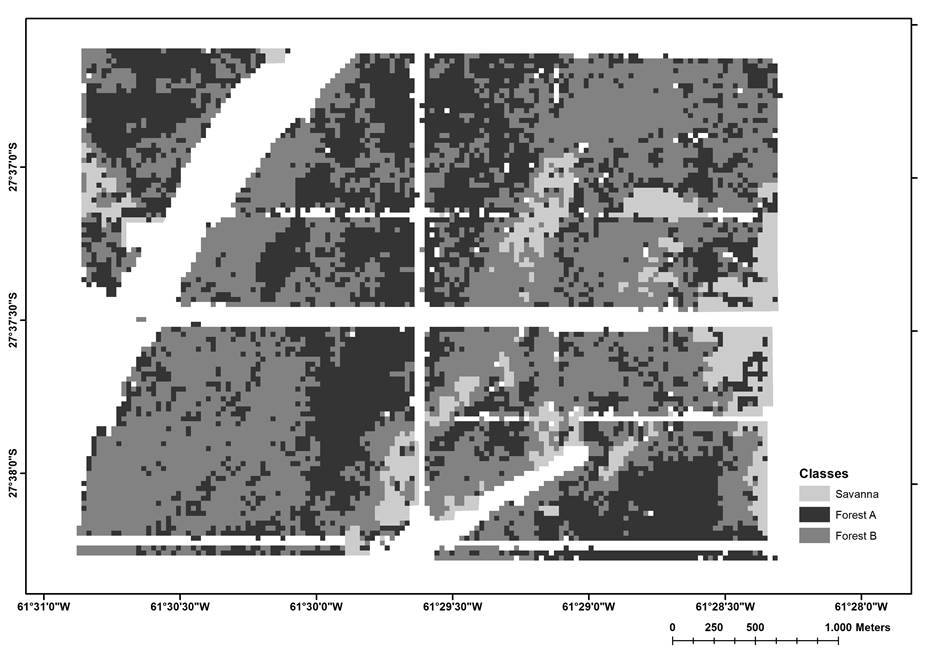
Three types of natural cover were identified: two classes of forest (forest A: 419.6 ha, and forest B: 592.3 ha) and a savanna (93.6 ha) (Fig. 2).
Composition and structure of the vegetation
We recorded a total of 4,178 individuals corresponding to 33 woody species belonging to 19 botanical families (Table 1). All species recorded are considered native in the region (Iboda, n.d.). We found 27 species in each forest class and 13 species in the savanna. The rank-abundance curves showed that the species composition of the two forest classes had no relevant differences in the number of species or in the curve shape (Fig. 3). However, they were different from the savanna curve, which also showed lower richness and evenness.
Table 1 Species recorded in the sampling.
| Species | Family | Abbreviation |
|---|---|---|
| Acacia aroma Gillies ex Hook. & Arn. | Fabaceae | Aca aro |
| Acacia caven (Molina) Molina | Fabaceae | Aca cav |
| Acacia praecox Griseb. | Fabaceae | Aca pra |
| Achatocarpus praecox Griseb. | Achatocarpaceae | Ach pra |
| Aloysia sp Paláu | Verbenaceae | Alo sp. |
| Anisocapparis speciosa (Griseb.) X. Cornejo & H.H. Iltis | Caparaceae | Ani spe |
| Aspidosperma quebracho-blanco Schltdl. | Apocynaceae | Asp q-b |
| Banara umbraticola Arechav. | Salicaceae | Ban umb |
| Caesalpinia paraguariensis (D. Parodi) Burkart | Fabaceae | Cae par |
| Capparicordis tweediana (Eichler) H.H. Iltis & X. Cornejo | Caparaceae | Cap twe |
| Capparis atamisquea Kuntze | Caparaceae | Cap ata |
| Castela coccinea Griseb. | Simaroubaceae | Cas coc |
| Celtis ehrenbergiana (Klotzsch) Liebm. var. ehrenbergiana | Celtidaceae | Cel ehr |
| Cereus forbesii Otto ex C.F. Först. | Cactaceae | Cer for |
| Coccoloba argentinensis Speg. | Polygonaceae | Coc arg |
| Cynophalla retusa (Griseb.) X. Cornejo & H.H. Iltis | Caparaceae | Cyn ret |
| Jodina rhombifolia (Hook. & Arn.) Reissek | Cervantesiaceae | Jod rho |
| Mimosa detinens Benth. | Fabaceae | Mim det |
| Moquiniastrum argentinum (Cabrera) G. Sancho | Asteracea | Moq arg |
| Moya spinosa Griseb. | Celastraceae | Moy spi |
| Opuntia quimilo K. Schum. | Cactaceae | Opu qui |
| Porlieria microphylla (Baill.) Descole, O´Donell & Lourteig | Zygophyllaceae | Por mic |
| Prosopis sp L. | Fabaceae | Pro sp. |
| Prosopis kuntzei Harms | Fabaceae | Pro kun |
| Schinopsis balansae Engl. | Anacardiaceae | Sch bal |
| Schinopsis heterophylla Ragonese & J. Castillo | Anacardiaceae | Sch het |
| Schinopsis lorentzii (Griseb.) Engl. | Anacardiaceae | Sch lor |
| Schinus fasciculatus (Griseb.) I.M. Johnst. var. fasciculatus | Anacardiaceae | Sch fas |
| Schinus sp L. | Anacardiaceae | Sch sp. |
| Sideroxylon obtusifolium (Roem. & Schult.) T.D. Penn. | Sapotaceae | Sid obt |
| Solanum argentinum Bitter & Lillo | Solanaceae | Sol arg |
| Trithrinax schizophylla Drude | Arecaceae | Tri sch |
| Ziziphus mistol Griseb. | Rhamnaceae | Ziz mis |
In the case of forests, a rift between the four most abundant species (which were the same in both classes) and the rest was highlighted in both curves.
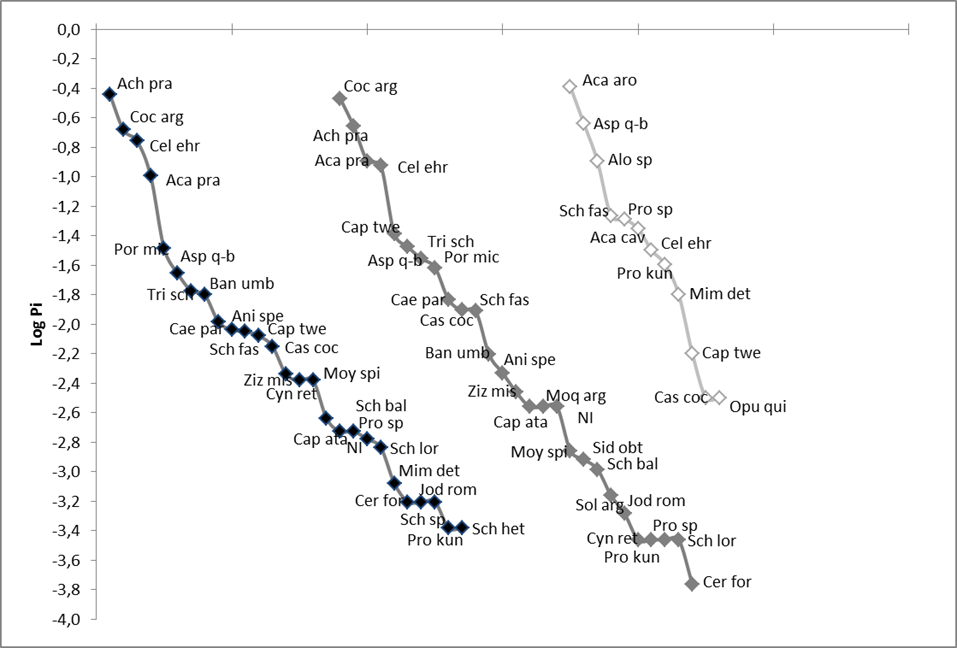
Black = Forest A (n = 10), dark gray = Forest B (n = 10), light gray = Savanna (n = 6). The abbreviations of the names are those given in Table 1
Figure 3 Rank-abundance curves for each vegetation class.
The total density of adult trees was higher in forest B than in forest A (1047.5 ind ha-1 ± 262.6 ind ha-1 and 837.5 ind ha-1 ± 285.6 ind ha-1, respectively), although these differences were not statistically significant (Supplement 1). We found no adult trees in the savanna class. The most abundant species in the forest were Aspidosperma quebracho-blanco, Trithrinax schizophylla, Acacia praecox, Achatocarpus praecox and Caesalpinia paraguariensis. The density of adults was significantly different between the forest classes A and B only in A. quebracho-blanco, Schinopsis lorentzii and T. schizophylla, with higher values in forest B (Fig. 4 and Supplement 1).
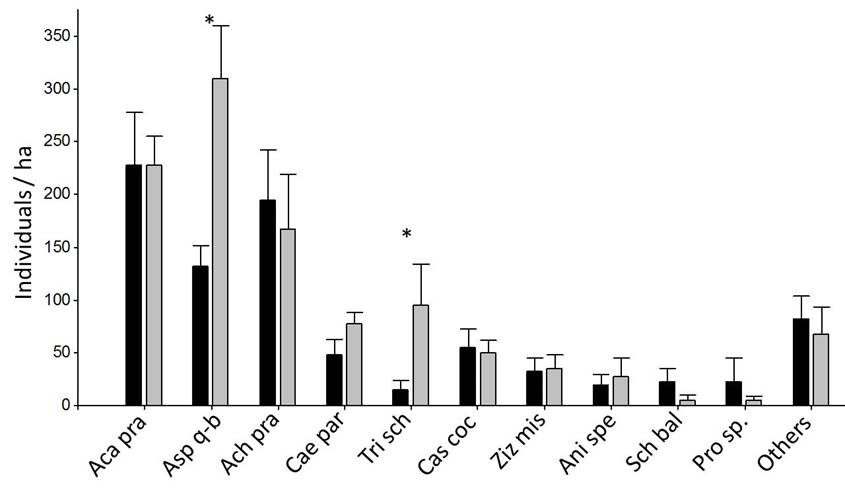
Black: Forest A (n = 10), dark gray: Forest B (n = 10). * indicates that means differ significantly at p = 0.05 (linear model or Kruskal-Wallis test). Detailed data of all species are provided in Supplement 1.
Figure 4 Density of adult individuals (DBH > 5 cm) of woody species in 4 m × 100 m plots (Mean ± SE).
Regarding the basal area of adult individuals, we also found higher values in forest B than in forest A. A. quebracho-blanco was the species with highest values in the two forest classes and had significantly higher basal area in forest B than in forest A (Fig. 5 and Supplement 1).
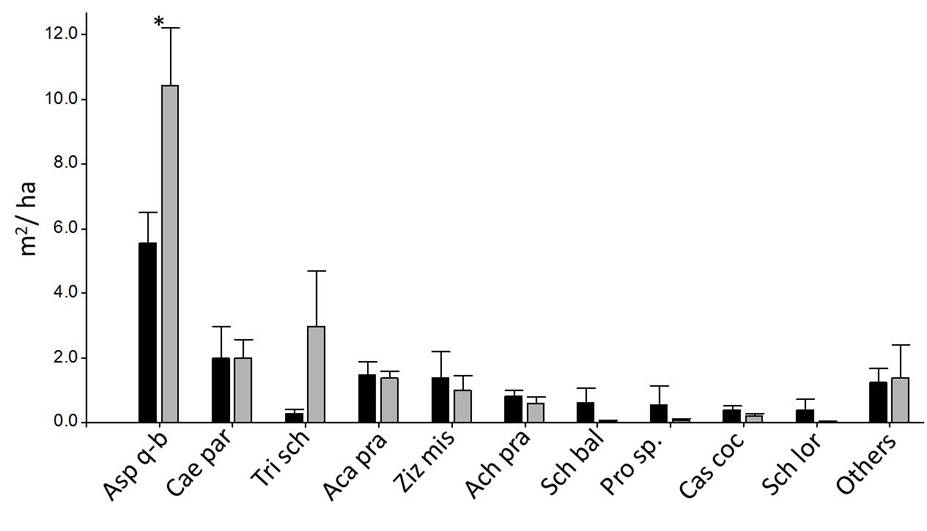
Black: Forest A (n = 10), dark gray: Forest B (n = 10). * indicates that means differ significantly at p = 0.05 (linear model or Kruskal-Wallis test). Detailed data of all species are provided in Supplement 1.
Figure 5 Basal area of adult individuals (DBH > 5 cm) of woody species in 4 m × 100 m plots (Mean ± SE).
The total density of tree saplings showed no statistically significant differences between the two forest classes and the savanna, except for Prosopis kuntzei, which was more abundant in the latter (Fig. 6 and Supplement 1). However, there were notable differences in the species composition of the sapling assembly between the two forest classes and the savanna (Fig. 6).
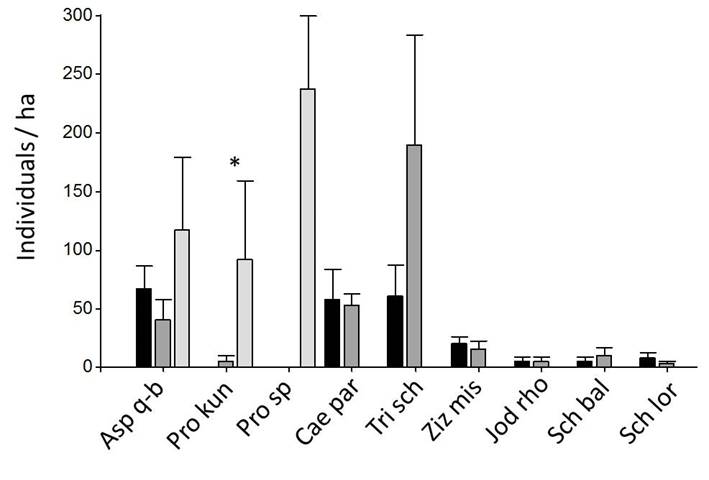
Black: Forest A (n = 10), Dark gray: Forest B (n = 10), light gray: Savanna (n = 6). * indicates that means differ significantly at p = 0.05 (linear model or Kruskal-Wallis test). Detailed data of all species are provided in Supplement 1.
Figure 6 Density of sapling individuals (DBH < 5 cm) of tree species in 4 m × 100 m plots (Mean ± SE).
Among the shrub strata, the savanna class was distinguished from both forest classes, showing lower values of density and basal area (Figs. 7 and 8). Between forest A and B, we found significant differences in Castela coccinea, Coccoloba argentinensis and Capparicordis tweediana, with higher values in forest B (Figs. 7, 8 and Supplement 1).
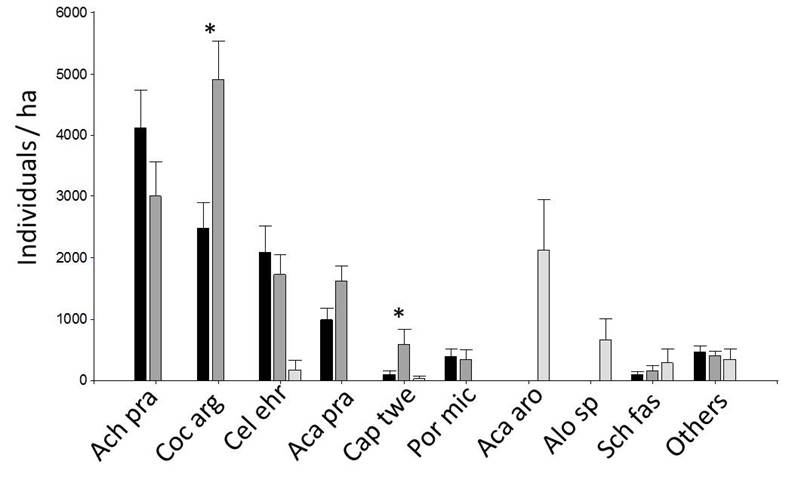
Black: Forest A (n = 10), Dark gray: Forest B (n = 10), light gray: Savanna (n = 6). * indicates that means differ significantly at p = 0.05 (linear model or Kruskal-Wallis test). Detailed data of all species are provided in Supplement 1.
Figure 7 Density of shrub individuals (DBH< 5 cm) in 2 m × 50 m plots (Mean ± SE).
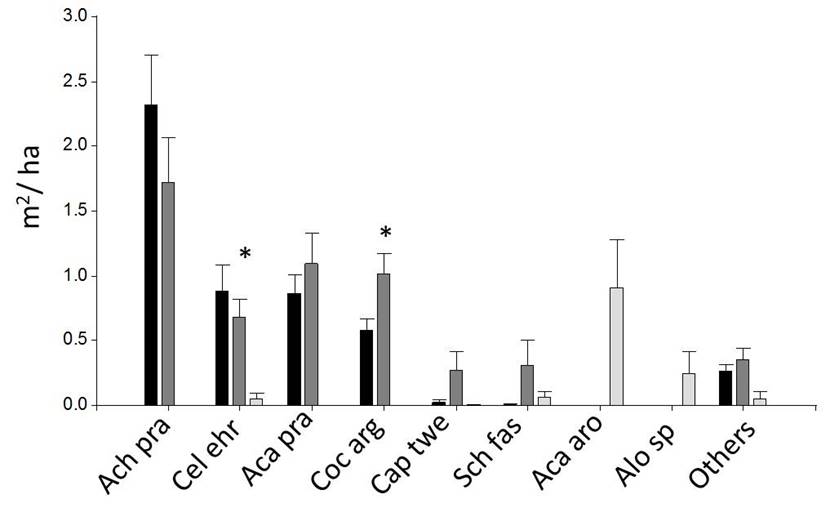
Black: Forest A (n = 10), Dark gray: Forest B (n = 10), light gray: Savanna (n = 6). * indicates that means differ significantly at p = 0.05 (linear model or Kruskal-Wallis test). Detailed data of all species are provided in Supplement 1.
Figure 8 Basal area of shrub individuals (DBH< 5 cm) in 2 m × 50 m plots (Mean ± SE).
Functional characterization
Seasonal curves (EVI) for the three vegetation classes were unimodal. As from September, the EVI mean value increased and reached the maximum during the summer. As from March, the photosynthetic activity decreased until winter, when it reached the minimum values, following the pattern of precipitation (Fig. 9). The number of pixels analyzed was 39 for forest A, 75 for forest B and 3 for the savanna.
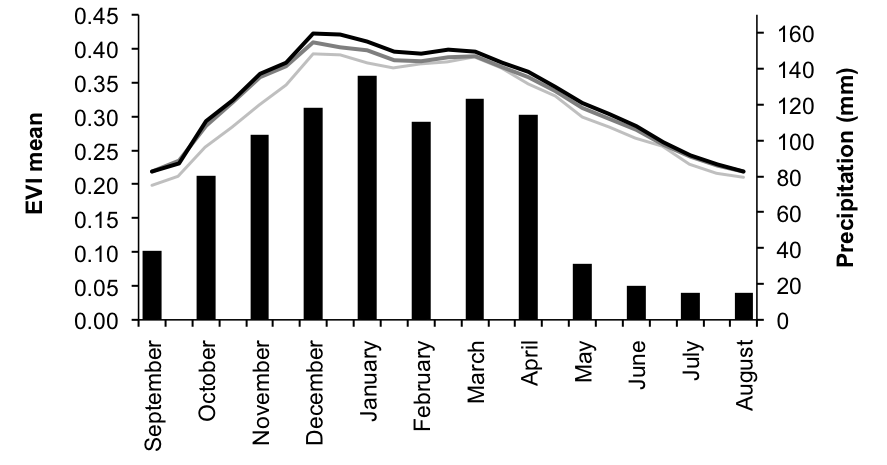
Black = Forest A, dark gray = Forest B and light gray = Savanna.
Figure 9 Mean EVI profile of the three vegetation classes analyzed and monthly precipitation values.
We observed a negative trend in the mean EVI values for the three vegetation classes along the period 2000-2014 (Forest A: R2 = 0.53, p <0.01; forest B R2 = 0.48, p <0.01; savanna C R2 = 0.47, p <0.01), with a reduction of 15%. No relationship was observed between the trend of mean EVI values and the precipitation values for the period 2000-2010 (Forest A: R2 = 0.27, p = 0.1; forest B: R2 = 0.23, p = 0.1; savanna C: R2 = 0.34, p = 0.06).
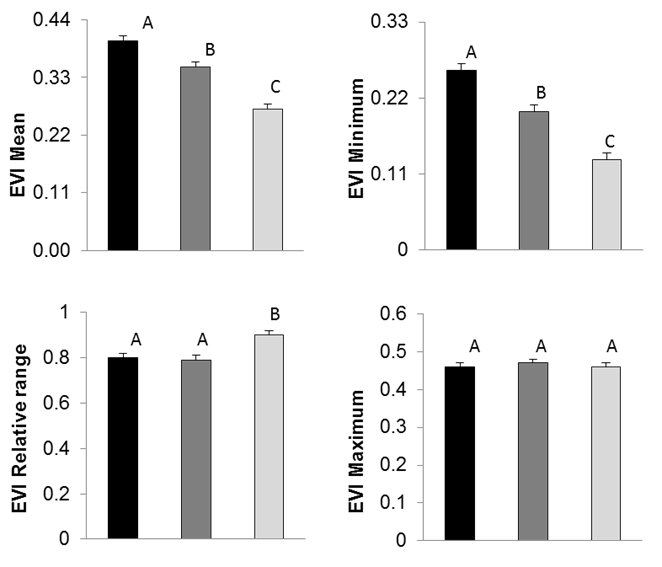
The best model for each of the functional attributes included the autoregressive model (AR1) in residues except for the relative range (Supplement 1. Significant differences were observed in the annual mean EVI values (F2,42 = 9.14, p < 0.01) and minimum EVI values (F2,42 = 11.5, p < 0.01) between the three vegetation classes; the maximum EVI values showed no significant differences (F2,42 = 11.5, p = 0.93). Forest A had the highest annual mean EVI values, followed by forest B and the savanna. The relative range presented a marginally significant difference between the savanna and the forest classes (F2,42 = 2.88, p = 0.06) (Fig. 10).
Discussion
Our study shows that there are differences in the composition and structure of the community of woody plants between the forest and the savanna in the study area. The density and basal area of adults and shrubs were naturally lower in the savanna, where the density of saplings was higher. In terms of composition, all the tree species found in the savanna were also recorded in the forest, but some tree species (e.g. Schinopsis balansae, S. lorentzii and Caesalpinia paraguariensis) were found only in the forest classes.
The total density of saplings was markedly higher in the savanna, a difference due to the saplings of A. quebracho-blanco, Prosopis sp. and P. kuntzei. Prosopis saplings were almost absent in both forest classes, in agreement with their heliophilous condition (Tortorelli, 2009).The shrub layer showed differences in species composition: while five species were present both in the forests and the savanna, Aloysia sp., Acacia aroma, A. caven and Opuntia quimilo were found only in the savanna. This could be explained because the last three species are heliophilous and acacias are dispersed by cattle (Demaio, Karlin & Medina, 2002; Mereles & Degen, 1997).
Taking into account that the forests in the region and in the “Chaco Subhúmedo Central” complex are dominated or co-dominated by species of the genus Schinopsis (Morello, 2012a; Morello & Adámoli, 1974; Prado, 1993; Torrella et al., 2011), the relative low abundance of this genus in the forests studied here is of note. This could be the result of selective logging; however, we found no evidence of recent or intensive logging. In fact, the current owners of the property ensure that no logging has been performed for about 60 years. Then, the explanation could be linked to the soil or topographical features possibly related to the proximity of the study site to the “Bajos Submeridionales” complex, a zone characterized by flooding and saline soils (Morello, 2012b).
A. quebracho-blanco was the most abundant tree species in our study area, with higher density values in forest B. It is well known that this species presents environmental plasticity against Schinopsis, having a wide distribution that includes areas with severe environmental conditions (Morello, 2012a; Prado, 1993). In forest B, we also found a notably higher density of T. schizophylla, a palm species highly associated with clay soils and flood sites (Moraes, Ríos-Uzeda, Moreno, Huanca-Huarachi, & Larrea-Alcázar, 2014; Navarro, Molina, & Vega, 2010). Then, the soil characteristics may explain the differences in the densities of T. schizophylla and A. quebracho-blanco.
The seasonal vegetation curve corresponded to that previously described for the woody vegetation in the Chaco region (Clark et al., 2010; Zerda & Tiedemann, 2010). The negative trend of the productivity in the period 2000-2014 was not related to the precipitation values. Gaitán, Bran, and Azcona (2015) also find a negative trend in the NPP (using NDVI as a proxy) for many areas in the region in the same period. The authors attribute this result to the land use change and deforestation process, since NPP of the native Chaco forest is higher than cultivated areas (Volante et al., 2012). Interestingly, in our study site, the forest area did not change in the analyzed period, thus, the negative trend in NPP would be promoted by other process and is not necessarily related to forest degradation. In general, along a secondary succession, productivity is higher in early stages, then decrease and tends to an asymptote (Curiguata & Ostertag, 2001). This could be the case in the study area, if some intense disturb occurred many years ago, like selective logging (that was carried out more than 60 years ago) or woody fire.
Most studies about relationships between ANPP and forest structure have been developed at a large scale and some have found a positive relationship between vegetation indices and coverage (Gaitán et al., 2013) and density of trees (Gillespie, Zutta, Early, & Saatchis, 2006; Pau, Gillespie & Wolkowich, 2012). However, not many studies have evaluated the relationships between forest structure and ANPP through the EVI at local scale. Some have noted that ANPP is higher in situations where the shrub layer has greater influence on the spectral properties, like in the open forest (Gond et al., 2013) and in early successional stages (Hernandez-Stefanoni & Dupuy, 2007), when the canopy is not yet dense. According to expected, NPP of the savanna, with lower basal area and density, is lower than the NPP in forest. This is also consistent with that reported in other regions (Borges & Sano, 2014).
Between forest classes, although we did not find statistically significant differences in basal area nor density, the forest with higher values in these structural parameters (forest B) showed lower values of ANPP, contrary to expected. This difference in ANPP could be given by other factor not directly related with the attributes measured here, like foliar area, deciduousness, or successional stage. Other studies reported that mature forests show lower vegetation index values than secondary forest (Hartter, Ryan, Southworth, & Chapman, 2011; Hernandez-Stefanoni & Dupuy, 2007) because they invest in woody biomass rather than in foliar biomass. In our study site, the higher density of A. quebracho-blanco in forest B could be related with a successional stage relatively mature which would explain the observed differences in ANPP.
Conclusions
The methodology allowed establishing a zonation of the area and quantitatively describing the community of woody plants in two different forests and a savanna. We could not identify a clear pattern in the relationship between woody vegetation structure (i.e. basal area and density) and ANPP. Our general prediction (higher ANPP values with higher density and basal area) was fulfilled only when comparing forest and savannas; but not between forest classes. This issue should be further explored to find general patterns to predict the vegetation structure by using satellite data in other sectors within the region, and it would also be necessary to explore other vegetation features (e.g. foliar area, deciduousness) and attributes of the herbaceous layer. Future research should analyze whether the negative trend detected in the EVI for the period 2000-2014 is a general pattern in the forests of the region and if is related to degradation or to changes in functionality along a post-disturbance recovery.

