


 nueva página del texto (beta)
 Inglés (pdf)
 Artículo en XML
 Referencias del artículo
 Enviar artículo por email
 Citado por SciELO
  Similares en
SciELO
Similares en
SciELO 
 Permalink
Introduction
Forest succession, one of the oldest concepts in forest ecology (Johnson & Miyanishi, 2008), has been the focus of extensive ecological studies over a century (Christensen Jr., 2014; Li et al., 2016; Meiners, Cadotte, Fridley, Pickett, & Walker., 2015). However, despite the long-standing empirical and theoretical research on forest succession, its lessons have not been adequately integrated into efforts to tackle modern environmental problems (Prach & Walker, 2011).
Understanding the drivers of alternative successional pathways and their consequences for stand development is critical to forecasting future successional trajectories of ecosystem functioning (Harvey & Holzman, 2014), yet our ability to make accurate predictions of successional trajectories including the successional rate of change remains elusive (Harmon & Pabst, 2015; Walker & del Moral, 2008). The discussion has revolved around whether there is a single endpoint or there are multiple endpoints along forest succession (Prach et al., 2016). Forest succession has traditionally been approached as a deterministic process, driven by biotic filters such as competition as well as by abiotic filters like resource availability. Ecologists generally assume that deterministic succession occurs under identical abiotic starting conditions, particularly after disturbances influencing legacy effects (sensuBrown, Liu, Yan, & Johnstone, 2015). On the contrary, multiple trajectories are presumed to be the result of spatial or temporal environmental heterogeneity, with chance being an important factor mainly in initial phases and in the absence of residual species and individuals (Kreyling, Jentsch, & Beierkuhnlein, 2011).
Even though ecological ecosystems are heterogeneous in time and space, the environmental heterogeneity that affects successional dynamics and the magnitude of successional rate of change has seldom been addressed, hence there is surprisingly little empirical data showing how environmental heterogeneity or the spatial arrangement of biotic and abiotic conditions influence forest successional patterns. If spatial configuration and chance play significant roles in modulating the tight relationship between succession and the environment, alternative successional pathways are possible within similar environmental conditions (Turner, Baker, Peterson, & Peet, 1998).
Objectives
In this study, we investigated successional trajectories and successional rates of change using stand volume as a metric. We set the following research objectives: (1) to investigate the relative contribution of stand volume increment on successional trajectories in three contrasting floristic zones over three different time scales; (2) to investigate the magnitude of successional rate of change in each of these floristic zones; (3) to determine the role of specific environmental factors on successional patterns.
Materials and methods
Study site
The research was carried out in a protected area named Sierra de Manantlán. It is located in the Mexican states of Jalisco and Colima, (19° 24' 32” - 19° 31' 02” North latitude; 103° 57' 44” - 104° 01' 09” West longitude), between the Nearctic-Neotropic realms, along the western portion of the Trans-Mexican Volcanic Belt. This mountain chain arose as an effect of the upward folding of Cretaceous deposits, and resulted in a region of abrupt topography with valleys and deep ravines that allow the persistence of a unique and diverse community of plants and animals (Cuevas-Guzmán, Benz, & Jardel, 1997).
Altitude ranges from 2000 to 2450 m a.s.l. and soils correspond to andosols, with scattered patches of cambisols and luvisols of a sandy-loam texture. High organic matter (up to 20%) but low mineral nutrient content characterizes the area. Precipitation regime is unimodal, with a dry season between October and June and a high peak of rain between July and September. Mean temperature ranges from 12 to 18 °C (with a higher frost frequency during the dry season) and mean annual rainfall of 1300 mm.
Origin of the present-day vegetation in the study area
The present-day forest ecosystems are composed by second-growth, even-aged, oak-dominated forest stands, originated mostly after the execution of high-intensity silvicultural methods such as clearcuttings around 1940s by The Colima Lumber Company and left behind without any silvicultural management. These past activities shaped a complex forest zonation, composed of a number of even-aged forest stands of different states of development; however, written records derived from technical evaluations or forest management plans are largely unavailable for the study area, therefore it is difficult to establish past management effects for these forest.
Oak species growing in these forested zones are typically represented by sub-deciduous oak forest of higher altitudes which can be categorized as “stem exclusion stage” stands (sensuOliver & Larson, 1996); this stage occurs when, after several years of a gap creation, once gaps are rejuvenated by new trees, some of the existing trees die, there is no recruitment of new individuals and the surviving ones grow larger, expressing differences in height and diameter. Hence, vegetation in the study area encompasses three main oak-dominated floristic zones, each with particular structural, floristic and environmental properties as described by Olvera-Vargas, Figueroa-Rangel and Vázquez-López (2010):
Xeric floristic zone (Xe): mostly dominated by Quercus crassipes including other canopy dominant species such as Prunus serotina, Pinus leiophylla and Alnus jorullensis.
Mesic floristic zone (Me) mostly co-dominated by Quercus species: Quercus candicans, Quercus laurina, Quercus aff. excelsa and Quercus scytophylla; it also includes Persea hintonii, Ilex tolucana and Styrax ramirezii.
Transition floristic zone (Tr): with Quercus obtusata, Q. rugosa, Carpinus tropicalis and Viburnum hartwegii as the main canopy taxa.
Sampling design and measurements
The sampling was carried out using a modification of the Successive Sampling with Partial Replacement (SPR) approach, which was developed by Patterson (1950) and later modified for forestry applications by Ware and Cunia (1962). In implementing a SPR, a conventional forest inventory is carried out during the primary stage of sampling. In a second phase a percentage of the initially established permanent plots are re-measured, but a set of new plots is added successively until a target sampling size is accomplished. Periodic surveys allow precise estimates of the components of forest dynamics, besides the statistical advantages of independence of samples (Legendre & Fortin, 1989).
Following a SPR approach, we randomly established 86 non-managed circular permanent plots (500 m2 each) in the three previously described floristic zones (Xe n = 29; Me n = 20; Tr n = 37). Three forest inventories were conducted for the Xe (1991; 1994; 2002) and two for the Me (1994; 2002) and the Tr (1998; 2002) zones. The length of monitoring time differences between plots ranges from 4 years for the most recently established plots to 11 years for those established at the start of our study.
The permanent plots
In each individual 500-m2 permanent plot, all adult trees (trees ( 5 cm dbh and ( 1.30 m tall) were tagged, enumerated, recorded and identified by species. Structural measurements included diameter at breast height (dbh) and tree height. A durable colour-painted post was placed in the centre of each permanent plot to help in subsequent location. The study plots were located in a range of soil types and site conditions to incorporate the full range of environmental variation inside each floristic zone.
Statistical analysis
Along with floristic information, we recorded physiographic and soil-related variables at each of the 86 plots according to the protocol by Olvera-Vargas, Moreno-Gómez, and Figueroa-Rangel (1996). This information included: altitude, slope, aspect and catena. We assessed six catena positions varying in shape and slope (Cat0: flat terrain; Cat1: ridge slope; Cat2: upper slope; Cat3: middle slope; Cat4: lower slope; Cat5: base slope; Cat6: gully/ ditch. Soil samples were collected from three points equally spaced within each 500-m² permanent plot; they were thereafter mixed up to obtain one sample per plot. Soil elements were determined by a standard laboratory protocol: pH, organic matter content (OMC), sand, silt and clay, Calcium (Ca), Potassium (K), Magnesium (Mg), Manganese (Mn), Nitrogen (N) and Phosphorous (P). Prior to statistical analyses, we performed log10 transformations for soil-related variables excepting pH. Aspect, recorded as degrees of azimuth, was converted into a linear scale Beers’ transformation; (Beers, Dress, & Wensel, 1966). The remaining variables were power transformed.
We used species dominance data as a metric for successional rate of change on the assumption that forest succession involves an increase of stand (tree-stem) volume (“vegetation quantity hypothesis” sensuLohbeck (2015)).
Plot´s species dominance was estimated with the following equation (Olvera-Vargas et al. 2010):
Where:
Where: DSp i is the number of individuals of species i in plot j; VolSpi is the volume of species i in the plot j. Therefore, volume was calculated according to Husch, Miller, and Beers (1982) as follows:
Where:
Where: ni is the number of individual trees per species per diameter class (diameter class boundaries were set at 5 cm in all cases), gi is the average basal area per species per diameter class, and hi is the average height per species per diameter class; G is the total basal area per plot; f is the form factor which was set as 0.5 for all species. Diameter class limits were 5 cm.
Detrended Correspondence Analysis
We conducted Detrended Correspondence Analysis, DCA (Hill & Gauch, 1980), as a measure of successional rate of change as well as to portray successional trajectories over time using plot´s species dominance as a metric. We used arrows connecting subsequent years of resampling to analyse the direction of successional changes. Vector DCA diagrams displayed the resultant displacement of a permanent plot from one forest inventory to another, where vector length represents successional rates of change in the ordination space (Whittaker, 1991).
DCA was chosen from other indirect ordination method (e.g.Freeman & Kobziar, 2011; Matthews & Endress, 2010; Rebele, 2013) because, besides it requires of a few statistical assumptions, in DCA the scaling in standard deviation units allows species dominance turnover along the axes to be directly measured between two consecutive inventories.
To carry out the DCA ordinations, we produced three-matrices, one for each floristic zone, with cells filled with plot as rows and species dominance values (I P index) as columns. This approach generated sample scores for each permanent plot and sampling period. We then estimated the rate of successional change by permanent plot by subtracting the sample score produced at time t 0 (the initial time) from that at t +1 (the final time). We carried out this estimate using the sample scores produced by the first two DCA ordination axes (Whittaker, 1991). While computing the DCA ordinations, all species found within each floristic zone were included in the analyses, but standard procedures of down-weighting for infrequent species and detrending by segments were implemented. To minimise the effects of abundant species, the three floristic zones data matrixes were log-transformed (log (x+1) as recommended by (ter Braak, 1995). The non-parametric Wilcoxon´s test was performed to test whether plot position along DCA ordination axes were significantly displaced away from previous forest inventory´ position (Sokal & Rohlf, 1981). In order to determine whether successional changes were progressive or retrogressive, we followed a similar approach to the one implemented by Whittaker (1991). Hence, we named ‘progressive’ successional rate of change when there was a positive movement along DCA axis-1 due to an increase in I P species dominance. Similarly, we named retrogressive successional rate of change if the contrary took place: when there was a negative movement along DCA axis-1 and therefore a reduction of I P in species dominance, in both cases from t 0 to t +1 .
We also constructed diameter-class histograms by floristic zone and forest inventory, in order to visualise the internal structure (floristic and diameter-size changes from t 0 to t +1 ) for those permanent plots that experience the largest successional rates of changes judged by the size of their respective vector on the DCA ordination diagram.
Multiple Regression Analyses
Ecological hypotheses on successional trajectories as well as on rates of succession in relation to habitat differentiation seem to be contradictory and highly controversial. Our prediction is that, due to the floristic zonation, including the environmental heterogeneity reported for the study area by Olvera-Vargas et al. (2010), it will be reasonable to assume that within each floristic zone, forest succession should proceed as a deterministic process with a unidirectional successional trajectory and, that similar small-scale drivers, but mainly physiographic-related drivers such as altitude, catena, slope and aspect, should correlate to the observed successional dynamics.
In order to discern which environmental variables explained successional rate of change, multiple linear regression analyses were applied, using rate of change as a response variable and physiographic and soil-related variables as explanatory variables. We first looked at all the correlations among the whole set of environmental variables to avoid collinearity; subsequently we applied TREE model to see whether complex interactions between the explanatory variables were indicated (Crawley, 2015). At the end, we applied generalized linear model (GLM) with the remaining variables. All analyses were processed using R software, v. 3.4.3 (R Core Team, 2017).
Results
Successional trajectories
I P results for the first two axes produced eigenvalues of 0.658 and 0.181 for Xe; 0.548 and 0.283 for Me and 0.769 and 0.309 for Tr. These values accounted for 66%; 58% and 71% of the total inertia, suggesting that a two-dimensional solution summarize most of the total amount of variance in the three data sets (Fig. 1a-c).

The direction of each vector symbolizes the individual plot’s migration over the DCA ordination diagram from t 0 to successive t +1 positions; the length of the vector is proportional to their individual rate of change, based on the I P differences between time periods.
Figure 1 Successional trajectories described by Detrended Correspondence Analyses (DCA) for a) the xeric (Xe) floristic zone - 11 years; b) mesic (Me) floristic zone - 8 years and; c) transition (Tr) floristic zone -4 years.
From our results, it was evident that not all the permanent plots followed unidirectional successional trajectories and equivalent rates of change as we hypothesised. Our results thereby suggest that unpredictable successional trajectories, accompanied by different magnitudes in the successional rates of change, were quite noticeable. These patterns were more evident in Xe (Fig. 1a), with three time-periods of observation (four, eight and 11 years after plot establishment) including the longest time-span (11 yr).
Concerning the three zones, some plots had parallel alignments to each other, although pointing in opposite directions (e.g. plots 26 and 12 for Xe; plots 34 and 45 for Me; plots 64 and 81 for Tr) (Fig. 1 a-c) suggesting different successional dynamics, based on species dominance. However, the Wilcoxon´s signed-rank test indicated significant plot displacements along the DCA axis-1 only for the Me (Table 1).
Table 1 Generalized linear models of physiographic and soil-related variables with rate of change (ROC) as a response factor.
| Response variable | Explanatory variable | Estimate | Standard error | t | p | Null deviance | df | Residual deviance | AIC |
|---|---|---|---|---|---|---|---|---|---|
| Xeric zone ROC | Mn | 27.74 | 12.87 | 2.138 | 0.0521 | 0.90228 | 28 | 0.25909 | -20.52 |
| N | 15.55 | 6.38 | 2.437 | 0.0299* | |||||
| pH | 68.62 | 30.27 | 2.266 | 0.0411* | |||||
| Slope | 15.93 | 6.73 | 2.367 | 0.0341* | |||||
| Mn:N | -0.9924 | 0.417 | -2.378 | 0.0334* | |||||
| Mn:pH | -4.467 | 2.053 | -2.176 | 0.0486* | |||||
| Mn:Slope | -1.023 | 0.470 | -2.288 | 0.0395* | |||||
| N:pH | -2.453 | 1.021 | -2.402 | 0.0319* | |||||
| N:Slope | -0.593 | 0.243 | -2.438 | 0.0299* | |||||
| pH:Slope | -2.565 | 1.084 | -2.366 | 0.0342* | |||||
| Mn:N:pH | 0.157 | 0.066 | 2.360 | 0.0346* | |||||
| Mn:N:Slope | 0.0375 | 0.0155 | 2.415 | 0.0312* | |||||
| Mn:pH:Slope | 0.1658 | 0.0718 | 2.308 | 0.0381* | |||||
| N:pH:Slope | 0.0940 | 0.0390 | 2.407 | 0.0317* | |||||
| Mn:N:pH:Slope | -0.0059 | 0.0024 | -2.396 | 0.0323* | |||||
| Transitional zone ROC | P | 0.0076 | 0.0038 | 1.98 | 0.556 | 0.10366 | 37 | 0.09149 | -113.26 |
| Mg | 0.00022 | 0.0001 | 2.053 | 0.047* | |||||
| Mesic zone ROC | pH | 0.28716 | 0.0830 | 3.458 | 0.00351** | 0.57735 | 17 | 0.2505 | -17.858 |
| Catena | -0.05287 | 0.0221 | -2.390 | 0.03039* |
Significant regression coefficients estimates, and their stand errors with *p=0.05 and ** p=0.01. AIC, null and residual deviance correspond to significant regression equations for every model using Gaussian error.
Successional rates of change
The rate of change magnitude was variable depending on the zone. Tr and Xe (comparing the same four-yr period along axis 1) showed that more plots experienced progressive than retrogressive successional changes, while a few remained unchanged; on the contrary for the Me, most of the plots performed retrogressive changes (Fig. 2 a-b). The median varied in the three zones but, regarding the amplitude of the changes, Me, with an eight-yr interval, was more similar to Xe at 11-yr interval; Tr and Xe were more similar at the same time interval of four-yr; the maximum progressive values corresponded to Xe at the higher time interval (11-yr) while the minimum was for Me (Fig. 2b).

Figure 2 Rate of change for the three floristic zones and time periods. Xe-4yr and Xe-11yr represent xeric floristic zone at four and 11-year interval; Me-8yr, the mesic zone at eight year interval and Tr-4yr, transitional at four year interval. a) Proportions of progressive, retrogressive and no change plots regarding successional rate of change; b) box and whiskers plots representing quartiles of the standard deviation units in DCA- axis 1.
Diameter-class frequency distributions characterised the internal floristic structure of some plots; these were arbitrarily chosen as they represented extremes cases of rates of change, either progressive than retrogressive. For instance, a careful examination of the diameter-class frequency distributions for plot 17 in the Xe (Fig. 3), showed that the diameter structure was dominated by Q. crassipes followed by Pinus leiophylla and Alnus jorullensis and only few individuals of Garrya laurifolia. In this figure, we observed a strong tendency of Q. crassipes dominance in the period of 11-yr. Thus, this plot followed a unidirectional successional trajectory across the entire observation period. If we observe carefully this figure, species composition kept their representativeness across sampling periods with no floristic changes (Quercus crassipes, Pinus leiophylla, Garrya laurifolia and Alnus jorullensis, given in order of dominance).
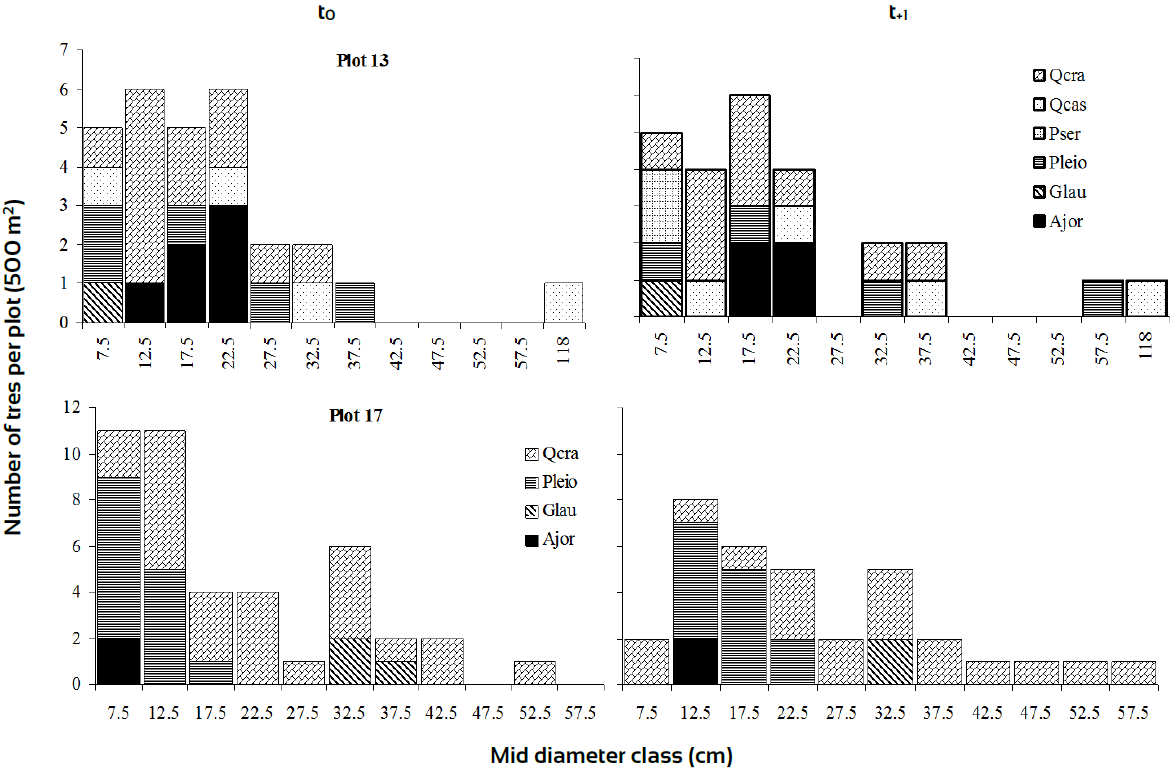
Ajor, Alnus jorullensis; Glau, Garrya laurifolia; Pleio, Pinus leiophylla; Pser, Prunus serotina; Qcas, Q. castanea; Qcra, Q. crassipes.
Figure 3 Diameter class distributions of plots with different rates of change based on I p dynamics in xeric zone.
Apart from the addition of Quercus castanea and Prunus serotina, plot 13 showed a somewhat similar species composition to plot 17; P. serotina was recorded as ingrowth into the plot 13, while P. leiophylla individuals managed to reach higher diameter sizes at t+1 (Fig. 3). This situation could be the source of successional changes occurred in plot 13. Plots (36 and 47) in Me, showed regular diameter classes with minor changes along time (Fig. 4). This behaviour could be the source of arrows direction steadiness in the DCA. In zone Tr, Plot 79 presented 9 species with Abies religiosa and Ternstroemia lineata dominating the size structure; both species were very dynamic with important changes from time t0 to t+1. Plot 86 experienced key structural changes along time with Quercus rugosa and Symplocos citrea in the canopy and T. lineata and A. jorullensis in the understory (Fig. 5).

Cexc, Cornus excelsa; Fuhd, Fraxinus uhdei; Glau, Garrya laurifolia; Itol, Ilex tolucana; Pser, Prunus serotina; Qcan, Q. candicans; Qcas, Q. castanea; Qlau, Q. laurina; Qrug, Q. rugosa; Scit, Symplocos citrea; Sram, Styrax ramirezii; Tlin, Ternstroemia lineata; Zcon, Zinowiewia concinna.
Figure 4 Diameter class distributions of plots with different rates of change based on I p dynamics in mesic zones.

Ajor, Alnus jorullensis; Arel, Abies religiosa var. religiosa; Glau, Garrya laurifolia; Oxal, Oreopanax xalapensis; Pleio, Pinus leiophylla; Qaexc, Quercus aff. excelsa; Qcas, Q. castanea; Qcra, Q. crassipes; Qlau, Q. laurina; Qrug, Q. rugosa; Qscy, Q. scytophylla; Scit, Symplocos citrea; Sram, Styrax ramirezii; Tlin, Ternstroemia lineata.
Figure 5 Diameter class distributions of plots with different rates of change based on I p dynamics in transitional floristic zone.
Environmental drivers of successional rates of changes
Tree model indicates that, regarding Xe, Mn was the main factor explaining rate of change; however, at Mn>13.85 ppm, N interacts with Mn. At N < 34.65 ppm, pH and slope determined rate of change with the highest progressive values arising with slopes > 29% (Fig. 6a).

P, N, Mg and Mn are represented in ppm (parts per million); pH in logarithmic units (0-14); slope in percentage and catena in 7 categories: 0: Flat terrain; 1: Ridge slope; 2: Upper slope; 3: Middle slope; 4: Lower slope; 5: Base slope; 6: Gully/ditch. The values in the rectangle are the mean values for rate of change satisfying the splitting.
Figure 6 Tree models for a) Xeric, b) Mesic and c) Transitional floristic zones.
For the Me, pH was the main factor explaining rate of change; sites with pH values >6.65 presented the highest rate of change; however, at pH<6.65, catena interacted with pH. The highest retrogressive values were for sites on lower slope, base slope and gully/ditch (Fig. 6b).
For the Tr, P was the main factor explaining rate of change; however, at P>14.75, N interacts with N. At N > 22.1 ppm, Mg and Mn determined rate of change with the highest progressive values arising with Mn< 15.75 ppm (Fig. 6c).
Results of the GLM models for the Xe zone showed that, Mn (p=0.521), N, pH and Slope together with their respective interactions, explained better the rate of change (all significant at p<0.05) (Table 1). For the Tr zone, only P (p=0.556) and Mg (p=0.047) explained rate of change; although only Mg was significant at p<0.05 (Table 1). For the Me zone, pH and catena, both significant at p<0.05, explained rate of change in the model (Table 1). All equations were solved using a Gaussian error.
Discussion
Successional trajectories and rate of change
Our results showed that most of the plots in the three floristic zones experienced inconsistent displacement over the DCA ordination diagram. This implies that several successional pathways are occurring in the sub-tropical Quercus-dominated forests in the study area, probably due to alternated patterns of species dominance. Our results are hence in agreement with those reported by del Moral, Saura, and Emenegger (2010), who found different trajectories of compositional change according to habitat differences. Our findings also are in agreement with Christensen Jr. (2014) who claims that forest succession is not always directional and deterministic and it has no specific endpoint in the sense of ever increasing forest stand stability.
We observed that most of the permanent plots had stochastic patterns of succession, this was observed to occur independently of the time span or floristic composition, which might reveal interspecific competition and a shift of species dominance in forest succession (Bose, Schelhaas, Mazerolle, & Bongers, 2014). However, the successional patterns observed in plot 17, gave a signal of caution since, even when this plot presented the highest rate of change, it followed a unidirectional trajectory across the 11-year period, suggesting a certain degree of success-sional predictability.
The general expectation is that vegetation composition of an initial stage of succession, is mainly stochastic and at later stages is mostly deterministic (Walker & del Moral, 2003). However successional trajectories in plant communities can follow several alternative routes, from definitive pathways, moving through well-defined stages and leading to predictable and stable floristic associations (Walker & del Moral, 2003; 2008).
Our results showed that, notwithstanding that a number of plots had comparable movements as DCA vectors length suggested, particularly in Tr and Me, their overall trajectories experienced a rather stochastic migration over the DCA ordination diagram. We argue this may be an effect of the different successional stages or stand successional development (Oliver, & Larson, 1996) as a result of species interactions and environmental determination. Judged by the extent an individual plot was displaced between two consecutive sampling periods over the DCA diagram, we found at least four main successional trajectories: i) plots with an outstanding displacement between time periods, accompanied by an unpredictable migration over the DCA diagram; ii) plots with a modest rate of change and uniform movement across the ordination space; iii) a small number of plots that changed very little over time and; iv) few plots with no changes over time.
Environmental determination on patterns and rates of succession
Our hypothesis that physiographic-related drivers such as altitude, catena, slope including aspect should correlate to successional dynamics partially matched our prediction. We believe this since slope was one of the significant explanatory variable determining rate of change mainly in the Xe zone, while catena was in the Me zone. However, soil-related factors such as pH, N, P, Mg and Mn were also important predictors, particularly in Xe zone. There are compelling evidences (DeSantis, Hallgren, Lynch, Burton, & Palmer, 2010; Rebele, 2013) indicating that species composition and the co-occurrence of species with different tolerance to light, pH, N and physiographic heterogeneity can cause several micro-successional dynamics, even within relatively small geographic areas. Biotic and abiotic factors such as soil nutrients, species composition and disturbance type, amongst others, are fundamental for promoting a wide range of successional processes (Chase, 2003; Higgins, Shackleton, & Robinson, 1999; Kneitel & Chase, 2004) as well. In agreement with these findings, present research evidences revealed that the environmental drivers determining rate of change, are those related to soil properties and small-scale physiography; these factors are connected and according to our results varied substantially amongst plots, creating microclimatic conditions which could imply distinctive successional trajectories.
For instance, in the Me, catena and pH were the main drivers determining rate of change, probably as an effect of soil cations concentration (e.g. K, Ca, Mg) (Dalberg-Poulsen, Tuomisto, & Blaslev, 2006). Additionally, pH is determined in large part by the quantity of these base-forming cations, which according to Bigelow and Canham (2002), are responsible of growth and mortality patterns in some forest trees.
Concerning the Xe zone, where slope was an important explanatory variable, Kariuki, Rolfe, Smith, Vanclay, and Kooyman (2006) found that topography modifies forest microclimate through differences on the incidence of solar radiation along the slope. Therefore, the highest rate of change reported for Xe was associated to slopes higher than 29%. As a consequence, more light enters the forest floor allowing faster recruitment, which in turns accelerates the process of forest succession.
Progression and retrogression in successional trajectories have been associated to nutrient cycles, particularly to N availability (Christensen Jr., 2014). The main effect was reduction in ecosystem productivity and standing tree volume. The result was a community with slow-growing species adapted to nutrient poor conditions (Peltzer et al., 2010). In the other hand, temporal patchiness in resource availability has been recognized as a driver that affects species diversity while changes in species composition tend to be driven by changes in climate (Brown, Ernest, Parody, & Haskell, 2001). Retrogressive trajectories were more common in Me where catena and pH explained rate of change while the higher progressive were present in the Xe zone where N was one of the main explanatory variables.
Based on our results we can argue that, depending on the species composition linked with soil and physiography related variables, forest succession may follow several alternative routes and may vary in the magnitude of successional rate of change over time. However, it has been reported that forest communities are systems whereby species replacement follows a deterministic mode and therefore forest succession is a highly predictable event (McCune & Allen, 1984). A 20-year study of succession in forest plantations, stated that all stands migrated roughly towards the same direction within the DCA ordination space (Hunt, Gordon, Morris, & Marek, 2003). Because Hunt’s and collaborator results were derived from a forest plantation data in which just two species were involved (Pinus banksiana Lamb. and Picea mariana (Mill.) BSP), this can be taken as an indication that monospecific stands tend to be highly stable and hence, ecological succession is predictable. This line of evidence does not apply to our Quercus-dominated forests, presumably due to the high heterogeneity in floristic composition and the environmental surrounding the study plots. Hence, although forest succession has traditionally been approached as a deterministic process, successional trajectories of vegetation change vary widely, even among nearby stands with similar environmental conditions and disturbance histories (Norden et al., 2015).
Regarding the patterns observed in the histograms, most successional changes were an outcome of linked effects of individual turnover and changes in patterns of species dominance over time due to diameter growth. Another source of species turnover could be tree mortality and recruitment in the permanent plots. These two demographic vital rates are highly dependent in diameter, density, crown position and plot diversity in the study area (Olvera-Vargas, Figueroa-Rangel & Vázquez-López, 2015). We believe that these factors, in addition to habitat heterogeneity, could be the main reasons behind the inconsistent directionality of the vectors in the DCA ordination diagrams.
Conclusions
Overall, we found multiple successional trajectories (retrogressive, progressive and no change) in the plots conforming three different floristic zones in Quercus forests. Directionality, estimated by species dominance, was driven by physiographical and soil related variables. However, the explanatory variable for rate of change, varied depending on the floristic zone.
From a methodological point of view, results from this study stated that due to the longevity of most of the tree species, longer-term data are needed to effectively compare the rate and direction of the successional trajectories. The number of repeated observations in the permanent plots can play a fundamental role in judging whether successional processes, independently of the vegetation type, are unidirectional or stochastic.
In accordance with other studies on forest succession carried out elsewhere, we also concluded that none of the three floristic zones followed unidirectional and deterministic trajectories; even with the highest time interval of this study (11-yr). Thus, it was challenging to discern whether these forest communities increase stability as long as succession take part. For this aim it is fundamental to combine longer-term proxies such as those used in paleoecology to comprise changes in plant assemblages in the order of centuries to millennia. This time-scale could include successional processes allied with the effect of the physical environment on vegetation, but also its adaptation to climate change.

