


 text in
  English (pdf)
 Article in xml format
 Article references
 Send this article by e-mail
 Cited by SciELO
  Similars in
SciELO
Similars in
SciELO 
 Permalink
Introduction
The family Annonaceae consists of 75 genera, of which Annona is the most important, since it has 100 species, of which only seven and one interspecific hybrid are commercially cultivated (Paull & Duarte, 2011). Morton (2013) notes that, within the family Annonaceae, the soursop grows in a tropical climate, has larger fruits and is the only one that can be preserved and processed.
Babaji and Abu (2018) indicate that the pulp of soursop fruit is highly appreciated because it has a unique, pleasant, sub-acid and aromatic flavor, with its taste being a mixture of sweetness and mild sourness. In addition, soursop consumption provides potassium, riboflavin and niacin (Ramkhelawan, 2008). Coria-Téllez, Montalvo-González, and Obledo-Vázquez (2018) point out that soursop pulp contains alkaloids and acetogenins that show antihelmintic and anti-cancer activity. Therefore, soursop fruit represents an option as a food, since it can provide benefits to human health, in addition to having great potential for industrialization and development of various food products.
During 2018, 3,693.2 ha of planted soursop were reported in Mexico (Servicio de Información Agroalimentaria y Pesquera [SIAP], 2020), which are distributed along the Pacific (from Sinaloa to Chiapas) and the Gulf of Mexico (from Veracruz to the Yucatan Peninsula) (Paull & Duarte, 2012). The states with the largest commercial area are Nayarit (67 %), Colima (12.5 %) and Michoacán (8 %), which together account for 87.5 % of the national total (SIAP, 2020), although Veracruz, Chiapas, Tabasco, Yucatan and Quintana Roo also report the presence of soursop (Andrés-Agustín & Segura-Ledesma, 2014).
Although soursop has great potential for food, industrial and medicinal use, it remains an underutilized tree due to the lack of commercial varieties, conservation strategies and genetic characterization of the available germplasm (Andi-Brisibe, Ogbonna & Nkachukwu-Chukwurah, 2017). Several authors indicate that most of the plantations established in Mexico are made up of trees propagated by seed, which generates fruits with great variation in shape and size (Evangelista-Lozano, Cruz-Castillo, Pérez-González, Mercado-Silva, & Dávila-Ortiz, 2003; Hernández-Fuentes, Gómez-Jaimes, & Andres-Agustin, 2013). This characteristic suggests that there is a vast genetic resource that can be harnessed, but first research must be conducted on the selection of superior genotypes through characterization, use and conservation (Terán-Erazo et al., 2019). In contrast, Talamantes-Sandoval, Cortés-Cruz, Balois-Morales, López-Guzmán, and Palomino-Hermosillo (2019) suggest low diversity in populations of different seed-propagated commercial orchards in Nayarit.
In Mexico, studies on soursop fruit quality have been conducted in Morelos, Colima, Veracruz, and Nayarit focused on basic quality characteristics such as size, weight, total soluble solids (TSS), titratable acidity, and color (Evangelista-Lozano et al., 2003; Jiménez-Zurita et al., 2016; Nolasco-González, Hernández-Fuentes, & Montalvo-González, 2019; Ortiz-López, Hernández-Fuentes, Manzanilla-Ramírez, & Molina-Ochoa, 2015; Rosas & Becerra, 2012), and to a lesser extent on soluble sugars, phenols, flavonoids, antioxidant activity and vitamin C (Terán-Erazo et al., 2019).
In general, soursop fruits are considered a valuable food because they offer health benefits due to the presence of natural antioxidant components, which contribute to the prevention of cardiovascular diseases, and other chronic diseases such as cancer, diabetes, Alzheimer's and heart disease (Dar, Mahajan, Lay, & Sharma, 2018).
Escobedo-López, Campos-Rojas, Rodríguez-Núñez, Alia-Tejacal, and Núñez-Colín (2019) indicate that in Mexico the main Annonaceae richness, collection and ex situ conservation areas are in the Pacific lowland province, which is where the state of Chiapas is located. In this state, the main uses of soursop are as edible pulp in fresh or frozen form, and for the production of liqueurs and ice creams (Andrés-Agustín & Segura-Ledesma, 2014); additionally, soursop is considered an important option for generating economic income (Pohlan, Borgman, Flores-García, Lerma-Molina, & Pérez-Romero, 1997), since it can reach a price of 80.00 MXN (~3.66 USD) per kilogram of fruit or pulp. However, this fruit tree is only found in backyards or small areas, which does not allow taking advantage of its potential as an alternative crop in some regions suitable for its development.
In Chiapas, no work is being carried out to assess the genetic diversity of soursop, which could be useful in selecting genotypes with desirable traits to generate populations with high genetic variability and productive potential (Barrera-Sánchez et al., 2018). However, it is considered that there is variability in soursop trees with quality fruits that can be used in genetic breeding programs and to generate commercial varieties for the region in the future.
Based on the above, the present research was conducted with the aim of evaluating the variation in soursop fruits cultivated in four municipalities of Soconusco, Chiapas, through some physical and chemical traits, and thus establish an efficient methodology for the selection of outstanding fruit quality materials.
Materials and methods
From May 2015 to October 2016, field trips were made to locate soursop orchards −all propagated from seed− in production in the municipalities of Tapachula, Mazatán, Cacahoatán and Huehuetán, Chiapas, Mexico (Table 1). After identifying the orchards, they were monitored to identify the fruiting period. A total of 28 trees were selected for the study −seven from each municipality− based on the outstanding traits shown by the donor producers and on the homogeneity of the age of the trees (approximately 10 years). Six fruits were harvested from each tree at physiological maturity, which was considered as the harvest index used by the producers; that is, the fruit changed from a deep dark green to a yellowish green. The fruits were collected between 7:00 and 10:00 am, and then kept in a ripening chamber at 23 °C and 70 % relative humidity in the Postharvest Laboratory of the Faculty of Agricultural Sciences of the Autonomous University of Chiapas. Once they reached consumption maturity, some physical and biochemical variables were determined.
Table 1 Geographical location of the four study municipalities in the Soconusco region, Chiapas, Mexico.
| Municipality (trees) | Mean temperature (°C) | Coordinates | Elevation (m) | Climate |
|---|---|---|---|---|
| Tapachula (TAPA1-TAPA7) | 24 | 15° 04’ 37.30” - 92° 15’ 19.93” | 726 | Warm |
| Mazatán (MAZA1-MAZA7) | 28 | 14° 53’ 30.2” - 92° 27’ 59.5” | 17 | Warm humid |
| Cacahoatán (CACA1-CACA7) | 25 | 14° 59’ 28.3” - 92° 09’ 37.1” | 499 | Temperate humid |
| Huehuetán (HUEH1-HUEH7) | 27 | 15° 01’ 55.1” - 92° 24’ 07.3” | 27 | Warm humid |
The weight of each harvested fruit was determined using a digital balance (Scout ProSp 4001, OHAUS®) with a sensitivity of 0.1 g. Quantification of the weight of the peel, pulp, rachis and seeds was done by sectioning the fruit into each structure. The total number of seeds in each fruit was recorded. The length was evaluated with a tape measure (FH-10M, Truper®), from the base to the apex of the fruit, and the equatorial diameter was measured in the middle of the fruit with a Vernier caliper (CALDI-6MP, Truper®).
The color parameters of the epidermis and pulp, namely brightness (L*), chromaticity (C*) and hue (h), were obtained with a manual spectrophotometer (model 3290, X-rite®). Readings were taken on three different parts of each fruit (apex, middle and basal sections). Pulp color evaluation was done by removing a portion of the epidermis from the same area where the color of the epidermis was measured (McGuire, 1992).
Pulp firmness was quantified in the equatorial part of the fruit with a universal texturometer (DFE 050, Chatillon®) with an 8-mm diameter conical strut. For this determination, the epidermis of the fruit was removed before taking the reading. Values were expressed in Newtons (N).
The TSS content was determined in all fruits from two drops of fruit juice extracted with a super extractor (PAL-1, ATAGO®). Quantification was performed using a refractometer (PAL-1, ATAGO®), and results were reported in °Brix.
Titratable acidity was determined by the method reported by the AOAC (Helrich, 1990). Ten g of pulp were homogenized with 100 mL of distilled water; the mixture was filtered and a 10-mL aliquot was taken for titration with 1 N NaOH, using phenolphthalein as indicator. Results were expressed as a percentage of citric acid. For the quantification of total sugars, the methodology proposed by Whitam, Blades, and Devlin (1971) was used, and the Folin-Ciocalteau technique was used for total phenols (Singleton, Orthofer, & Lamuela-Raventós, 1999). Results were expressed as mg gallic acid equivalents (GAE) per 100 g fresh weight sample (mgGAE·100 g-1).
Antioxidant activity was determined by three methods: 2,2-diphenyl-1-picrylhydrazyl (DPPH) free radical, 2,2'-azino-bis(3-ethylbenzothiazoline-6-sulfonic acid) (ABTS) and ferric reducing ability of plasma (FRAP). The DPPH method was developed with the methodology proposed by Brand-Williams, Culivier, and Berset (1995). One g of pulp was homogenized with 10 mL of distilled water, then 0.10 mL of the previously filtered mixture were taken and allowed to react with 3 mL of DPPH methanolic solution (6.1x10⁻⁵ M, Sigma Aldrich) for 30 min in the dark. The change in absorbance was evaluated at 517 nm. Antioxidant activity was determined from a standard curve with ascorbic acid. Results were expressed as mg ascorbic acid equivalents (AAE) per 100 g sample (mgAAE·100 g-1).
For the ABTS method, ABTS reagent (Sigma-Aldrich®) at 7 mM and potassium persulfate (K2S2O8) at 2.45 mM were mixed. The mixture was left to stand for 16 h and then diluted with 20 % ethanol to an absorbance of 0.7 ± 0.02 at 734 nm. Subsequently, 3 mL of ABTS were added to 50 µL of the aqueous extract (1 g of pulp + 10 mL of distilled water), left to react for 15 min and the absorbance was read at 734 nm. Results were expressed as mg AAE per 100 g fresh weight sample (mgAAE·100 g-1), obtained from a calibration curve (Re et al., 1999).
The antioxidant activity by FRAP was determined with the methodology of Benzie and Strain (1996). The FRAP reagent (2,4,6-Tris[2-pyridyl]s-triazine [TPTZ], FeCl3 and acetate buffer) was prepared, and 1.8 mL of FRAP were mixed with 140 µL of distilled water and 60 µL of aqueous sample (1 g of pulp + 10 mL of distilled water); the reaction lasted 30 min at 37 °C and at the end of the reaction time the absorbance was evaluated at 593 nm. Results were expressed as mg AAE per 100 g fresh weight sample (mgAAE·100 g-1), obtained from an ascorbic acid calibration curve.
The individual data of the quantitative variables were first studied by descriptive statistics (Castillo, 2011). Then, a cluster analysis using Euclidean distances and Ward's minimum variance method (Ward, 1963) was applied to the matrix of the average values of each tree, where the number of groups was estimated with Hotelling's t 2 pseudostatistic (Hotelling, 1951), which was also established in the relativization of the Euclidean distance in semi-partial R2 to generalize with comparative studies (Johnson, 1998; Núñez-Colín, & Escobedo-López, 2011). According to Núñez-Colín and Escobedo-López (2014), for the groups resulting from the cluster analysis, a canonical discriminant analysis was performed as an ordination method, where collinearity was ruled out by using a full range matrix, and total canonical structure was used to report the discriminant variables, which standardizes the data to standard normal distribution by means of their values (Johnson, 1998; Núñez-Colín & Escobedo-López, 2014). To select the variables of each canonical root, a t-test was used considering only those with the smallest P values for each root. All these tests were calculated with SAS ver. 8.0 software (SAS Institute, 1999).
Results and discussion
Descriptive statistics
The average weight of the soursop fruits evaluated was 0.98 kg, with high variation among the accessions evaluated (64.9 %) (Table 2). The TAPA3 tree from Tapachula had the fruit with the highest average weight, with 3.2 kg. In Veracruz, Rosas and Becerra (2012) determined the average fruit weight in 12 soursop selections, which ranged from 0.8 to 1 kg. Likewise, in four soursop accessions evaluated in Colima, an average fruit weight of between 0.71 and 0.88 kg was reported (Ortiz-López et al., 2015). In Nayarit, Jiménez-Zurita et al. (2016) and Terán-Erazo et al. (2019) obtained an average weight of between 1.52 and 0.97 kg when evaluating 13 and 52 trees in situ, respectively. Hernández, Nolasco, and Cruz (2017) report an average fruit weight of between 0.72 and 1.93 kg in five selections from Nayarit. Pinto and Andrade (2005) indicate that soursop fruits between 0.8 and 2.5 kg are for fresh consumption, whereas those over 2.5 kg are for industry use. Based on the above, Mexico can be seen to have potential for soursop production for fresh consumption.
Table 2 Descriptors of quantitative fruit traits and descriptive statistics of soursop genotypes from Soconusco, Chiapas, Mexico.
| Traits | Simple statistics | |||||
|---|---|---|---|---|---|---|
|
|
S2 | r | Minimum | Maximum | CV (%) | |
| Fruit weight (g) | 988.4 | 642.0 | 3,152 | 118 (CACA3) | 3,270 (TAPA3) | 64.9 |
| Pulp weight (g) | 550.7 | 381.3 | 1,884 | 66 (MAZA1) | 1,915 (HUEH5) | 69.2 |
| Peel weight (g) | 247.5 | 140 | 786 | 24 (TAPA2) | 810 (TAPA3) | 23.2 |
| Seed weight (g) | 55.3 | 75.0 | 878 | 0.0 (CACA5) | 878 (HUEH7) | 135.6 |
| Rachis weight (g) | 47.0 | 31.0 | 148 | 2.0 (CACA3) | 150 (MAZA7) | 66.0 |
| Number of seeds | 94.1 | 68.4 | 379 | 0.0 (CACA5) | 379 (HUEH6) | 72.6 |
| Fruit length (mm) | 16.8 | 4.8 | 20.2 | 7.9 (CACA3) | 28.1 (TAPA3) | 28.9 |
| Fruit diameter (mm) | 9.7 | 2.2 | 16.6 | 4.3 (CACA3) | 20.9 (TAPA5) | 23.2 |
| L* pulp | 56.2 | 15.9 | 87.2 | 4.0 (TAPA2) | 91.2 (MAZA3) | 27.1 |
| C* pulp | 27.2 | 28.8 | 92.8 | 0.8 (CACA6) | 93.6 (MAZA2) | 106.6 |
| h pulp | 76.5 | 13.1 | 84.8 | 5.1 (MAZA2) | 89.9 (MAZA5) | 17.1 |
| L* peel | 36.8 | 13.6 | 86.5 | 0.7 (MAZA3) | 87.2 (MAZA2) | 37.0 |
| C* peel | 30.9 | 25.2 | 93.5 | 2.1 (TAPA3) | 95.6 (CACA3) | 82.7 |
| h peel | 74.3 | 16.8 | 84.1 | 5.7 (CACA1) | 89.9 (MAZA4) | 22.6 |
| Firmness (N) | 2.7 | 2.5 | 17.7 | 0.1 (TAPA4) | 17.8 (MAZA4) | 92.2 |
| Total soluble solids (°Brix) | 8.5 | 3.6 | 15.8 | 3.7 (MAZA2) | 19.5 (MAZA4) | 42.4 |
| Acidity (%) | 0.55 | 0.14 | 0.7 | 0.2 (CACA5) | 1.0 (CACA2) | 25.3 |
| Total sugars (g·100 g-1 fruit weight) | 7.93 | 4.95 | 20.08 | 2.03 (TAPA2) | 22.1 (MAZA7) | 62.5 |
| Total phenols (mgGAE·100 g-1 fruit weight) | 2.5 | 0.7 | 3.4 | 1.0 (TAPA5) | 4.4 (CACA2) | 30.7 |
| DPPH (mgAAE·100 g-1) | 45.2 | 19.2 | 130.2 | 6.4 (HUEH5) | 136.6 (CACA1) | 42.4 |
| ABTS (mgAAE·100 g-1) | 79.6 | 41.4 | 226.4 | 16 (TAPA5) | 242.7 (CACA4) | 51.9 |
| FRAP (mgAAE·100 g-1) | 62.0 | 26.1 | 132.4 | 25.5 (HUEH1) | 157.9 (CACA1) | 42.1 |
The average weight proportion of the pulp, peel, seeds and rachis was 62, 27, 6 and 5 %, respectively, with high coefficients of variation (CV) (from 23.2 to 135.6 %) (Table 2). Rosas and Becerra (2012) indicated that the proportion of pulp in soursop selections from Veracruz ranged from 70 to 89 %. Similarly, Hernández et al. (2017) found a pulp yield of 68.7 to 76.2 % in five selections from Nayarit. Jiménez-Zurita et al. (2016) and Terán-Erazo et al. (2019) report a range from 71 to 73 % in the same trait in soursop trees evaluated in situ. Considering the above, and from the yield of the pulp in the materials from Chiapas evaluated in this work, it is confirmed that they are fruits suitable for fresh consumption.
The average number of seeds was 94, with some fruits without seeds and others with up to 379 seeds, so the CV was 72.6 % (Table 2). In soursop selections from Veracruz, the number of seeds ranged from 40 to 102, in Colima this value was from 45.4 to 58.8 and in Nayarit it was from 40 to 137 (Jiménez-Zurita et al., 2016; Nolasco-González et al., 2019; Ortiz-López et al., 2015; Rosas & Becerra, 2012; Terán-Erazo et al., 2019). The high variation in the number of seeds is attributed to the fact that the soursop’s flowers have pollination and fertilization problems, this due to the morphological characteristics of the flower and its pollinators (Franco-Mora, Jasso-Mata, García-Villanueva, & Saucedo-Veloz, 2001). In general, the present study found that the larger the fruit, the greater the number of seeds. In this sense, Nolasco-González et al. (2019) report a high positive association between fruit weight and number of seeds (r = 0.81***), confirming the results obtained.
Fruit length ranged from 7.9 to 28.1 cm, while its diameter ranged from 4.3 to 20.9 cm, with a CV between 23.2 and 28.9 % (Table 2). Hidalgo (2003) suggests that variables with a CV of less than 20 % have little variability. In Nayarit, fruit length was reported to range from 14 to 29.9 cm, and diameter from 8 to 18.8 cm, both with low CV (from 12.4 to 18.8 %) (Jiménez-Zurita et al., 2016; Hernández et al., 2017; Terán-Erazo et al., 2019). This suggests that there is greater variability in Chiapas in terms of the dimensions of the fruit that can be used for the improvement of this species.
On average, the color of the pulp showed a trend towards opaque yellow and intermediate brightness (L* = 56.2, C* = 27.2 and h = 76.5; Table 2). However, some pulp materials were observed with darkening (L* = 4.0 and C* = 0.8), probably due to their susceptibility to enzymatic oxidation, and others with high purity and brightness (L* = 91.2 and C* = 93.6). Hernández et al. (2017) observed materials from Nayarit with a trend towards opaque yellow, but with high values in brightness (L* = 76.7 to 78.4, C* = 10.8 to 10.9 and h = 92.4 to 96.5). Espinosa, Ortiz, Tovar, Mata, and Montalvo (2012) report that the color of the soursop pulp in its mature stage is translucent white (h = 90). The chromaticity (C*) and brightness (L*) identified in the Chiapas fruits are traits that could be considered for the selection of quality pulp, this due to its high CV (from 27.1 to 106.6 %; Table 2).
The color of the soursop peel was variable; some fruits were opaque and dark brown (h = 5.7, C* = 2.1 and L* = 0.7), and others were green with a trend towards a bright and vivid yellow (h = 89.9, C* = 95.6 and L* = 87.2) (Table 2). Hernández et al. (2017) report that in soursop selections from Nayarit the color of the epidermis is a pale yellowish green at harvest time. Jiménez-Zurita et al. (2017) and Terán-Erazo et al. (2019) point out that Nayarit soursop fruits at consumption maturity are opaque green with little brightness (L* = 28.9 to 59.2, C* = 7.2 to 40.25 and h = 109.9 to 164.9). The chromaticity in the color of the peel showed high CV (82.7 %); this could be used to define an objective harvest index in soursop, since producers use the color change from a dark green to a yellowish green as an indicator. However, it is necessary to validate it in a follow-up study of the development of the fruit and correlate it with quality parameters in postharvest.
Fruit firmness showed a high CV (92.2 %), with values ranging between 0.1 and 17.8 N (Table 2). Márquez-Cardozo, Cartagena-Valenzuela, and Ciro-Velasquez (2012) indicate that soursop at the ripening stage has a firmness of 4.7 to 7.4 N, while at the over-ripening stage the average values are 3.6 N. The firmness of the evaluated populations was coincident with an over-ripening stage, since the fruits presented an average firmness of 2.7 N (Table 2). Hernández et al. (2017) report that, in different soursop selections from Nayarit, firmness ranged from 4.7 to 13.9 N, confirming the great variation in this trait in the species. It is important for future studies to determine where firmness is associated with color parameters to define an objective harvest index.
TSS were between 3.7 and 19.5 °Brix, with an average of 8.5 °Brix and a CV of 42.4 % (Table 2). Rosas and Becerra (2012) report fruits with 13 and 14 °Brix, while Ortiz-López et al. (2015) obtained values between 14.4 and 16.4 °Brix. Similarly, Jiménez-Zurita et al. (2016) and Terán-Erazo et al. (2019) observed values of 7.1 and 20.1 °Brix in this same variable in soursop fruits from Nayarit evaluated in situ. Hernández et al. (2017), also in Nayarit selections, obtained TSS between 10.8 and 22.8 °Brix. The results suggest that the great variation in TSS could be used in the selection of materials for further improvement.
The average titratable acidity of the fruits of the evaluated sample fruits was 0.55 %, with minimum and maximum values of 0.2 and 1.0 % (Table 2). Jiménez-Zurita et al. (2016) report values of 0.3 to 1.2 % in this same variable, and Hernández et al. (2017) recorded a variation of 0.4 to 1.21 % in soursop from Nayarit. The above data show that soursop fruits from Soconusco are similar to those reported in the literature; however, the variation within the sample indicates potential for determining the use of the fruits, either for fresh consumption or industrial use.
Sugars content is important, as it contributes to the texture, taste, color, and nutritional value of the fruits (Yahia, Carrillo-Lopez, & Bello, 2018). In this study, the concentration of total sugars showed high variation (CV = 62.5 %), with values between 2 and 22.1 g·100 g-1, where the maximum was obtained in fruits from a Mazatán tree (MAZA7; Table 2). Terán-Erazo et al. (2019) report values of 2.9 to 20.9 g·100 g-1 of total sugars in soursop from Nayarit. This suggests that some Soconusco trees produced fruits with a high concentration of total sugars, so this may be a trait of interest.
Total phenols showed a CV of 30.7 %, with values between 1.0 and 4.4 mgGAE·100 g-1 fresh weight; the maximum value was detected in fruits from Cacahoatán (CACA2; Table 2). Dos Reis-Nunes et al. (2013) report values of 0.32 mgGAE·100 g-1, while Moreno-Hernández, Sáyago-Ayerdi, García-Galindo, Mata-Montes de Oca, and Montalvo-González (2014) obtained 2.55 mgGAE·100 g-1 dry weight. Jiménez-Zurita et al. (2017) found values between 64 and 74.2 mgGAE·100 g-1 during ripening of two soursop ecotypes from Nayarit, and Coria-Téllez et al. (2018) report a content of 9 mgGAE·100 g-1. The soursop fruits evaluated in this study could help contribute these functional metabolites to human consumption.
The average antioxidant activity determined with DPPH, ABTS and FRAP methods was 45.2, 79.6 and 62 mgAAE·100 g-1, with minimum and maximum values of 6.4 to 136.6, 16 to 242.7 and 25.5 to 157.9 mgAAE·100 g-1, and CV of 42.1, 51.9 and 42.1 %, respectively (Table 2). Beserra-Almeida et al. (2011) obtained values of 91.29 and 16.94 mgAAE·100 g-1 fresh weight in the antioxidant activity evaluated by ABTS and DPPH. Correa-Gordillo, Ortiz, Larrahondo, Sánchez-Mejia, and Pachón (2012) report a value of 70.4 mgAAE·100 g-1 fresh weight with the FRAP method in the cultivar ‘Elita’ in Colombia. In the present work, some Soconusco fruits showed higher values than those reported in the literature, which could be useful in the selection of materials that provide greater antioxidant activity.
Cluster analysis
The cluster analysis grouped the 28 trees into four groups (Figure 1) according to Hotelling's t 2 pseudostatistical test, where the cut-off line was at a value of approximately 0.05 of semi-partial R2. The groups were formed as follows: the first by six trees from Tapachula, the second by seven collections from Huehuetán and one from Tapachula, the third by six genotypes from Mazatán and four from Cacahuatán, and the fourth by three materials from Cacahuatán and one from Mazatán (Figure 1). These results suggest that there is a low flow of materials between the municipalities of Huehuetán and Tapachula, and a higher flow between the municipalities of Mazatán and Cacahuatán. To corroborate the groupings, a resubstitution analysis was performed, which indicated that all individuals undoubtedly belong to the assigned group.

Canonical discriminant analysis
Total variance was expressed by the first three canonical variables, where the first (Can1) explained 94.61 % of the total variance, the second (Can2) 4.27 % and the third (Can3) 1.12 %.
In Can1, fruit, pulp, peel and rachis weight, pulp chromaticity and fruit length were positively correlated, and total phenols and antioxidant activity (DPPH and ABTS) were negatively correlated (Table 3). For Can2, a positive association was observed with fruit diameter and a negative association with peel chromaticity (Table 3). The variables firmness, peel brightness and total sugars content were positively associated with Can3 (Table 3).
Table 3 Eigenvectors of 20 fruit variables of the first three canonical variables of 28 soursop genotypes.
| Variable | Can1 | Can2 | Can3 |
|---|---|---|---|
| Fruit weight | 0.708885 | 0.464295 | -0.259568 |
| Pulp weight | 0.737251 | 0.416958 | -0.234229 |
| Peel weight | 0.76604 | 0.346653 | -0.293005 |
| Seed weight | 0.596983 | 0.100596 | -0.007413 |
| Rachis weight | 0.757735 | 0.41915 | -0.171996 |
| Number of seeds | 0.688398 | 0.17977 | 0.112835 |
| Fruit length | 0.779101 | 0.469495 | -0.138311 |
| Fruit diameter | 0.626454 | 0.570166 | -0.246172 |
| L* in pulp | -0.440447 | 0.410837 | -0.296177 |
| C* in pulp | 0.744004 | -0.52392 | 0.167808 |
| h in pulp | 0.131205 | -0.275811 | -0.229948 |
| L* in peel | -0.446092 | -0.098935 | 0.353686 |
| C* in peel | 0.696096 | -0.55098 | 0.20874 |
| h in peel | 0.442075 | -0.141698 | 0.077646 |
| Firmness | -0.025842 | -0.287884 | 0.350205 |
| Total soluble solids | -0.68088 | -0.359307 | -0.004883 |
| Acidity | -0.341325 | -0.305016 | -0.15204 |
| Total sugars | -0.220678 | -0.220592 | 0.432411 |
| Total phenols | -0.838849 | -0.069711 | -0.171377 |
| DPPH | -0.751357 | -0.104961 | -0.225982 |
| ABTS | -0.716337 | -0.241659 | -0.13296 |
| FRAP | -0.685641 | -0.465317 | -0.12595 |
DPPH, ABTS and FRAP = antioxidant activity by the 2,2-diphenyl-1-picrylhydrazyl (DPPH) free radical, 2,2’-azino-bis(3-ethylbenzothiazoline-6-sulfonic acid) (ABTS) and ferric reducing ability of plasma (FRAP) methods.
Evangelista-Lozano et al. (2003) concluded that the first canonical function helped to shape the groups by the number of fruits per tree and the brightness of the fruits, while the second discriminant function was explained by trunk thickness and fruit acidity. According to studies related to the search for variables that allow the detection of outstanding materials and their subsequent genetic improvement, the most important variables are associated with weight, fruit dimensions, nutraceutical properties, peel chromaticity and brightness, sugars content and fruit acidity.
In the present study, group 1 integrated genotypes with higher weight (> 1.5 kg) of both the fruit and their structures (pulp, peel and rachis); they had opaque pulp and longer fruit length, but low phenol content and antioxidant activity (Table 4). Group 2, on average, exceeded 1.2 kg in fruit weight, and the weight of its structures was proportional; the purity of the pulp color was higher, but it showed lower phenol content and antioxidant activity (Table 4). Groups 3 and 4 are made up of fruits that weighed between 375 and 674 g, with opaque pulp but high phenol content and antioxidant activity (Table 4).
Table 4 Average values of 20 fruit variables in the groups identified by hierarchical cluster analysis of 28 soursop genotypes.
| Variable | Group | |||
|---|---|---|---|---|
| 1 | 2 | 3 | 4 | |
| Fruit weight (g) | 1,579.97 | 1,243.04 | 674.88 | 375.62 |
| Pulp weight (g) | 850.66 | 711.25 | 376.98 | 213.91 |
| Peel weight (g) | 365.11 | 321.33 | 166.51 | 126.33 |
| Seed weight (g) | 69.86 | 83.3125 | 39.05 | 18.27 |
| Rachis weight (g) | 70.77 | 61.22 | 33.69 | 16.52 |
| Number of seeds | 112.72 | 131.43 | 78.3 | 31.20 |
| Fruit length (mm) | 20.625 | 18.98 | 14.89 | 11.66 |
| Fruit diameter (mm) | 11.65 | 10.22 | 8.98 | 7.87 |
| L* pulp | 62.53 | 48.25 | 57.50 | 59.91 |
| C* pulp | 10.53 | 63.71 | 14.35 | 14.53 |
| h pulp | 75.62 | 79.18 | 73.50 | 80.40 |
| L* peel | 31.04 | 33.00 | 42.51 | 39.15 |
| C* peel | 14.31 | 59.47 | 20.90 | 20.62 |
| h peel | 73.31 | 80.04 | 72.08 | 70.29 |
| Firmness (N) | 1.93 | 2.93 | 2.95 | 2.64 |
| Total soluble solids (°Brix) | 6.82 | 7.16 | 9.46 | 11.83 |
| Acidity (%) | 0.51 | 0.53 | 0.55 | 0.64 |
| Total sugars (g·100 g-1 fresh weight) | 48.71 | 78.20 | 98.35 | 79.91 |
| Total phenols (mgGAE·100g-1 fresh weight) | 2.42 | 1.91 | 2.80 | 3.42 |
| DPPH (mgAAE·100 g-1) | 42.41 | 30.90 | 49.63 | 67.36 |
| ABTS (mgAAE·100 g-1) | 65.72 | 56.69 | 88.94 | 123.11 |
| FRAP (mgAAE·100 g-1) | 46.91 | 51.40 | 66.46 | 94.78 |
GAE = gallic acid equivalent; AAE = ascorbic acid equivalent; DPPH, ABTS and FRAP = antioxidant activity by the 2,2-diphenyl-1-picrylhydrazyl (DPPH) free radical, 2,2'-azino-bis(3-ethylbenzothiazoline-6-sulfonic acid) (ABTS) and ferric reducing ability of plasma (FRAP) methods.
Figure 2 clearly shows the separation of the accessions generated from the canonical variables, where groups 1 and 2 were in the positive part of Can1, while groups 3 and 4 remained in the negative part. This means that the genotypes of groups 1 and 2 had higher fruit, pulp, peel and rachis weight, and longer fruit length, in addition to higher values in pulp chromaticity, but lower total phenol content and antioxidant activity with DPPH and ABTS compared to groups 3 and 4. In Can2, groups 1 and 3 were located on the positive axis, while groups 2 and 4 were in the negative zone. This means that groups 1 and 3 had greater fruit diameter and lower C* value in peel than the trees of groups 2 and 4. Finally, in Can 3, groups 2 and 3 were located in the positive part of this root, and groups 1 and 4 in the negative part; for this reason, groups 2 and 3 had higher values of peel brightness, fruit firmness and total sugars content than groups 1 and 4.
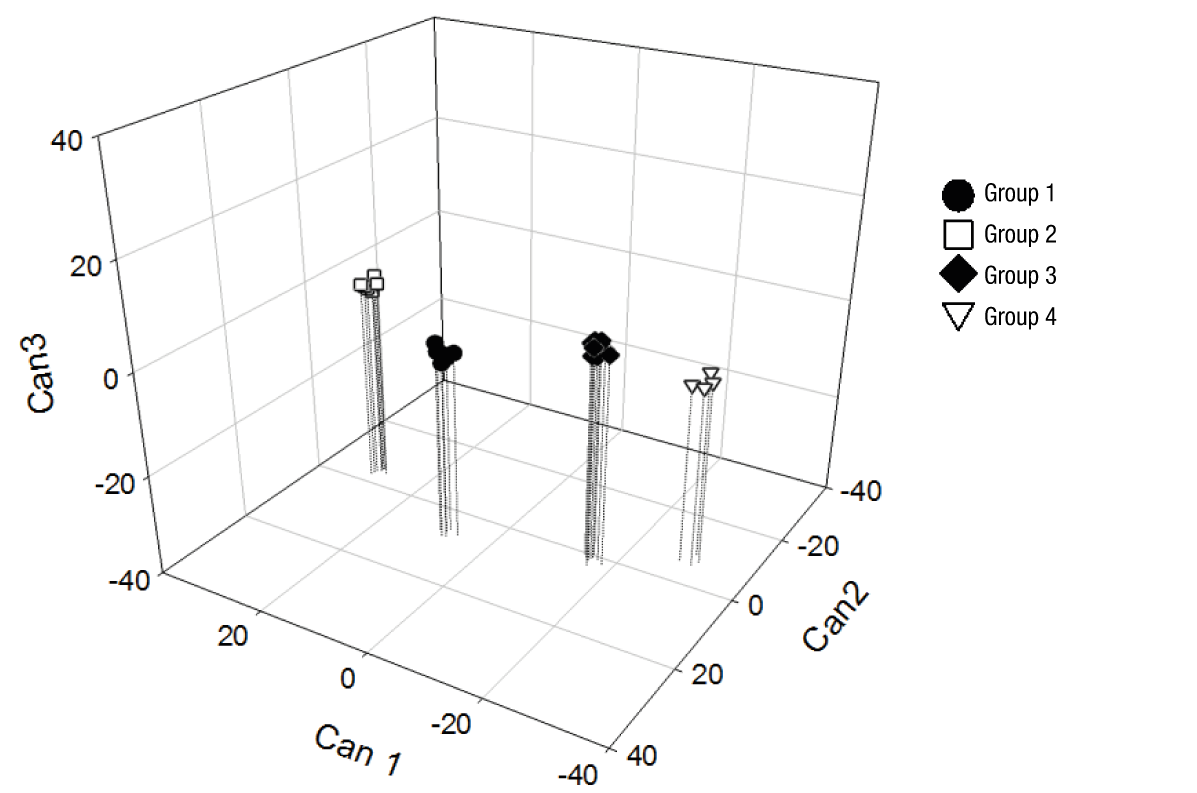
Figure 2 Three-dimensional representation of the grouping of 28 soursop (Annona muricata L.) accessions from Chiapas from the canonical discriminant variables.
The results obtained suggest that the trees of groups 1 and 2 are associated with higher productivity due to their greater weight and fruit dimensions. On the other hand, the genotypes of groups 3 and 4 are those that provide higher total phenol content, greater antioxidant activity and better organoleptic traits, with higher total sugars content.
Conclusions
The soursop genotypes evaluated showed high variability in traits of interest to the fresh market (groups 3 and 4) and industry (groups 1 and 2). The most useful variables to distinguish the materials were weight, fruit dimensions, nutraceutical properties, peel chromaticity and brightness, sugars content and fruit acidity. Hybridization of individuals in groups 1 and 2 with individuals in groups 3 and 4 can be a good genotechnical strategy and have good prospects for the segregation of individuals with better traits within a breeding program.

