


 texto em
  Inglês (pdf)
 Artigo em XML
 Referências do artigo
 Enviar este artigo por email
 Citado por SciELO
  Similares em
SciELO
Similares em
SciELO 
 Permalink
Introduction
Mexico is the world's leading exporter of tomato, and in 2016 it contributed 25.11 % of the value of world tomato exports, accounting for 90.67 % of U.S. imports and 65.31 % of Canada’s (Secretaría de Agricultura, Ganadería, Desarrollo Rural, Pesca y Alimentación [SAGARPA], 2017). According to Fideicomisos Instituidos en Relación con la Agricultura (FIRA, 2017), the red tomato is the main vegetable produced under protected agriculture (shade net and greenhouses) in Mexico (70 %). The area established with this system increased from 1,973 to 15,198 ha between 2007 and 2017, with an average annual growth rate of 22.7 % (FIRA, 2019).
Tomato yields vary significantly between producers, varieties, state of the republic and type of technology used. For example, Ortega-Martínez et al. (2010) found yields ranging from 7.3 to 25 kg·m-2 in greenhouse tomato grown with different substrates, the best being sawdust. Núñez-Ramírez et al. (2017), in an experiment with tomato grown in mulch and with drip irrigation under greenhouse conditions in Sonora, Mexico, reported tomato yields ranging from 17 to 20.6 kg·m-2 with different doses of N (250 to 1,000 kg·ha-1). In a continuous production scheme with three to four cycles per year, Sánchez-del Castillo, Bastida-Cañada., Moreno-Pérez, Contreras-Magaña, and Sahagún-Castellanos (2014) report yields of up to 600 t·ha-1·year-1 for tomato. From 2015 to 2017, Saladette tomato yields increased from 173.3 to 176.7 t·ha-1·year-1 in greenhouse production, and from 34.3 to 36.1 t·ha-1·year-1 in open field production (FIRA, 2016, 2019).
The performance of production systems in protected agriculture can be measured through various indicators. According to Carro-Paz and González-Gómez (2016), productivity is an index that relates outputs or products to the inputs needed to generate such production. Partial productivity relates total production or output to one of the resources used.
There are two indices to denote water use by crops defined by Nederhoff and Stanghellini (2010). The first is product water use (PWU), which is the volume of water used by the plant during the entire production cycle to generate one kilogram of fresh product (L·kg-1). The second, which is the inverse of the previous one, is called water use efficiency (WUE), although some authors call it water productivity, and it is the production in kilograms divided by the amount of water used by the crop (kg·m-3). Water is used efficiently when PWU is low and WUE is high. Some PWU values for tomato are reported in Table 1, and range from 4 to 300 L·kg-1, which corresponds to WUE values between 250 and 3.33 kg·m-3. For the purposes of this study, the WUE index will be used.
Table 1 Liters of water used per kilogram of tomato produced (WUE).
| Production method | Country | PWU (L·kg-1) |
|---|---|---|
| Open field, general | Various | 100-300a |
| Open field, drip irrigation | Israel | 60a,b |
| Open field | Almería, Spain | 50-60a |
| Open field, drip irrigation, substrate: cocopeat + perlite + vermiculite (50:25:25) | Saidapur, India | 11.99c |
| Unheated plastic greenhouses | Israel, Spain | 30-40a |
| Unheated parral-type plastic greenhouse | Spain | 40b |
| Unheated parral-type plastic greenhouse with regulated ventilation | Spain | 27b |
| Heated glasshouse | Israel | 30b |
| Glasshouses with climate control and CO2 enrichment | The Netherlands | 22a,b |
| As above but with hydroponic system and reuse of drainage water | The Netherlands | 15a,b |
| As above but with closed hydroponic system | The Netherlands | 4a |
Source: a) Nederhoff and Stanghellini (2010); b) van Kooten, Heuvelink, and Stanghellini (2008); c) Parameshwarareddy, Angadi, Biradar, and Patil (2018).
Rashidi and Gholami (2008), in experiments with tomato over 20 years in Iran, report a range of 2.58 to 11.88 kg·m-3 in WUE, whereas Nederhoff and Stanghellini (2010) note a WUE of 5.43 kg·m-3 (184 L·kg-1) in the same crop, for an average of 65 countries from 1997 to 2001, although the authors do not mention whether that average is for developed or underdeveloped countries. In a study conducted in Cuba, González-Robaina, Herrera-Puebla, López-Seijas, and Cid-Lazo (2014) report a WUE between 12.9 and 45.4 kg·m-3 in tomato. Likewise, Liu, Hu, Feng, Wang, and Yang (2019) in their research on open field tomato growth, under different potassium levels in a province of China, obtained productivities in a range of 20.28 to 24.33 kg·m-3.
The WUE figures for tomato cultivation depend on several factors, among them the technology level, as shown in Table 1 where the amount of irrigation water needed to produce 1 kg of fresh tomato, from different farming systems, is broken down. With the most advanced technology, only 4 L of water are required to produce 1 kg of tomato. Figure 1 shows a summary of water use and productivity for seven technological levels of tomato production, obtained from a simulation model based on physical equations that describe the heat and mass flows associated with greenhouse tomato production established by Elings, Campen, Nieves-García, and van der Valk (2013) for the conditions of Aguascalientes, Mexico. As the technological level increases, water use decreases and water use productivity increases, which is more noticeable when going from medium technological level 5 (M5) (51.9 kg·m-3) to the high technological level (A) (168.2 kg·m-3); the only difference between the two was that at level A thermal screens and mechanical cooling were added.
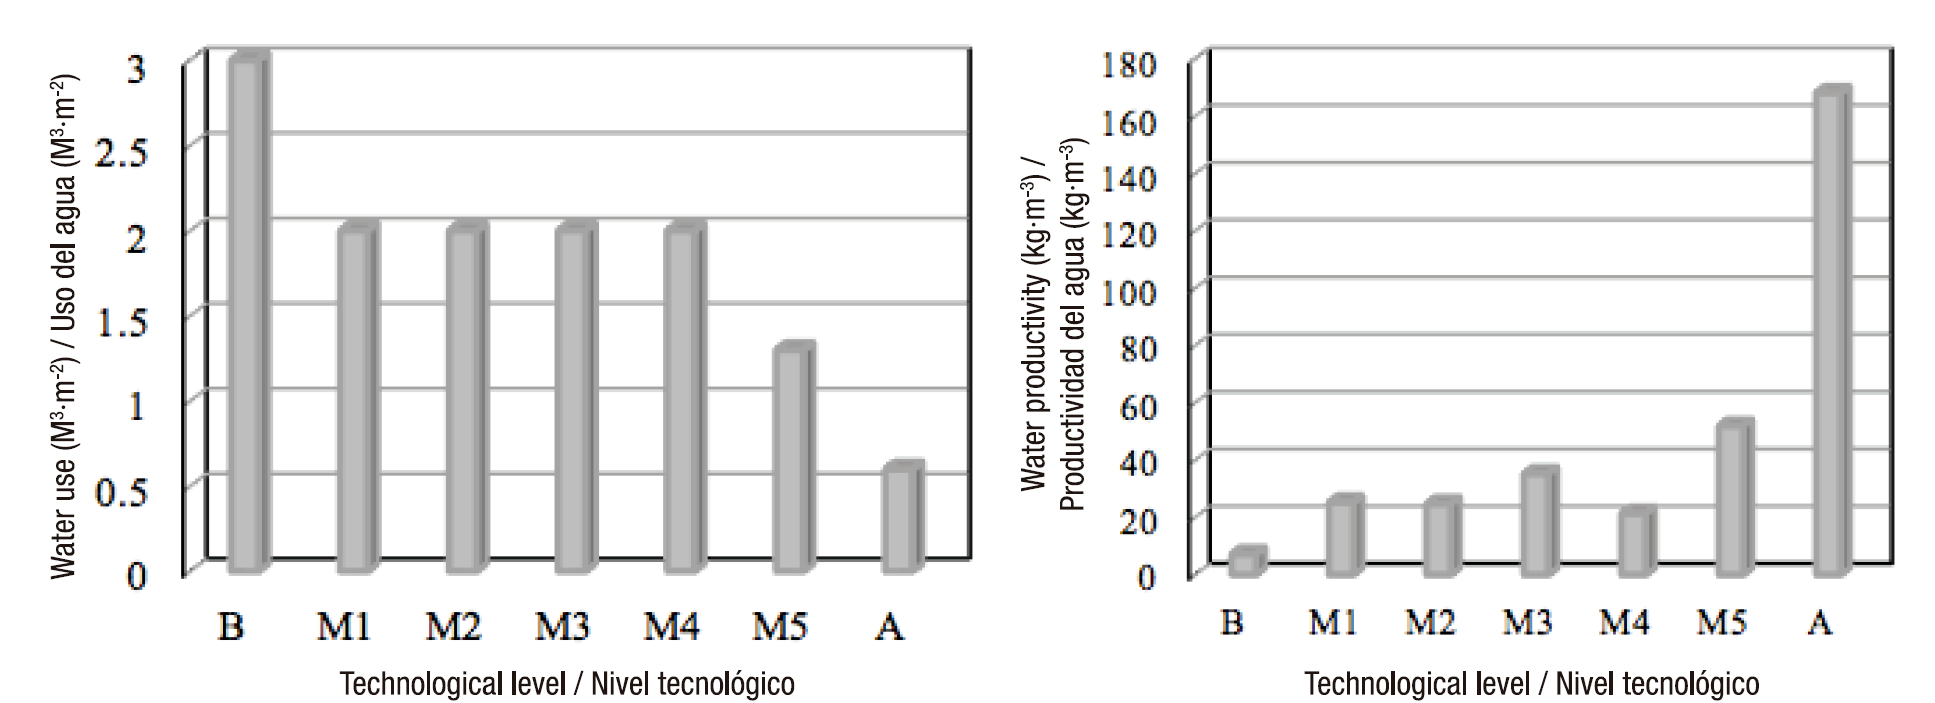
Figure 1 Water use and productivity in tomato cultivation with different technologies. Technological level: B = low (P, V, G), M1 = medium 1 (P, H, V, S), M2 = medium 2 (P, H, V, S, TS), M3 = medium 3 (P, HP, V, S, CO2), M4 = medium 4 (P, HP, E, S), M5 = medium 5 (G, HP, V, R, CO2), A = high (D, HP, M, TS, CO2). Where, covering: P = plastic, G = glass, D = diffuse glass; heating: H = air heaters, HP = heating pipes; cooling: V = ventilation, E = evaporative cooling, M = mechanical cooling; substrate: G = soil, S = substrate, R = substrate with reuse of water; TS = thermal screens; CO2 = CO2 enrichment. Source: Author-made with data from Elings et al. (2013).
Another fundamental resource in greenhouse production, besides water, is energy, which depends on the climatic needs within the greenhouse for each crop, the varieties, the time of year and the physiological state of the plants.
There are two approaches to measuring performance in energy use; the first considers the energy used in the production of inputs (such as seeds, herbicides, fertilizers, etc.), with the indicators being: 1) the energy use ratio (EUR), which is the amount of energy recovered in MJ through the product obtained for each MJ used in inputs (MJ·MJ-1), 2) the energy productivity (EP), expressed in kg of product per MJ used (kg·MJ-1), and 3) the specific energy (SE), which is the inverse of the previous one measured in MJ·kg-1. The second approach considers the energy use efficiency (EUE) indicator, which is the ratio between the energy expenditure on electricity and fuel in MJ used in the production process (MJ·kg-1).
The first approach is applied by Dimitrijević, Blažin, Blažin, and Ponjičan (2015), who report an EP of 0.65 kg·MJ-1 and an EUR of 0.52 MJ·MJ-1 for a tunnel-type greenhouse with tomato cultivation in Serbia. Pahlavan, Omid, and Akram (2011) report an EUR of 0.001 MJ·MJ-1 in tomato production, where the inputs used were labor, fertilizers, herbicides, electricity and machinery. Likewise, Sepat, Sepat, Sepat, and Kumar (2013) report yields of 29 kg·m-2 in greenhouse tomato production, with an EUR of 1.36 MJ·MJ-1 and SE of 2.42 MJ·kg-1. Shamsabadi, Abedi, Ahmad, and Taheri-Rad (2017), in a study conducted in four provinces of Iran, one under open field conditions and three under greenhouse conditions, found that the EUR was between 0.59 and 1.48 MJ·MJ-1, while the EP was between 0.74 and 1.38 kg·MJ-1.
In the second approach, the EUE is defined by Dannehl, Schuch, and Schmidt (2013) as the amount of energy required to produce 1 kg of commercial fruit expressed in MJ·kg-1. The EUE, although it has the same units as the specific energy in the first approach, does not consider the energy consumed in the preparation of inputs such as fertilizers, seeds, herbicides, etc. The same authors calculated an average EUE of 40 MJ·kg-1, considering the consumption of electricity and fuel in heating and cooling systems for one year of tomato production in a high-tech glasshouse located in Berlin, Germany. Furthermore, these authors obtained an EUE of -1.41 MJ·kg-1 in a solar collector greenhouse with heat pumps, and they report an EUE of 1.97 MJ·kg-1 in unheated greenhouses in Spain.
Elings et al. (2013), in a simulation established for the conditions in Aguascalientes, Mexico, found that the EUE is 1.98 MJ·kg-1 for low-tech greenhouses, between 14.92 and 11.49 MJ·kg-1 for medium-tech greenhouses and 25.64 MJ·kg-1 for high-tech greenhouses. The EUE decreases as the technology level increases due to the high energy use in absolute terms (Figure 2). When going from level M5 to A, energy use increases dramatically from 778 to 3,465 MJ·m-2·year-1; due to the use of mechanical cooling and thermal screens, energy use efficiency is highest at the lowest technology level and lowest at the highest one.
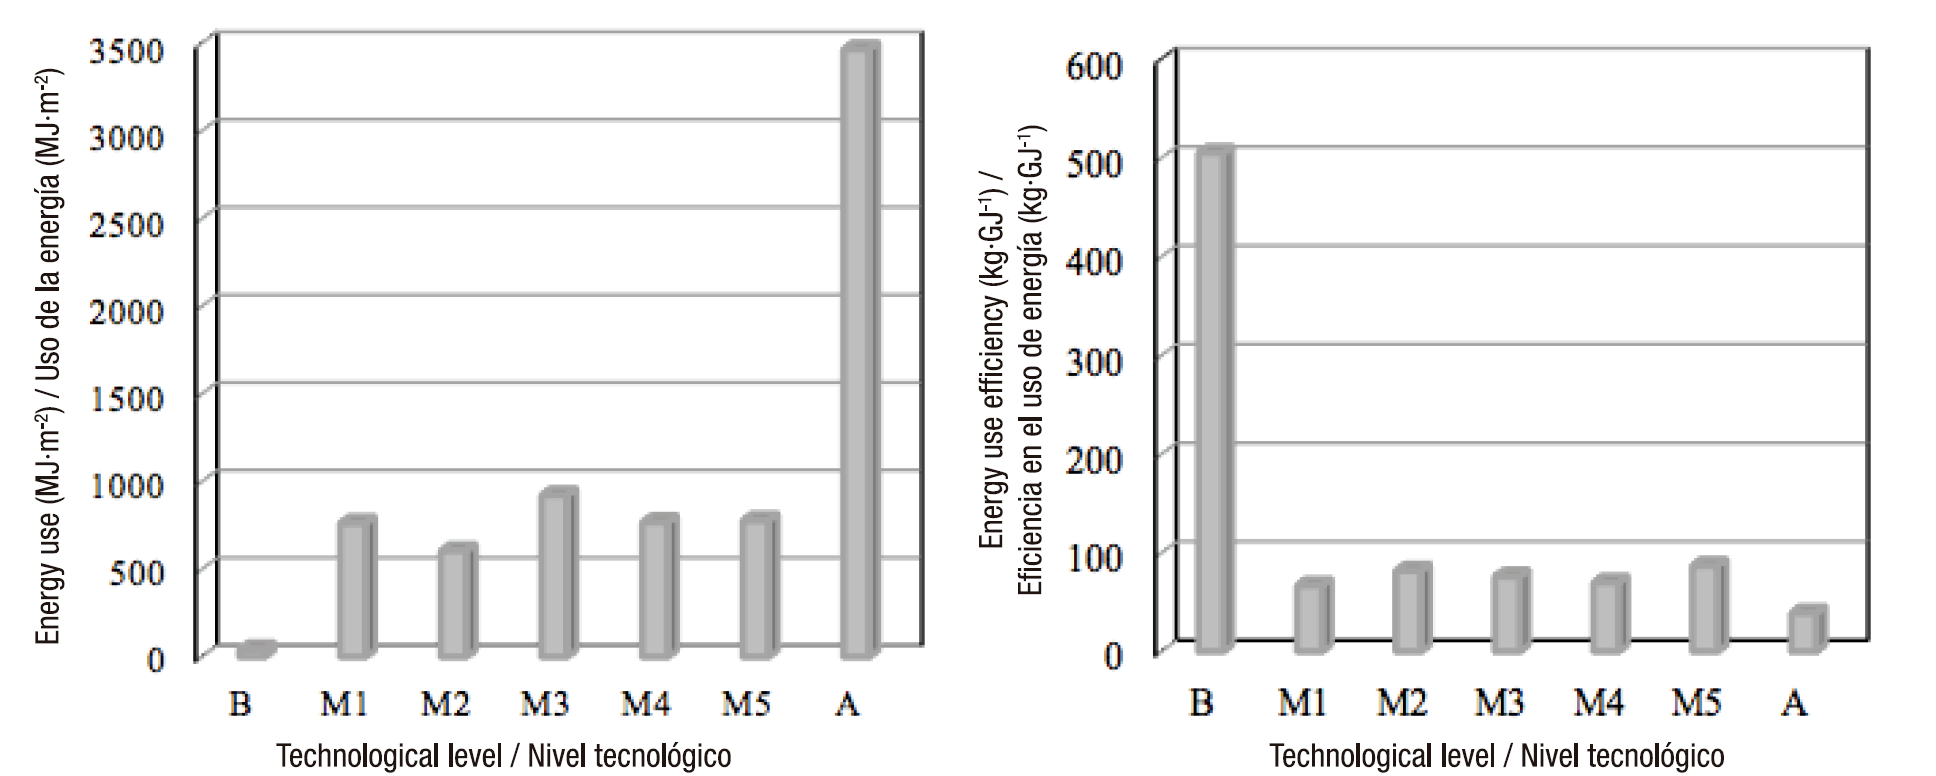
Figure 2 Energy use and efficiency in tomato production in greenhouses with different technologies. Technological level: B = low (P, V, G), M1 = medium 1 (P, H, V, S), M2 = medium 2 (P, H, V, S, TS), M3 = medium 3 (P, HP, V, S, CO2), M4 = medium 4 (P, HP, E, S), M5 = medium 5 (G, HP, V, R, CO2), A = high (D, HP, M, TS, CO2). Where, covering: P = plastic, G = glass, D = diffuse glass; heating: H = air heaters, HP = heating pipes; cooling: V = ventilation, E = evaporative cooling, M = mechanical cooling; substrate: G = soil, S = substrate, R = substrate with reuse of water; TS = thermal screens; CO2 = CO2 enrichment. Source: Author-made with data from Elings et al. (2013).
Technological advances have also increased labor productivity, as shown by Ríos-Flores et al. (2010) in a study on corn cultivation in Lerdo City, Durango, Mexico. In that study, labor productivity increased from 14.6 to 20.8 kg·h-1 in the periods 1990 to 1992 and 2004 to 2006, which means a 43 % increase in physical product per hour. The same authors mention that labor productivity, measured as the yield per hectare among the number of workers, in high-tech systems is 74 kg of maize per worker, while in a low-tech system it falls to 26 kg of corn per worker.
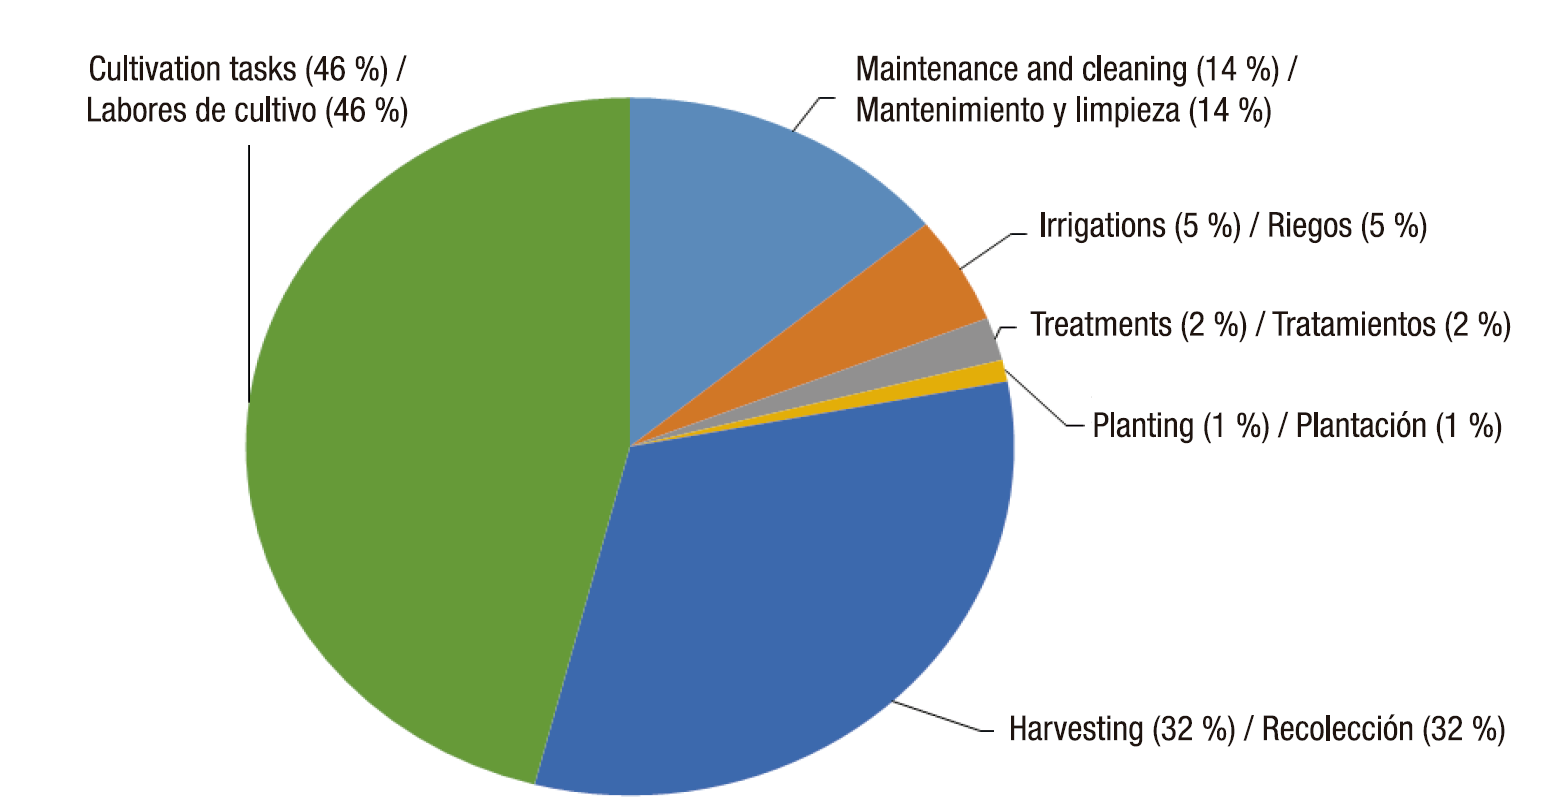
According to Pérez-Mesa, de Pablo-Valenciano, and Escudero-Moreno (2004), in a study conducted in Almería, Spain, in a plastic greenhouse with tomato cultivation, labor accounted for almost 35 % of total operating costs, and 60 % of the workforce was engaged in tasks such as pruning, tutoring and cleaning in the greenhouse. Figure 3 shows the percentage of labor used in different operations in a greenhouse, for a total of 3,900 h·ha-1 (Pérez-Mesa et al., 2004).
Given the importance of tomato cultivation in Mexico, it is essential to consider not only the increase in yields per unit of area, but also the increase in the use of resources in the production process; for this reason, the objectives of this work were: 1) to estimate water, energy and labor productivity in tomato production, for an experimental greenhouse located at Chapingo Autonomous University; 2) to identify the production inputs that consume the greatest amount of energy, in order to improve some management aspects in the production of this crop.
Materials and methods
The present study was carried out in a sawtooth-type polyethylene greenhouse 8 m wide and 15 m long (120 m2), with two side windows and two zenithal windows, all with anti-insect mesh (Figure 4), located at Chapingo Autonomous University (19° 29’ NL and 98° 53’ WL, at 2,240 masl.).
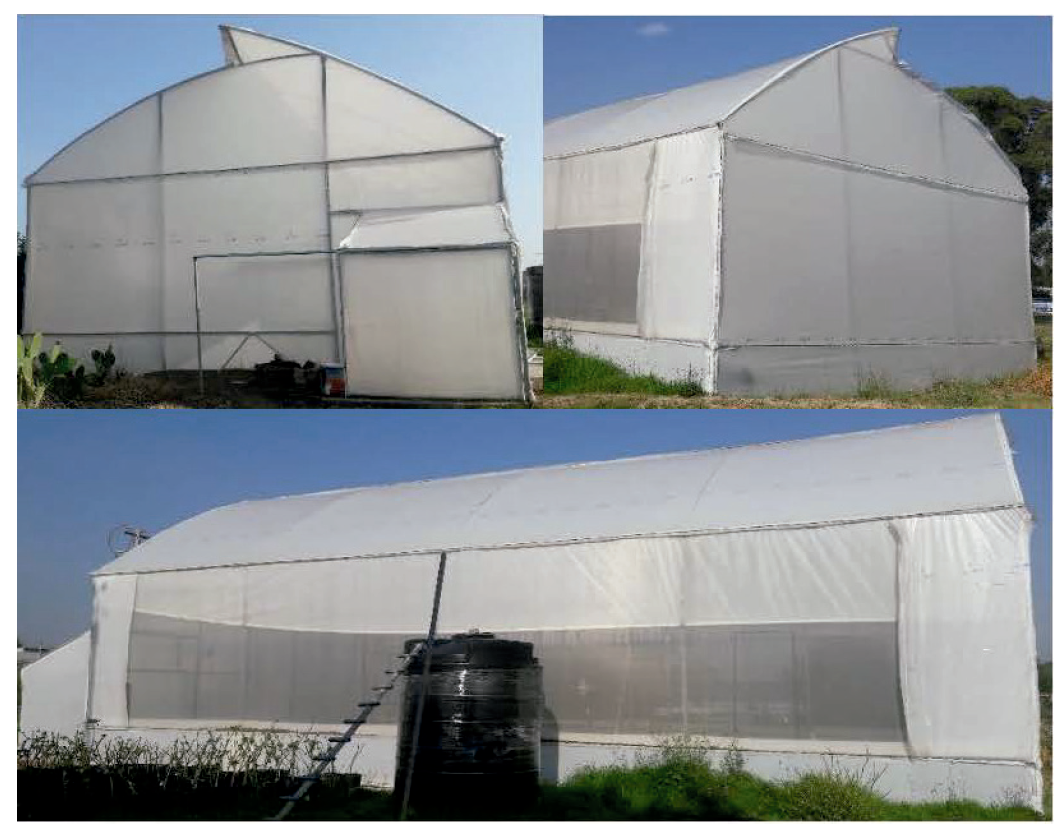
Figure 4 Sawtooth-type experimental greenhouse with drip irrigation located at Chapingo Autonomous University, 2016.
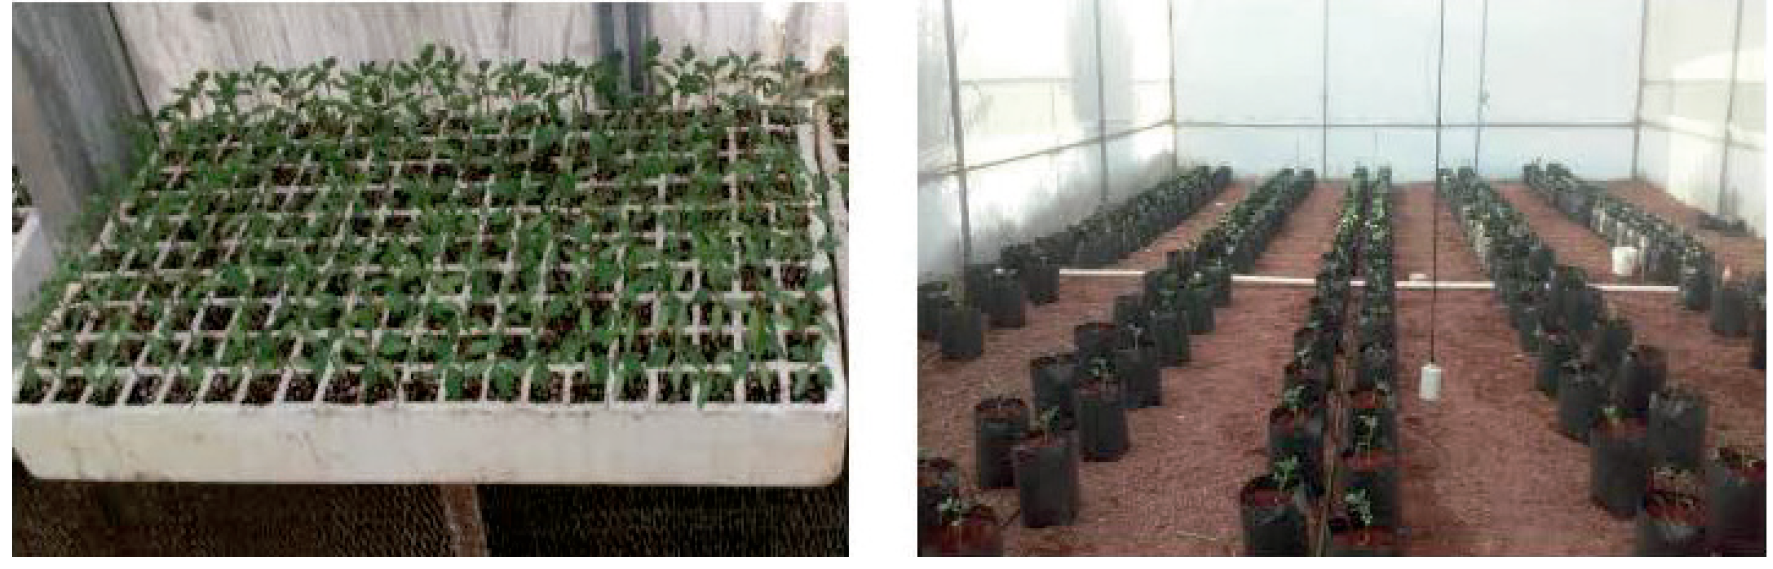
Sowing of the commercial Saladette-type tomato (Solanum lycopersicum) hybrid ‘El Cid F1’ (purchased at the “El Field” agro-inputs store) was carried out on March 6, 2016 in 200-cavity polystyrene trays. One tomato seed was placed in each tray cavity, covered with 0.5 cm of peat moss substrate and watered manually. On March 22, 2016, the seedlings emerged, and transplantation was carried out on April 24 in 10 L bags at a distance of 30 cm between each bag and 80 cm between rows, with a density of 3.5 plants·m-2; volcanic rock (tezontle) was used as substrate (Figure 5). Irrigation was carried out manually in the first days; after transplantation, a drip fertirrigation system with PVC valves and 16 mm tubing with 8 L·h-1 dripper capacity and a four-outlet distributer was used. Twelve irrigations were performed per day, increasing the irrigation time according to the phenological stage (Figure 6). Steiner nutrient solution was used for fertilization (Steiner, 1980).

The plants were tutored ten days after transplanting, followed by pruning in order to have better lighting, which also facilitated ventilation. As for phytosanitary control, there were only problems with whitefly, which was controlled with an insecticide.
On May 8, when the first flower clusters emerged, manual pollination began, which consists of gently moving the strings that were placed on the trellis to allow the pollen to fall on the stigmas of the flower. This activity was carried out daily before midday throughout the flowering stage.
It should be noted that the experiment carried out had several purposes: 1) to build a dynamic energy balance model for a greenhouse with tomato cultivation (Salazar-Moreno, López-Cruz, & Sánchez-Cruz, 2019), 2) to simulate the behavior of the nitrogen absorbed by the crop using the HortSyst mathematical model (Martínez-Ruiz, López-Cruz, Ruiz-García, Pineda-Pineda, and Prado-Hernández, 2019) and 3) to determine the water, energy and labor productivity in tomato production, which was the objective of the present study.
Water productivity and product water use are calculated for a certain unit of area, which can be hectares or square meters (Equations 1 and 2; Nederhoff & Stanghellini, 2010; Parameshwarareddy et al., 2018).
The daily amount of water applied to the crop in m3 was obtained considering the water consumption in the drippers (8 L·h-1), the number of irrigations per day and the period of time in which the system was on.
In order to monitor the climate in the greenhouse, a HOBO weather station was installed in the center of the greenhouse to measure air temperature and relative humidity. With the data obtained, the vapor-pressure deficit (VPD) during the crop cycle was calculated from the following equations proposed by The Institute of Measurement and Control (1996) for temperatures between -45 and 60 °C:
where t a is the air temperature (oC), RH is the relative humidity (%), e s is the saturation vapor pressure (kPa), e a is the vapor pressure at air temperature (kPa) and VPD is the vapor-pressure deficit (kPa).
To evaluate energy use performance, the indicators described by Djevic and Dimitrijević (2004) and Pahlavan et al. (2011) were used and are described below:
The above indices include two types of energy inputs: indirect energy in seeds, fertilizers, herbicides, pesticides, and direct energy that includes labor, electricity and irrigation. The amount of each of the mentioned inputs was counted throughout the crop cycle, as well as the tomato production (kg), and the equivalents in MJ were obtained from the information in Table 2.
Table 2 Inputs used in a tomato production cycle and their energy equivalents.
| Inputs | Units | Amount in 120 m2 | Energy equivalent (MJ per unit) | Total energy (MJ) | Used (%) |
|---|---|---|---|---|---|
| Water for irrigation | m3 | 82.15 | 1.028a | 84.45 | 1.22 |
| Labor | h | 758 | 1.95a | 1,478.10 | 21.38 |
| Seeds | kg | 0.00189 | 1b | 0.00 | 0.00003 |
| Single-phase motor | kW·h-1 | 18.29 | 3.6a | 65.84 | 0.95 |
| Stink bug insecticide | kg | 0.10 | 101.2b | 10.12 | 0.15 |
| Calcium nitrate | kg | 51.74 | 66.14c | 3,422.08 | 49.49 |
| Potassium nitrate | kg | 22.37 | 66.14c | 1,479.32 | 21.40 |
| Potassium sulfate | kg | 19.45 | 11.15a | 216.89 | 3.14 |
| Magnesium sulfate | kg | 18.74 | 1.12b | 20.99 | 0.30 |
| Macroelements | kg | 0.40 | 120b | 48.00 | 0.69 |
| Phosphoric acid | kg | 5.85 | 13.07a | 76.46 | 1.11 |
| Sulfuric acid | kg | 0.90 | 1.12b | 1.98 | 0.03 |
| Boron | kg | 0.09 | 120b | 10.80 | 0.16 |
| Total inputs | 6,913.84 | 100.00 | |||
| Tomato production | kg | 2,288.94 | 0.8c | 1,831.15 |
Source: a) Moradi, Moghaddam, and Mansoori (2015), b) Sepat et al. (2013) and c) Pahlavan et al. (2011).
Labor productivity was obtained with Equation 9.
In order to count the number of hours spent on tomato production, a daily record was kept of the people who worked on the tomato crop, each one recording their daily workday by noting the time of entry and exit.
Results and discussion
Figure 6 shows the developed tomato crop and the start of the harvest. The consumption of inputs during a production cycle, from April 24 (transplant) to October 16, 2016, is reported in Table 2, as well as the corresponding energy equivalence according to several authors.
Tomato production yields were 19.07 kg·m-2, above the yields reported by FIRA (2019) of 17.67 kg·m-2 under greenhouse conditions in Mexico, but below those reported by Elings et al. (2013) of 21.6 kg·m-2 in the simulation carried out for low-tech greenhouses.
Table 3 shows the total irrigation volume per day during a tomato production cycle. The variation in water per day is due to the phenological stage of the crop, and if one day there was no water in the runoff container, irrigation was increased by 1 min.
Table 3 Total irrigation volume in 120 m2 for tomato production with a density of 3 plants·m-2.
| Date | Phenological stages | Total days | Water volume per day (m3) | Total water volume (m3) | L·m-2·day-1 |
|---|---|---|---|---|---|
| April 30 - May 18 | VD1 | 19 | 0.168 | 3.192 | 1.4 |
| May 19 - June 5 | VD - F | 18 | 0.336 | 6.048 | 2.8 |
| June 6 - July 9 | F | 34 | 0.504 | 17.136 | 4.2 |
| July 10 - July 24 | F | 15 | 0.672 | 10.08 | 5.6 |
| July 25 - August 14 | F | 21 | 0.504 | 10.584 | 4.2 |
| August 15 - September 3 | FR | 20 | 0.672 | 13.44 | 5.6 |
| September 4 - October 16 | FR | 43 | 0.504 | 21.672 | 4.2 |
| Total | 82.152 |
1VD = vegetative development; F = flowering; FR = fruiting. Source: Author-made.
The calculated WUE in the experimental greenhouse was 27.86 kg·m-3. This figure is higher than the one found by Elings et al. (2013) of 7.2 kg·m-3 for low-tech greenhouses where the crop is grown in the soil, but it is within the range of 24.7 to 35.2 kg·m-3 for the medium 2 (M2) (plastic greenhouse with heating system and thermal screens) and medium 3 (M3) (plastic greenhouse with heating system and CO2 enrichment) technological levels.
The WUE obtained is equivalent to 35.89 L·kg-1, which is within the PWU range reported by van Kooten et al. (2008) for unheated plastic greenhouses (30 to 40 L·kg-1). In more recent studies on open field tomato with a drip irrigation system, Parameshwarareddy et al. (2018) found that the highest WUE (83.37 kg·m-3) was obtained when using a substrate mixture containing cocopeat + perlite + vermiculite (50:25:25).
In this study, daily water consumption during plant development ranged from 1.4 to 5.6 L·m-2·day-1 (Table 3). The water consumed by the plant during the production cycle was 195 L, a high figure compared to that obtained by Parameshwarareddy et al. (2018) of 20.83 and 37.65 L·plant-1.
During the period of highest temperatures, from June 18 to August 26, the average VPD was 0.33 kPa, less than the optimal range reported by Shamshiri et al. (2018) for greenhouse tomato cultivation (0.47 to 1.27 kPa). Some authors such as Na, Michiko, Kozai, and Wataru (2015) report VPD values of 1.8 kPa during midday in winter for greenhouse tomato cultivation. The value obtained means that the plant was not stressed.
According to Table 2, the highest energy consumption during the tomato production cycle corresponded to Calcium nitrate and Potassium nitrate, which coincides with the findings of Martínez-Ruiz et al. (2019), who mention that approximately 50 % of the fertilizer applied in their experiment may have been wasted.
The EUR was 0.2648 MJ·MJ-1, a result higher than that reported by Pahlavan et al. (2011) of 0.001 MJ·MJ-1, but lower than the results reported by Dimitrijević et al. (2015), Shamsabadi et al. (2017) and Sepat et al. ( 2013) of 0.52, 1.16 and 1.36 MJ·MJ-1, respectively. However, the last authors, in addition to considering the tomato fruit as an energy output, also take into account the energy in the leaf litter, which provides 7.5 MJ·kg-1, while the tomato fruit adds 0.8 MJ·kg-1.
On the other hand, EP was 0.331 kg·MJ-1 and its inverse, SE, was 3.02 MJ·kg-1, higher than that reported by Sepat et al. (2013) of 2.42 MJ·kg-1 for greenhouse tomato production. The energy consumption per m2 was 57.61 MJ.
In the second approach, only the electricity consumption of a single-phase motor was considered, so the EUE was expressed as follows:
The above figure is lower than that reported by Dannehl et al. (2013) for a solar collector greenhouse, but higher than that reported for unheated greenhouses in Spain.
Regarding labor, during the tomato production cycle, 758 h of labor were used for an area of 120 m2 and production of 2,288.94 kg of tomato. Figure 7 breaks down the percentage of hours used in each operation.
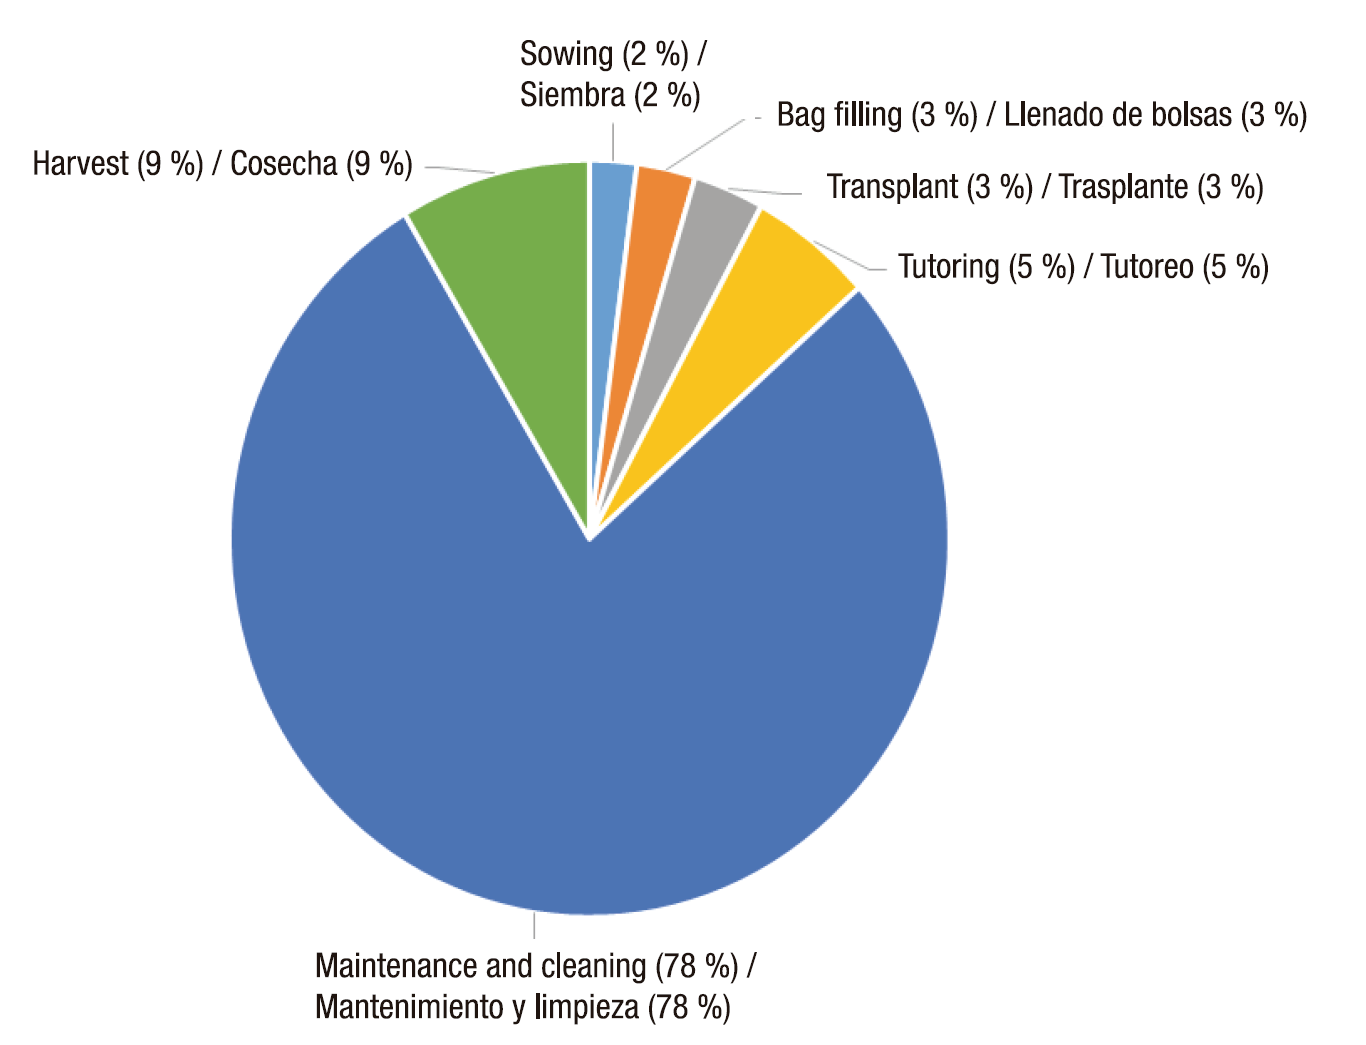
Figure 7 Distribution of working hours used in a tomato production cycle in a sawtooth-type experimental greenhouse.
Maintenance and cleaning occupied 78 % of the workforce during the production cycle, higher than that reported by Pérez-Mesa et al. Labor productivity was 3.019 kg·h-1.
Conclusions
One aspect that should be considered in any production system is its environmental impact resulting from the use of resources, particularly water and energy. Greenhouse production has managed to increase water use productivity, but this has not happened with energy use, where as the technological level increases, greater energy consumption is required for the production of 1 kg of tomatoes.
This study estimated water, energy and labor use productivity in tomato production, and the results indicate that even in low-tech greenhouses, energy consumption is high due to the excessive use of fertilizers. Water use productivity, although within the ranges reported by other authors for low- tech greenhouses, is high compared to closed hydroponic systems in high-tech greenhouses.
Greenhouse tomato production is a labor-intensive activity, especially in terms of maintenance and harvesting. In larger greenhouses, working hours could be reduced by installing a material handling system (mobile systems, wheeled benches) and increasing ventilation.

