


 texto em
  Inglês (pdf)
 Artigo em XML
 Referências do artigo
 Enviar este artigo por email
 Citado por SciELO
  Similares em
SciELO
Similares em
SciELO 
 Permalink
Introduction
Cape gooseberry (Physalis peruviana L.) is a plant native to the Andean region and belongs to the family Solanaceae (Fischer, Ebert, & Lüdder, 2007). Its fruit is a bright yellow berry with a sweet semi-acid flavor (Fischer, Herrera, & Almanza, 2011). It is mainly consumed fresh and nutraceutical properties are attributed to it due to its content of vitamin C and other antioxidant compounds (Gutiérrez, Hoyos, & Páez, 2007). The main producing countries are Australia, Colombia, Ecuador, India, New Zealand, Peru, South Africa and Zimbabwe, while consumers are Germany, Brazil, Belgium, Canada, Spain, the United States of America, France, Holland, England, Italy and Switzerland (Fischer, Almanza, & Miranda, 2014).
In Mexico, there are still no intensive or extensive cape gooseberry production areas; however, it represents an alternative due to its productive potential (Castañeda-Salinas et al., 2013), so it is necessary to study its agronomic management, with an emphasis on mineral nutrition and greenhouse conditions.
In an agricultural production system, mineral nutrition is one of the main factors that must be taken into account, since an excess or deficiency of an element limits the optimal development of the plant, which directly affects its yield (Sánchez, Molinos, Alcántar, & Sandoval, 2009). Martínez, Sarmiento, Fischer, and Jiménez (2008) found 90 % less fruit in cape gooseberry plants that did not receive fertilization with boron or potassium and limited in nitrogen (15% of the complete solution), while the absence of phosphorus decreased yield by 50 % compared to control plants. In this regard, it has been reported that the cape gooseberry plant grows, develops and fructifies adequately with Steiner nutrient solution at 50 and 75 % concentration (Gastelum-Osorio, Sandoval-Villa, Trejo-López, & Castro-Brindis, 2013).
The production environment, such as climate and crop management, influences the productive use time of the cape gooseberry (Mora-Aguilar, Peña-Lomelí, López-Gaytán, Ayala-Hernández, & Ponce-Aguirre, 2006), since under optimal conditions it can last up to six years (Fischer et al., 2014). To achieve this, broad knowledge of plant physiology is indispensable.
Based on the above, growth analysis is used to study the factors influencing plant development and yield (Santos-Castellanos, Segura-Abril, & Ñústez-López, 2010). This analysis uses direct measures such as dry matter weight, which depends on the size and duration of the leaf area (Tekalign & Hammes, 2005), with which the crop growth rate (CGR) can be calculated. This rate is considered an agricultural productivity index that measures a crop’s weight gain per unit area and time (Santos-Castellanos et al., 2010).
Generally, in growth analysis studies of fruit vegetables, mineral nutrition is not considered as a factor of variation (Juárez-Maldonado, de Alba-Romenus, Zermeño-González, Ramírez, & Benavides-Mendoza, 2015; Mazorra, Quintana, Miranda, Fischer, & Cháves, 2003); however, nutrient status influences crop growth and development (Hawkesford et al., 2012). In Mexico, little is known about cape gooseberry production; therefore, the objective of this research was to determine the growth dynamics and yield of cape gooseberry cultivation based on three Steiner nutrient solution concentrations (50, 100 and 150 %) under greenhouse conditions.
Materials and methods
The study was carried out in Cuernavaca, Morelos, Mexico (18º 58’ 51’’ North latitude and 99º 13’ 55’’ West longitude, at 1,866 masl), from September 2015 to February 2016. On July 25, 2015, cape gooseberry ecotype Colombia seeds were planted in 200-cavity polystyrene trays, one seed per cavity, that contained commercial substrate for germination (BM2, Berger®). The transplant was carried out on September 23, 2015, with one plant placed in each pot.
The treatments were different Steiner (1984) nutrient solution concentrations (50, 100 and 150 %) (Table 1). A randomized complete block experimental design with four replicates was used. The experimental unit was 16, 12-L black polyethylene containers with tezontle as substrate (granulometry from 1 to 8 mm). The containers were arranged in a double row, with 2-m spacing between plants and between the double rows (Cooman, Torres, & Fischer, 2005). The plants were individually tutored with raffia and restricted to four stems each.
Table 1 Chemical composition of three Steiner nutrient solution concentrations (treatments).
| Nutrient solution concentration (%) | Ca2+ | K+ | Mg2+ | NO3 - | H2PO4 - | SO4 2- |
|---|---|---|---|---|---|---|
| meq·L-1 | ||||||
| 50 | 4.5 | 3.5 | 2.0 | 6.0 | 0.5 | 3.5 |
| 100 | 9.0 | 7.0 | 4.0 | 12.0 | 1.0 | 7.0 |
| 150 | 13.5 | 10.5 | 6.0 | 18.0 | 1.5 | 10.5 |
The fertilizers used to prepare the nutrient solution were calcium nitrate, potassium nitrate, magnesium sulfate, potassium sulfate and monopotassium phosphate. The microelements were applied by means of a commercial mixture of chelates (Ultrasol Micro Mix, SQM®), at a dose of 20 g per 500 L of nutrient solution. To calculate this dose, the supply of 3 mg ·L-1 of iron (Fe) was considered. The commercial mixture of micronutrients contains the following concentrations expressed as a percentage: Fe (7.5), Mn (3.7), B (0.4), Zn (0.6), Cu (0.3) and Mo (0.2). The solution’s pH was adjusted between 5.5 and 6.0 with sulfuric acid and the electrical conductivity was 1.0, 2.0 and 3.0 dS ·m-1, for the 50, 100 and 150 % concentrations, respectively. Irrigations were applied according to the phenological stage and 15-20 % nutrient solution drainage was considered to avoid accumulation of salts; in the stages of highest consumption, 2 L of water were applied per plant per day.
During crop development, ten-day mean (Tmean), maximum (Tmax) and minimum (Tmin) temperatures (°C) inside the greenhouse were recorded with an environmental data recorder (Hobo®). In addition, the occurrence of phenological phases was reported (Fischer, 2000): transplant, flowering and ripeness. For each phase the accumulation of heat units (HU, ºC ·d-1) for the crop was determined, using the residual method of Snyder (1985):
where BT is the base temperature, considered as 6.3 °C (Salazar, Chaves-Córdoba, Cooman, & Jones, 2006).
Crop growth was evaluated on the basis of the three nutrient solution concentrations (50, 100 and 150 %), by destructive sampling of eight plants per treatment at 30, 60, 90 and 120 days after transplant (dat). In each sample, the number of leaves (NL) per plant and the leaf area (LA) were recorded. The latter was determined with a LA meter (LI-COR® 3100).
Dry matter (DM; g ·plant-1) was quantified using a digital scale, for which the samples were dried at 70 °C in a forced-air circulation oven until constant weight. With this data, the CGR was calculated using the equation:
where DW2 and DW1 indicate the DM weight of the plant at times T2 and T1, respectively, and A represents the area occupied by the plant (Escalante-Estrada & Kohashi-Shibata, 2015).
In ripeness, fruit harvesting was carried out weekly for three months, and the number and weight of fruits (with and without calyx) per plant were recorded.
With the obtained values, an analysis of variance was performed, and when there were significant differences, Tukey's range test (P ≤ 0.05) was conducted by means of the Statistical Analysis Software program (SAS Institute, 2003). Additionally, correlations between nutrient solution concentrations and growth variables were obtained with the Excel (Microsoft Office®) program.
Results and discussion
Phenology, temperature and heat units
In the phenological stages, flowering with the nutrient solution at 150 % occurred 70 dat, in the solution at 100 % at 75 dat and in the solution at 50 % at 85 dat, while ripeness occurred at 110, 115 and 125 dat, for nutrient solutions at 150, 100 and 50 %, respectively (Figure 1). Therefore, it is evident that the nutrient solution concentrations had a positive effect on crop phenology. This tendency can be associated to greater nutrient availability in nutrient solutions of 100 and 150 % compared to 50 %, which increases DM accumulation. Sabino-López et al. (2016) cultivated Physalis peruviana under greenhouse conditions with 50 % nutrient solution and reported the flowering stage at 57 dat and physiological maturity from 119 to 124 dat.
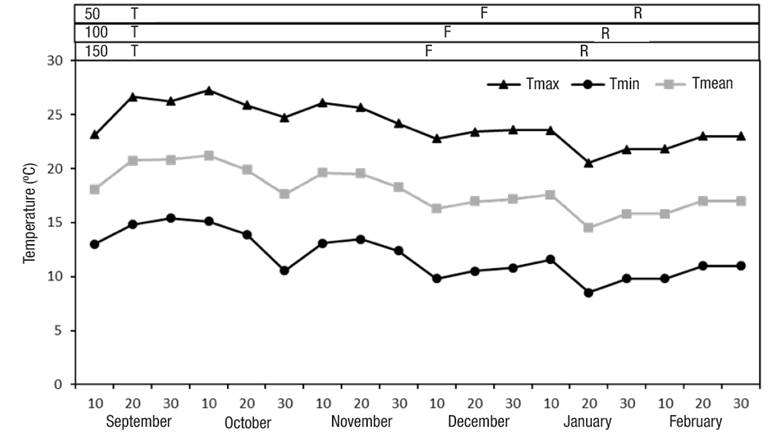
Figure 1 Ten-day averages of maximum (Tmax), minimum (Tmin) and mean (Tmean) temperatures during cape gooseberry crop development. T: transplant, F: flowering, R: ripeness.
The ten-day average of the temperatures during crop development fluctuated from 15 to 21 ºC (Figure 1), from transplant to flowering it was from 16 to 21 ºC and from flowering to ripeness it was from 15 to 18 ºC. The average temperatures at which the cape gooseberry crop developed were approximated at the optimal intervals, which are between 13 and 16 ºC (Fischer et al., 2014).
In the HU accumulation during the crop cycle (Figure 2), the totals were 1370, 1435 and 1527 HU, for the Steiner solutions at 150, 100 and 50 %, respectively. It is probable that this tendency is also due to the greater nutrient availability in the nutrient solution at 150 %, which favors crop growth and development. The results of the present study are lower than those of Mora-Aguilar et al. (2006), who reported a total of 2,047 HU from emergence to physiological maturity in a cape gooseberry ecotype from Peru. These differences can be attributed to the origin of the genetic material evaluated, as well as to the period of cultivation.

Number of leaves and leaf area
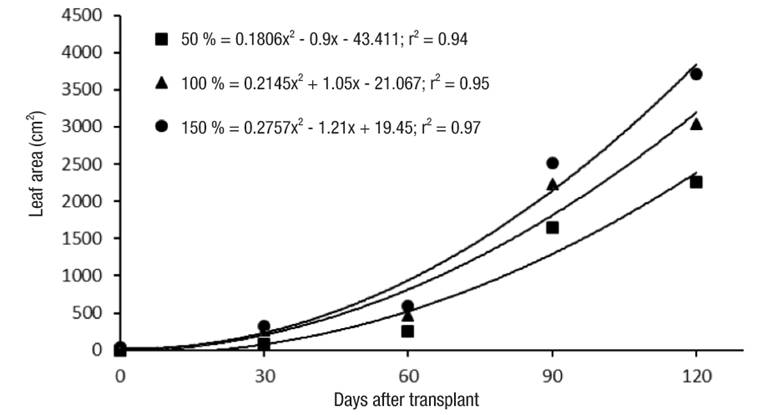
Significant differences (P ≤ 0.05) were observed in the NL as a function of the nutrient solution concentration. The 150 % solution was the one that generated the highest NL (Table 2). These results indicate that the highest nutrient concentration favors the formation of new leaves. Like NL, LA varied significantly (P ≤ 0.05) among the applied nutrient concentrations. The LA dynamics in the three solutions were fitted to a quadratic model. In the Figure 3, it can be seen that the 150 % concentration produced the highest LA per day (1.21 cm2 ·d-1), compared to the solutions at 100 (1.05 cm2 ·d-1) and 50 % (0.90 cm2 ·d-1). It is likely that higher values in both NL and LA are the result of greater nutrient availability, which favors growth and DM production (Hawkesford et al., 2012).
Table 2 Effect of Steiner nutrient solution concentration on the number of leaves in the cape gooseberry crop.
| Steiner nutrient solution concentration (%) | Days after transplant | |||
|---|---|---|---|---|
| 30 | 60 | 90 | 120 | |
| 50 | 8.8 bz | 12.0 c | 25.2 b | 37.8 b |
| 100 | 11.6 ab | 19.6 b | 34.4 a | 51.6 a |
| 150 | 13.2 a | 36.2 a | 35.2 a | 52.8 a |
| LSD1 | 4.0 | 2.2 | 5.7 | 8.6 |
| CV (%) | 14.6 | 6.7 | 12.5 | 12.5 |
1LSD: least significant difference; CV: coefficient of variation.
zMeans with the same letters within each column do not differ statistically (Tukey, P ≤ 0.05).
Dry matter
Regarding DM production (Figure 4), the 100 and 150 % nutrient solution concentrations had the highest values. During crop development, DM production per plant increased as a function of the increase in the nutrient solution concentration. These increases in the three concentrations were fitted to a quadratic model. Thus, the DM production per plant per day was 0.39, 0.25 and 0.17 g, for the concentrations at 150, 100 and 50 %, respectively. The above can be attributed to greater nutrient availability and use (Aldana, Nel, & Fischer, 2014).

Crop growth rate
In the CGR, an increase was observed due to the effect of the applied concentrations (50, 100 and 150 %) (Figure 5). Like the aforementioned variables, these increases were fitted to a quadratic model. The 150 % concentration generated higher DM production per day (0.12 g ·day-1) compared to the other concentrations: 100 (0.11 g ·day-1) and 50 % (0.07 g ·day-1); this can be attributed to better plant efficiency to produce DM with the 150 % solution. With the 100 and 150 % concentrations, the CGR was higher from 30 dat relative to the 50 % one. Maximum DM production was observed at 90 dat with 3.06 and 3.21 g ·day-1, for the 100 and 150 % concentrations, respectively. However, at 120 dat there was a decrease in the efficiency of DM accumulation. In annual crops, this behavior is due to the fact that the plants have a higher number of ripening fruits and then they enter the senescence phase (Mazorra et al., 2003), which induces a reduction in the plant's CGR. However, in cape gooseberry, the decrease observed at 120 dat could be due to the elimination of old leaves as the fruits matured in the lower part of the plants, which is a common practice in the management of this crop.

Fruit number and weight
Significant statistical differences (P ≤ 0.05) were observed in the number and weight of fruits (with and without calyx) due to the effect of the nutrient solution (Table 3). The highest number of fruits was obtained with the 150 and 100 % concentrations, with an increase in fruit production of 64 and 37 %, respectively, both compared to the 50 % solution. The lower number of fruits with the 50 % nutrient solution can be attributed to the limited longitudinal growth of the flower-generating branches, due to the effect of the lower nutrient contribution (Martínez et al., 2008). The results of the present study are superior to those found by Gastelum-Osorio et al. (2013), who reported a 7 % increase in the production of cape gooseberry fruits by increasing the Steiner nutrient solution concentration from 50 to 100 %.
Table 3 Effect of Steiner nutrient solution concentration on the number and weight of cape gooseberry fruits (with and without calyx).
| Steiner nutrient solution concentration (%) | Fruits per plant | Fruit with calyx (g ·plant-1) | Fruit without calyx (g ·plant-1) |
|---|---|---|---|
| 50 | 11.7 cz | 87.3 b | 79.5 b |
| 100 | 16.0 b | 127.5 a | 115.5 a |
| 150 | 19.2 a | 138.5 a | 130.5 a |
| LSD1 | 2.6 | 18.9 | 20 |
| CV (%) | 7.7 | 7.4 | 14 |
1LSD: least significant difference; CV: coefficient of variation.
zMeans with the same letters within each column do not differ statistically (Tukey, P ≤ 0.05).
Regarding fruits with calyx (Table 3), the highest weight was recorded with the highest nutrient solution concentration, which was related to the largest equatorial fruit diameter (data not shown). With the 100 % solution, a 46 % increase in fruit weight was observed, and at 150 % the increase was 59 %, compared to the 50 % solution. This behavior can be attributed to the fact that greater nutrient availability and use increase fruit growth (Antúnez-Ocampo, Sandoval-Villa, Alcántar-González, & Solís-Martínez, 2014; Fischer, 2000).
As in fruits with calyx, the 100 and 150 % concentrations generated an increase in the weight of the fruits without calyx, of 36 and 51 g ·plant-1, respectively, compared to the 50 % solution (Table 3). This is probably due to the fact that the accumulation of carbohydrates in the fruit was favored by the greater supply of nutrients (Gastelum-Osorio et al., 2013; Martínez et al., 2008).
In general, the best results were obtained in all the variables evaluated with the 100 and 150 % nutrient concentrations. This behavior may be due to the fact that the N concentration in the form of nitrate corresponds to 6, 12 and 18 meq ·L-1 in the 50, 100 and 150 % concentrations, respectively (Table 1). In this regard, N is the element most required by plants since it represents from 1 to 5 % of total DM and is an integral constituent of proteins, nucleic acids, chlorophyll, coenzymes, phytohormones and secondary metabolites (Hawkesford et al., 2012). Likewise, optimal N doses increase the photosynthetic process, LA production and total DM, determinants to improve crop yields (Leghari et al., 2016).
On the other hand, the K concentration is 3.5, 7.0 and 10.5 meq ·L-1 in the Steiner nutrient solution at 50, 100 and 150 %, respectively (Table 1). K is the cation absorbed to the greatest extent by plants; in addition, it is involved in the photophosphorylation and transport of photoassimilates from the source tissues, via phloem, to the demand tissues, enzymatic activation and turgor maintenance. Therefore, adequate nutrition with K is associated with increases in fruit yield and quality (Çolpan, Zengin, & Özbahçe, 2013; Lester, Fijon, & Makus, 2010).
The results of the present study show that it is feasible to grow cape gooseberry hydroponically under greenhouse conditions, which represents an alternative to diversify vegetable production. Also, the phenology and growth analysis results could be useful to plan the establishment of the crop and to schedule the first harvests of this fruit vegetable.
Conclusions
The phenology of cape gooseberry, as cultivated under the conditions evaluated, was favored with the nutrient solution at 150 %, requiring 1,370 HU from transplant to ripeness. This represented 15 and 5 days of precocity compared to the 50 % (1,527 HU) and 100 % (1,435 HU) concentrations, respectively.
The highest leaf production, leaf area, dry matter, crop growth rate and fruit weight (with and without calyx) were obtained with the Steiner nutrient solution at 100 and 150 %.
According to the results and the conditions under which the study was carried out, we suggest using Steiner nutrient solution at 100 % in the cultivation of cape gooseberry, since the yield is similar (P ≤ 0.5) to that obtained with the 150 % concentration, but with a lower fertilizer requirement.

