


 text in
  English (pdf)
 Article in xml format
 Article references
 Send this article by e-mail
 Cited by SciELO
  Similars in
SciELO
Similars in
SciELO 
 Permalink
Introduction
The sweet potato (Ipomoea batatas L.) is a tropical plant native to the Americas that is distributed from the Yucatán peninsula in Mexico to Colombia (Empresa Brasileira de Pesquisa Agropecuária [EMBRAPA], 2004; Firetti & Marangoni-Montes, 2006). It belongs to the family Convolvulaceous that groups more than 1,000 species, of which only the sweet potato is economically important (Silva, Lopes, & Magalhães, 2002). It is a hexaploid species of great variability that can be exploited by plant breeders through directed crosses, so that each botanical seed is a potential new genotype (Pinto-Moreira et al., 2009).
Commercially, the sweet potato propagates asexually by means of branches. Seeds are produced by cross-fertilization (due to the self-incompatibility mechanism), which facilitates allelic recombination under natural conditions (Oliveira et al., 2002). In addition, its vegetative reproduction is an advantage in breeding, since it allows fixing and reproducing the selected superior genotypes.
According to Wang (1982), the dry matter content in sweet potato roots is highly correlated with that of starch, which is the raw material for ethanol production. In this sense, the cross-breeding of contrasting parents, with characteristics desirable for their industrial exploitation (combined with a high total root production and high content of dry matter, starch and total sugars), emerges as an important strategy for more efficient exploitation of genetic variability. This, together with other characteristics such as resistance to soil insects, favors obtaining new genotypes with superior industrial qualities.
Brazil's sweet potato varieties have characteristics suitable for human consumption. However, despite the valuable efforts of researchers, there are few studies focused on the industrial properties of this crop. In particular, there is an urgent need to develop varieties that allow high ethanol production under various soil, water, elevation and relative humidity conditions, as well as other edaphic and climatic factors. The aim of this research was to obtain new sweet potato genotypes from single crosses with high potential for ethanol production to be used as commercial varieties.
Materials and methods
The single crosses to obtain new sweet potato genotypes were carried out from March 2011 to August 2012 at the Agro-industrial and Environmental Technology Center (CTAA) of the Federal University of Tocantins, Palmas Campus, Brazil, located at coordinates 10° 10’ 42.1” SL and 48° 21’ 22.6” WL, at 216 masl. The climate is tropical type Aw, characterized by wet summers and dry-season winters, according to the classification of Köeppen (1948).
Seven sweet potato varieties were used to make the crosses; these varieties were the first to be selected for ethanol production in Brazil: Amanda, Ana Clara, Bárbara, Beatriz, Carolina Vitória, Duda and Marcela. Six experimental genotypes with high root dry matter production and with some characteristics required by the ethanol industry were used: BDI106, BDI199, BDI233, BDI(2007)106-41, BDI(2007)PA26 and BDI(2007) PA37 (Table 1). These materials were provided by the breeding program operated by the Renewable Energy Production System Laboratory at the Federal University of Tocantins (UFT/LASPER), Brazil.
Table 1 Seventy-three single crosses made to obtain superior sweet potato genotypes (Agro-industrial and Environmental Technology Center [CTAA] at the UFT Palmas campus, 2012).
| Genotypes | Origin | Genotypes | Origin |
|---|---|---|---|
| BDI#84 | Amanda x Bárbara | BDI#05 | BDI233 x Bárbara |
| BDI#35 | Amanda x Bárbara | BDI#06 | BDI233 x Bárbara |
| BDI#36 | Amanda x Bárbara | BDI#07 | BDI233 x Bárbara |
| BDI#37 | Amanda x Bárbara | BDI#08 | BDI233 x Bárbara |
| BDI#38 | Amanda x Bárbara | BDI#10 | BDI233 x Bárbara |
| BDI#39 | Amanda x Bárbara | BDI#11 | BDI233 x Bárbara |
| BDI#41 | Amanda x Bárbara | BDI#12 | BDI233 x Bárbara |
| BDI#42 | Amanda x Bárbara | BDI#13 | BDI233 x Bárbara |
| BDI#43 | Amanda x Bárbara | BDI#14 | BDI233 x Bárbara |
| BDI#52 | Amanda x Bárbara | BDI#15 | BDI233 x Bárbara |
| BDI#53 | Amanda x Bárbara | BDI#09 | BDI233 x Bárbara |
| BDI#54 | Amanda x Bárbara | BDI#56 | BDI233 x Marcela |
| BDI#94 | Ana Clara x Amanda | BDI#57 | BDI233 x Marcela |
| BDI#22 | Bárbara x Beatriz | BDI#58 | BDI233 x Marcela |
| BDI#23 | Bárbara x Beatriz | BDI#60 | BDI233 x Marcela |
| BDI#24 | Bárbara x Beatriz | BDI#31 | Beatriz x Amanda |
| BDI#25 | Bárbara x Beatriz | BDI#32 | Beatriz x Amanda |
| BDI#26 | Bárbara x Beatriz | BDI#33 | Beatriz x Amanda |
| BDI#27 | Bárbara x Beatriz | BDI#61 | Beatriz x Amanda |
| BDI#49 | Bárbara x Beatriz | BDI#62 | Beatriz x Amanda |
| BDI#50 | Bárbara x Beatriz | BDI#65 | Beatriz x C. Vitória |
| BDI#51 | BDI(2007)PA26 x Amanda | BDI#67 | Beatriz x Duda |
| BDI#17 | BDI(2007)PA26 x Bárbara | BDI#83 | Beatriz x Marcela |
| BDI#18 | BDI(2007)PA26 x Bárbara | BDI#80 | C. Vitória x Marcela |
| BDI#19 | BDI(2007)PA26 x Bárbara | BDI#81 | C. Vitória x Marcela |
| BDI#20 | BDI(2007)PA26 x Bárbara | BDI#68 | Marcela x Amanda |
| BDI#21 | BDI(2007)PA26 x Bárbara | BDI#03 | Marcela x Bárbara |
| BDI#63 | BDI(2007)PA26 x Beatriz | BDI#04 | Marcela x Bárbara |
| BDI#64 | BDI(2007)PA26 x Beatriz | BDI#55 | Marcela x Bárbara |
| BDI#16 | BDI(2007)PA37 x Bárbara | BDI#28 | Marcela x Bárbara |
| BDI#44 | BDI106 x Bárbara | BDI#29 | Marcela x Bárbara |
| BDI#45 | BDI106 x Bárbara | BDI#30 | Marcela x Bárbara |
| BDI#46 | BDI106 x Bárbara | BDI#59 | Marcela x Bárbara |
| BDI#47 | BDI106 x Bárbara | BDI#70 | Marcela x Bárbara |
| BDI#02 | BDI199 x Bárbara | BDI#71 | Marcela x Bárbara |
| BDI#48 | BDI199 x Beatriz | BDI#72 | Marcela x Bárbara |
| BDI#66 | BDI(2007)106-41 x Bárbara |
The 13 parents were cultivated in a shade house, and each one was established in 10, 10-L containers. As substrate, a mixture of ravine soil with tanned bovine manure was used at a 3:1 ratio, which was adapted in accordance with crop recommendations (CQFS RS/SC, 2004). The containers were irrigated daily in accordance with the water absorption capacity of the substrate.
Flowering of some parents occurred two months after planting. Pollinations were performed manually (from 6:00 to 9:00 hours), according to the method proposed by Willson and Ågren (1989). Plants that produced more flowers were used as females. The selected flowers were protected with paper bags one day before anthesis to prevent insect pollination. From the crosses performed, 106 seeds were obtained. The dormancy suspension of the seeds was made with sulfuric acid (100 %) for 40 min. The seeds were then seeded in 128-well expanded polystyrene trays. A mixture of pine bark, coconut fiber, vermiculite and rice husk, supplemented with nutrients (Bioplant®), was used as substrate.
Of the 106 seeds, only 86 germinated. Seedlings were individually identified according to their origins and were trained in containers for 30 days. They were then transplanted into previously fertilized rows. Of the 86 seedlings, 73 produced sufficient branches that guaranteed their propagation to carry out the agronomic evaluation experiments (Table 1).
Two experiments were established in Palmas-TO (11° 43’ 45” SL, 49° 04’ 07” WL and 278 masl) and Gurupí-TO (11° 43’ 45” SL, 49° 04’ 07” WL and 278 masl). According to the agro-meteorological bulletin of UFT’s Gurupí canpus, the average annual rainfall in 2012 was 1,036.20 mm and the average temperature was 25.94 °C. The soil is classified as red-yellow lithosol (EMBRAPA, 2006).
In both experiments, fertilization was carried out based on soil analysis and crop recommendations, according to the parameters established by Silveira, Dias, and Alvim (2008).
One hundred sweet potato genotypes (73 obtained from single crosses, 13 parents and 14 additional ones) were evaluated. The experiments were installed in lattice with three replicates. The experimental plot was constituted by six plants, spaced 0.35 m apart with 0.90 m between rows. Planting was done with branches of 20 cm in length and three to five internodes.
In both environments, six months after sowing, the following variables were recorded: root yield per plot (t∙ha-1), damage caused by soil insects (obtained through the classification scale adapted by França, Ferreira, Maluf, & Miranda, [1983]) and root dry matter content.
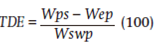
Root dry matter was quantified following the methodology of the Association of Official Analytical Chemists (AOAC, 2005). First, 3 g of fresh grated sample were placed in a crucible which was place in a stove (Tecnal® TE - 394/2) and kept at 105 °C until constant weight. A Shimadzu model AY220 analytical balance was used to obtain the weight. Quantification of the total dry extract (TDE) was calculated with the following formula:
 (1)
(1)
where:
TDE = total dry extract;
Wps = Total weight of the plate with sample (g);
Wep = Weight of empty plate (without sample)(g);
Wswp = Weight of the fresh sample without plate (g);
Ethanol yield (m3∙ha-1) was estimated from root yield, dry matter content and starch content according to the methodology of Cereda (2001), Monteiro-Machado and Rosa-Abreu (2006).
Analysis of variance by locality and sets (after the test of homogeneity of variances) was performed with Statistical Analysis System software (SAS, 2001).
The means of the treatments of each experiment, as well as those of both, were compared by the Scott and Knott (1974) clustering test, P ≤ 0.05, using the SISVAR version 5.5 package. (Ferreira, 2008). Pearson correlation coefficients were calculated for each characteristic between the two experiments, and within each of them, between the possible pairs of variables. These analyzes were carried out with the Genes program (Damião-Cruz, 2008).
Results and discussion
Analyses of variance of root yield, root dry matter content, incidence of soil insect damage and ethanol yield detected statistical differences (P ≤ 0.05) among sweet potato genotypes. In the case of environments, root dry matter and insect incidence were significant (P ≤ 0.05), as was the interaction of root yield and dry matter (P ≤ 0.05). These results confirm the existence of genetic variability and the influence of production areas on the characteristics studied and suggest the need to evaluate in more than one environment before generating a recommendation for other regions (Table 2).
Table 2 Summary of analysis of variance of root yield, dry matter content, incidence of damage caused by soil insects and ethanol yield in sweet potato genotypes cultivated in two environments (Palmas and Gurupí, 2012).
| SV | RY 1 (t∙ha -1 ) | DM (%) | DI | Ethanol (m 3 ∙ha-1) |
|---|---|---|---|---|
| Environments | 76.49 | 56.23** | 72.68** | 1.39 |
| Blocks/Environments | 805.91** | 59.09** | 4.41** | 17.45** |
| Genotypes | 482.45** | 29.28** | 0.43** | 19.53** |
| Genotypes x Environments | 194.83** | 11.40** | 0.29 | 6.72 |
| Residue | 122.83 | 6.35 | 0.27 | 4.40 |
| Mean | 24.42 | 32.61 | 1.85 | 4.55 |
| CV (%) | 45.38 | 7.72 | 28.16 | 46.09 |
1SV = Source of variation, DM = dry mattter, DI = damage caused by soil insects.
**significant for P ≤ 0.05.
¹FV = fuente de variación, MS = materia seca, DI = daños causados por insectos de suelo.
**significativo para P ≤ 0.05.
According to root yield, genotypes were classified into four groups in Palmas and two in Gurupí (Table 3). The most productive genotypes in Palmas were: BDI#73 (59.92 t∙ha-1), BDI#52 (53.20 t∙ha-1), Duda variety (52.04 t∙ha-1), BDI#26 (48.95 t∙ha-1), BDI#11 (48.49 t∙ha-1), BDI#57 (47.58 t∙ha-1), BDI#39 (47.34 t∙ha-1) and BDI#02 (45.59 t∙ha-1). These values are superior to those of table varieties obtained by different authors. In a similar work, Silveira et al. (2008) identified sweet potato varieties with industrial characteristics for ethanol production. When this objective is pursued, root yield should be greater than 40 t∙ha-1 to make it economically viable.
Table 3 Root yield (t∙ha-1) in sweet potato crosses cultivated in two environments in the state of Tocantins, Brasil (Palmas and Gurupí, 2012).
| Genotype | Locality | Mean | Genotype | Locality | Mean | ||
|---|---|---|---|---|---|---|---|
| Palmas | Gurupí | Palmas | Gurupí | ||||
| BDI#01 | 40.71 bz | 17.53 b | 29.12 b | BDI#50 | 22.69 c | 18.65 b | 20.67 c |
| BDI#02 | 45.59 a | 24.18 b | 34.89 b | BDI#51 | 30.29 b | 13.44 b | 21.87 c |
| BDI#03 | 17.35 c | 40.84 a | 29.10 b | BDI#52 | 53.20 a | 39.99 a | 46.60 a |
| BDI#04 | 34.58 b | 23.80 b | 29.19 b | BDI#53 | 8.24 c | 34.24 a | 21.24 c |
| BDI#05 | 29.69 b | 19.66 b | 24.68 c | BDI#54 | 7.11 c | 9.43 b | 8.27 c |
| BDI#06 | 14.41 c | 23.11 b | 18.76 c | BDI#55 | 14.79 c | 20.03 b | 17.41 c |
| BDI#07 | 19.85 c | 10.07 b | 14.96 c | BDI#56 | 17.93 c | 15.84 b | 16.89 c |
| BDI#08 | 23.39 c | 16.43 b | 19.91 c | BDI#57 | 47.58 a | 37.64 a | 42.61 a |
| BDI#09 | 20.13 c | 48.19 a | 34.16 b | BDI#58 | 26.81 c | 24.79 b | 25.80 c |
| BDI#10 | 8.20 c | 16.07 b | 12.13 c | BDI#59 | 18.63 c | 27.86 a | 23.25 c |
| BDI#11 | 48.49 a | 28.46 a | 38.48 a | BDI#60 | 19.92 c | 21.07 b | 20.49 c |
| BDI#12 | 17.54 c | 27.67 a | 22.61 c | BDI#61 | 31.84 b | 23.61 b | 27.72 b |
| BDI#13 | 36.35 b | 31.66 a | 34.00 b | BDI#62 | 21.96 c | 21.96 b | 21.96 c |
| BDI#14 | 25.19 c | 39.82 a | 32.51 b | BDI#63 | 9.95 c | 28.83 a | 19.39 c |
| BDI#15 | 24.31 c | 20.37 b | 22.34 c | BDI#64 | 23.43 c | 19.95 b | 21.69 c |
| BDI#16 | 22.09 c | 16.21 b | 19.15 c | BDI#65 | 6.80 c | 9.20 b | 8.00 c |
| BDI#17 | 17.65 c | 7.03 b | 12.34 c | BDI#66 | 23.35 c | 18.18 b | 20.76 c |
| BDI#18 | 15.32 c | 6.07 b | 10.70 c | BDI#67 | 36.21 b | 36.46 a | 36.34 b |
| BDI#19 | 12.44 c | 11.64 b | 12.04 c | BDI#68 | 6.09 c | 19.22 b | 12.66 c |
| BDI#20 | 9.36 c | 8.16 b | 8.76 c | BDI#69 | 19.05 c | 15.64 b | 17.35 c |
| BDI#21 | 27.66 c | 25.71 a | 26.69 c | BDI#70 | 23.97 c | 42.86 a | 33.41 b |
| BDI#22 | 18.40 c | 11.62 b | 15.01 c | BDI#71 | 34.16 b | 30.16 a | 32.16 b |
| BDI#23 | 26.89 c | 17.72 b | 22.31 c | BDI#72 | 41.60 b | 43.49 a | 42.55 a |
| BDI#24 | 23.82 c | 31.47 a | 27.64 b | BDI#73 | 59.92 a | 34.05 a | 46.99 a |
| BDI#26 | 48.95 a | 36.63 a | 42.79 a | BDI#74 | 33.63 b | 20.97 b | 27.30 b |
| BDI#27 | 37.47 b | 28.66 a | 33.07 b | BDI#75 | 13.49 c | 31.09 a | 22.29 c |
| BDI#28 | 14.43 c | 20.38 b | 17.41 c | BDI#77 | 21.00 c | 22.80 b | 21.90 c |
| BDI#29 | 14.72 c | 23.56 b | 19.14 c | BDI#78 | 17.15 c | 28.36 a | 22.76 c |
| BDI#30 | 16.53 c | 19.95 b | 18.24 c | BDI#79 | 37.24 b | 33.49 a | 35.37 b |
| BDI#31 | 15.00 c | 27.37 a | 21.19 c | BDI#80 | 18.25 c | 20.71 b | 19.48 c |
| BDI#32 | 16.73 c | 17.66 b | 17.19 c | BDI#81 | 33.50 b | 29.62 a | 31.56 b |
| BDI#33 | 28.90 b | 31.54 a | 30.22 b | BDI#82 | 11.83 c | 29.86 a | 20.85 c |
| BDI#34 | 17.50 c | 17.23 b | 17.37 c | BDI#83 | 39.24 b | 43.21 a | 41.23 a |
| BDI#36 | 29.52 b | 23.08 b | 26.30 c | BDI#84 | 15.22 c | 29.60 a | 22.41 c |
| BDI#37 | 15.63 c | 20.76 b | 18.19 c | Beatriz | 24.89 c | 27.67 a | 26.28 c |
| BDI#38 | 26.39 c | 32.17 a | 29.28 b | Barbara | 32.69 b | 36.96 a | 34.83 b |
| BDI#39 | 47.34 a | 30.12 a | 38.73 a | C. Vitoria | 30.37 b | 27.09 a | 28.73 b |
| BDI#40 | 18.13 c | 18.06 b | 18.10 c | Marcela | 31.00 b | 27.67 a | 29.34 b |
| BDI#41 | 28.47 c | 29.99 a | 29.23 b | Duda | 52.04 a | 37.05 a | 44.55 a |
| BDI#42 | 15.55 c | 32.02 a | 23.78 c | Amanda | 27.58 c | 14.72 b | 21.15 c |
| BDI#43 | 15.72 c | 20.19 b | 17.96 c | BDI#91 | 13.86 c | 17.97 b | 15.92 c |
| BDI#44 | 28.05 c | 10.64 b | 19.34 c | BDI#92 | 10.58 c | 7.69 b | 9.14 c |
| BDI#45 | 26.83 c | 15.03 b | 20.93 c | BDI#93 | 26.18 c | 8.81 b | 17.49 c |
| BDI#46 | 17.28 c | 10.71 b | 13.99 c | BDI#94 | 36.39 b | 8.46 b | 22.43 c |
| BDI#47 | 13.05 c | 36.91 a | 24.98 c | A. Clara | 26.11 c | 21.91 b | 24.01 c |
| BDI#48 | 22.61 c | 24.32 b | 23.46 c | BDGU35 | 18.20 c | 22.61 b | 20.41 c |
| BDI#49 | 23.31 c | 20.29 b | 21.80 c | BDGU36 | 36.83 b | 35.38 a | 36.10 b |
| Means / Medias | 24.79 | 24.05 | 24.42 | Means /Medias | 24.79 | 24.05 | 24.42 |
zMeans with the same letter in each column do not differ statistically (Scott-Knott, P ≤ 0.05).
Of the 94 genotypes evaluated in Gurupí (there was a loss of six genotypes), 40 had an average root yield of more than 25 t∙ha-1 and were classified in the first group of significance; however, only six of them are suitable for ethanol production: BDI#09 (48.19 t∙ha-1), BDI#72 (43.49 t∙ha-1), BDI#83 (43.21 t∙ha-1), BDI#70 (42.86 t∙ha-1), BDI#03 (40.84 t∙ha-1) and BDI#52 (39.99 t∙ha-1) (Table 3).
Jin, Fang, Zhang, Zhou, and Zhao (2012) obtained lower results in collections of 10 sweet potato varieties for ethanol production (38.63 t∙ha-1) over a period of 160 days. By contrast, Gonçalves-Neto et al. (2012) identified genotypes UFLA07-43 and UFLA07-12 with maximum root yield of 95.10 and 98.00 t∙ha-1, respectively.
The genotypes that stood out in both environments were: BDI#73, BDI#52, Duda variety, BDI#26, BDI#57, BDI#72 and BDI#83 (Table 3). Of the ten genotypes with the greatest performance in the two environments (Table 4), eight (BDI#52, BDI#26, BDI#57, BDI#72, BDI#83, BDI#39, BDI#11 and BDI#67) come from simple crosses. The Duda variety and BDI#73 were obtained by free pollinations. Therefore, it is evident that the use of directed crosses was a viable alternative, since the genetic variability of the superior clones can be explored with an increase in total root production.
Table 4 Average performance of the eight best genotypes obtained from single crosses (Gurupí and Palmas).
| Genotype | RY 1 (t∙ha -1 ) | DM (%) | DI | Ethanol (m 3 ∙ha- 1 ) |
|---|---|---|---|---|
| BDI#52 | 46.6 az | 33.58 b | 1.72 b | 9.34 a |
| BDI#26 | 42.79 a | 31.09 c | 1.78 b | 7.57 a |
| BDI#57 | 42.61 a | 32.52 c | 1.89 b | 8.3 a |
| BDI#72 | 42.55 a | 32.02 c | 1.5 b | 7.96 a |
| BDI#83 | 41.23 a | 32.56 c | 1.83 b | 8.71 a |
| BDI#39 | 38.73 a | 33.63 b | 1.75 b | 7.27 a |
| BDI#11 | 38.48 a | 31.93 c | 1.64 b | 7.11 a |
| BDI#67 | 36.34 a | 37.41 a | 1.45 b | 7.5 a |
| BDI#73 | 46.99 a | 30.59 c | 2.28 a | 8.12 a |
| Duda | 44.55 a | 35.55 a | 1.92 b | 9.39 a |
1RY = root yield, DM = dry matter, DI = damage caused by soil insects.
zMeans with the same letter in each column do not differ statistically (Scott-Knott, P ≤ 0.05).
Of the seven genotypes that had the highest root yield in the two environments evaluated, BDI#73, BDI#52, Duda, BDI#26 and BDI#57 were in Palmas and BDI#09, BDI#72, BDI#83 and BDI#52 were in Gurupí.
Better yields can be expected from the selected genotypes in the two environments when soil conditions are better from a physical, chemical and biological point of view. The Carolina Vitoria variety has a yield potential of 63 t∙ha-1 in Paraná (Ponta Grossa) and in Tocantins (Palmas) the mean root yield verified by Silveira et al. (2008) was 32.17 t∙ha-1. The Duda variety in Mato Grosso (Tangara da Serra) showed good productive performance (103 t∙ha-1) in a demonstration field, after having been cultivated with sugarcane, while in Tocantins (Palmas) root yield was 65.5 t∙ha-1 (Silveira et al., 2008).
The interaction between genotypes and environments (Table 2) showed statistical differences (P ≤ 0.05) and reveals the need to evaluate genotypes before they are recommended for different commercial production regions. In research by Gomes-Barreto et al. (2011) in south central Tocantins, Brazil, it was verified that the behavior of sweet potato genotypes was not constant in different environments.
In relation to dry matter, genotypes were classified into two groups (Table 5). In Palmas, 37 genotypes presented high dry matter production with averages above 32.86 %. The most outstanding were: BDI#14 (38.67 %), BDI#81 (37.61 %), Duda (36.71 %), BDI#69 (36.65 %), BDI#91 (36.57 %) and BDI#93 (36.50 %). In Gurupí, 36 genotypes produced more than 33 % dry matter, with the seven best being: BDI#67 (38.62 %), BDI#44 (38.27 %), BDI#33 (37.49 %), BDI#14 (37.22 %), BDI#19 (36.98 %), BDI#82 (36.79 %) and BDI#31 (36.57 %).
Table 5 Root dry matter content in sweet potato genotypes obtained from single crosses in two environments.
| Genotype | Locality | Media | Genotipo | Locality | Media | ||
|---|---|---|---|---|---|---|---|
| Palmas | Gurupí | Palmas | Gurupí | ||||
| BDI#01 | 28.81 bz | 32.14 b | 30.48 c | BDI#50 | 31.72 b | 30.71 b | 31.22 c |
| BDI#02 | 35.57 a | 32.93 b | 34.25 b | BDI#51 | 35.96 a | 36.34 a | 36.15 a |
| BDI#03 | 32.43 b | 31.95 b | 32.19 c | BDI#52 | 34.35 a | 32.80 b | 33.58 b |
| BDI#04 | 35.72 a | 36.07 a | 35.90 a | BDI#53 | 30.43 b | 32.22 b | 31.33 c |
| BDI#05 | 32.43 b | 35.31 a | 33.87 b | BDI#54 | 32.97 a | 32.06 b | 32.52 c |
| BDI#06 | 31.32 b | 30.54 b | 30.93 c | BDI#55 | 31.69 b | 30.73 b | 31.21 c |
| BDI#07 | 29.96 b | 28.93 b | 29.45 c | BDI#56 | 32.43 b | 33.82 a | 33.12 c |
| BDI#08 | 25.74 b | 30.22 b | 27.98 c | BDI#57 | 33.70 a | 31.35 b | 32.52 c |
| BDI#09 | 35.09 a | 32.93 b | 34.01 b | BDI#58 | 29.53 b | 28.65 b | 29.09 c |
| BDI#10 | 31.77 b | 35.02 a | 33.40 b | BDI#59 | 32.04 b | 30.32 b | 31.18 c |
| BDI#11 | 31.12 b | 32.75 b | 31.93 c | BDI#60 | 27.49 b | 32.44 b | 29.97 c |
| BDI#12 | 29.69 b | 33.65 a | 31.67 c | BDI#61 | 33.51 a | 33.18 b | 33.35 b |
| BDI#13 | 29.25 b | 31.67 b | 30.46 c | BDI#62 | 33.55 a | 33.05 b | 33.30 b |
| BDI#14 | 38.67 a | 37.22 a | 37.94 a | BDI#63 | 32.27 b | 31.19 b | 31.73 c |
| BDI#15 | 27.87 b | 33.73 a | 30.80 c | BDI#64 | 31.51 b | 35.64 a | 33.58 b |
| BDI#16 | 31.23 b | 29.33 b | 30.28 c | BDI#65 | 35.50 a | 35.91 a | 35.71 a |
| BDI#17 | 31.11 b | 32.85 b | 31.98 c | BDI#66 | 30.16 b | 31.01 b | 30.59 c |
| BDI#18 | 30.49 b | 30.96 b | 30.73 c | BDI#67 | 36.20 a | 38.62 a | 37.41 a |
| BDI#19 | 28.98 b | 36.98 a | 32.98 b | BDI#68 | 35.71 a | 34.98 a | 35.35 a |
| BDI#20 | 30.06 b | 30.09 b | 30.08 c | BDI#69 | 36.65 a | 34.96 a | 35.80 a |
| BDI#21 | 33.27 a | 27.86 b | 30.57 c | BDI#70 | 32.12 b | 30.88 b | 31.50 c |
| BDI#22 | 31.29 b | 31.94 b | 31.61 c | BDI#71 | 31.34 b | 32.23 b | 31.79 c |
| BDI#23 | 31.97 b | 33.96 a | 32.97 b | BDI#72 | 32.17 b | 31.87 b | 32.02 c |
| BDI#24 | 32.21 b | 29.52 b | 30.87 c | BDI#73 | 30.72 b | 30.46 b | 30.59 c |
| BDI#26 | 31.67 b | 30.51 b | 31.09 c | BDI#74 | 31.09 b | 32.46 b | 31.78 c |
| BDI#27 | 33.01 a | 29.66 b | 31.33 c | BDI#75 | 32.51 b | 32.00 b | 32.26 c |
| BDI#28 | 35.51 a | 30.60 b | 33.06 b | BDI#77 | 29.09 b | 30.98 b | 30.03 c |
| BDI#29 | 31.17 b | 35.93 a | 33.55 b | BDI#78 | 33.30 a | 35.39 a | 34.35 b |
| BDI#30 | 29.36 b | 32.43 b | 30.90 c | BDI#79 | 32.07 b | 35.52 a | 33.79 b |
| BDI#31 | 30.30 b | 36.57 a | 33.44 b | BDI#80 | 33.32 a | 33.24 b | 33.28 b |
| BDI#32 | 33.22 a | 33.58 a | 33.40 b | BDI#81 | 37.61 a | 35.13 a | 36.37 a |
| BDI#33 | 33.42 a | 37.49 b | 35.46 a | BDI#82 | 35.42 a | 36.79 a | 36.11 a |
| BDI#34 | 31.22 b | 32.95 c | 32.09 c | BDI#83 | 33.63 a | 31.49 b | 32.56 c |
| BDI#36 | 28.58 b | 30.18 b | 29.38 c | BDI#84 | 32.24 b | 35.62 a | 33.93 b |
| BDI#37 | 29.99 b | 31.04 b | 30.51 c | Beatriz | 35.15 a | 34.62 a | 34.89 a |
| BDI#38 | 31.20 b | 28.42 b | 29.81 c | Barbara | 33.22 a | 30.46 b | 31.84 c |
| BDI#39 | 32.86 a | 34.40 a | 33.63 b | C. Vitoria | 35.88 a | 36.00 a | 35.94 a |
| BDI#40 | 34.59 a | 35.39 a | 34.99 a | Marcela | 35.51 a | 35.61 a | 35.56 a |
| BDI#41 | 30.57 b | 29.72 b | 30.14 c | Duda | 36.71 a | 34.38 a | 35.55 a |
| BDI#42 | 30.62 b | 31.42 b | 31.02 c | Amanda | 32.50 b | 32.55 b | 32.53 c |
| BDI#43 | 27.28 b | 34.33 a | 30.80 c | BDI#91 | 36.57 a | 36.43 a | 36.50 a |
| BDI#44 | 33.42 a | 38.27 a | 35.85 a | BDI#92 | 31.18 b | 32.45 b | 31.82 c |
| BDI#45 | 33.04 a | 28.90 b | 30.97 c | BDI#93 | 36.50 a | 30.69 b | 33.59 b |
| BDI#46 | 30.88 b | 32.63 b | 31.76 c | BDI#94 | 29.90 b | 34.47 a | 32.18 c |
| BDI#47 | 34.52 a | 35.64 a | 35.08 a | A. Clara | 32.51 b | 32.74 b | 32.62 c |
| BDI#48 | 28.39 b | 29.62 b | 29.01 c | BDGU35 | 31.20 b | 31.62 b | 31.41 c |
| BDI#49 | 31.22 b | 30.73 b | 30.98 c | BDGU36 | 33.02 a | 33.62 a | 33.32 b |
| Means / Medias | 32.29 a | 32.92 a | 32.61 | Means / Medias | 32.29 a | 32.92 a | 32.61 |
zMeans with the same letter in each column do not differ statistically (Scott-Knott, P ≤ 0.05).
The Duda and Carolina Vitoria varieties produced 36.71 and 35.88 % dry matter, respectively, in Palmas, values similar to those obtained by Silveira et al. (2008), Alves- Martins, Mucci-Peluzio, Rodrigues-Coimbra, and Piragé-de Oliveira (2012). According to Leonel and Cereda (2002), dry matter has a direct relationship with the production of carbohydrates and consequently with the industrial yield of ethanol; therefore, it is important to select genotypes with high dry matter production.
Meirelles-de Castro, da Costa-Alvim, Rosa-de Santana, Pereira-de Carvalho, and Antonio-da Silveira (2011) reported 33.06 and 35.80 % dry matter for the industrial varieties Amanda and Carolina Vitoria, respectively.
On the other hand, when considering the dry matter production of both evaluation environments, the 94 genotypes were placed in three groups. Eight had adequate dry matter production with values ranging from 35.90 to 37.94 % (Table 5), highlighted by BDI#14, BDI#81, BDI#91, BDI#67 and BDI#51, which in turn were classified among the best in Palmas with dry matter production of 38.67, 37.61, 36.57, 36.20 and 35.96 %, respectively.
Averages of the genotypes grown in Palmas did not show significant statistical differences in the damage caused by insects in the roots (Table 6). These values ranged from 1 % for BDI#70, BDI#72, BDI#82 and BDI#03, to 2.56 % for BDI#12. These low values reveal that in Palmas the incidence of soil insects in sweet potato roots was not an important factor.
Table 6 Damage caused by insects in two evaluation environments.
| Genotype | Locality | Media | Genotipo | Locality | Media | ||
|---|---|---|---|---|---|---|---|
| Palmas | Gurupí | Palmas | Gurupí | ||||
| BDI#01 | 1.45 az | 2.67 a | 2.06 a | BDI#50 | 1.67 a | 2.33 a | 2.00 a |
| BDI#02 | 1.11 a | 2.50 a | 1.81 b | BDI#51 | 1.33 a | 2.17 b | 1.75 b |
| BDI#03 | 1.00 a | 2.33 a | 1.67 b | BDI#52 | 1.44 a | 2.00 b | 1.72 b |
| BDI#04 | 1.33 a | 1.83 b | 1.58 b | BDI#53 | 1.55 a | 2.17 b | 1.86 b |
| BDI#05 | 1.56 a | 2.00 b | 1.78 b | BDI#54 | 1.22 a | 1.83 b | 1.53 b |
| BDI#06 | 1.56 a | 2.17 b | 1.86 b | BDI#55 | 1.78 a | 2.33 a | 2.06 a |
| BDI#07 | 1.67 a | 2.00 b | 1.83 b | BDI#56 | 1.67 a | 2.00 b | 1.83 b |
| BDI#08 | 1.55 a | 2.00 b | 1.78 b | BDI#57 | 1.78 a | 2.00 b | 1.89 b |
| BDI#09 | 1.78 a | 1.83 b | 1.81 b | BDI#58 | 2.00 a | 2.67 a | 2.33 a |
| BDI#10 | 1.44 a | 1.83 b | 1.64 b | BDI#59 | 2.11 a | 2.00 b | 2.06 a |
| BDI#11 | 1.11 a | 2.17 b | 1.64 b | BDI#60 | 2.33 a | 3.00 a | 2.67 a |
| BDI#12 | 2.56 a | 2.17 b | 2.36 a | BDI#61 | 1.55 a | 2.33 a | 1.94 a |
| BDI#13 | 1.67 a | 2.50 a | 2.08 a | BDI#62 | 1.11 a | 2.67 a | 1.89 b |
| BDI#14 | 1.44 a | 1.67 b | 1.56 b | BDI#63 | 1.11 a | 2.33 a | 1.72 b |
| BDI#15 | 1.67 a | 2.17 b | 1.92 b | BDI#64 | 1.78 a | 2.50 a | 2.14 a |
| BDI#16 | 1.44 a | 2.00 b | 1.72 b | BDI#65 | 1.33 a | 2.17 b | 1.75 b |
| BDI#17 | 1.67 a | 2.00 b | 1.83 b | BDI#66 | 1.33 a | 2.50 a | 1.92 b |
| BDI#18 | 1.55 a | 1.83 b | 1.69 b | BDI#67 | 1.22 a | 1.67 b | 1.45 b |
| BDI#19 | 1.55 a | 2.67 a | 2.11 a | BDI#68 | 1.33 a | 1.83 b | 1.58 b |
| BDI#20 | 1.22 a | 2.50 a | 1.86 b | BDI#69 | 1.22 a | 1.50 b | 1.36 b |
| BDI#21 | 1.22 a | 2.67 a | 1.94 a | BDI#70 | 1.00 a | 1.50 b | 1.2 5 b |
| BDI#22 | 1.78 a | 2.33 a | 2.06 a | BDI#71 | 1.33 a | 2.67 a | 2.00 a |
| BDI#23 | 1.33 a | 2.17 b | 1.75 b | BDI#72 | 1.00 a | 2.00 b | 1.50 b |
| BDI#24 | 1.33 a | 2.50 a | 1.92 b | BDI#73 | 2.22 a | 2.33 a | 2.28 a |
| BDI#26 | 1.22 a | 2.33 a | 1.78 b | BDI#74 | 1.56 a | 3.17 a | 2.36 a |
| BDI#27 | 1.11 a | 1.67 b | 1.39 b | BDI#75 | 1.44 a | 1.67 b | 1.56 b |
| BDI#28 | 1.33 a | 2.50 a | 1.92 b | BDI#77 | 2.22 a | 2.83 a | 2.53 a |
| BDI#29 | 1.67 a | 1.67 b | 1.67 b | BDI#78 | 1.22 a | 2.33 a | 1.78 b |
| BDI#30 | 1.33 a | 2.17 b | 1.75 b | BDI#79 | 1.33 a | 1.83 b | 1.58 b |
| BDI#31 | 1.89 a | 3.00 a | 2.44 a | BDI#80 | 1.67 a | 1.83 b | 1.75 b |
| BDI#32 | 1.44 a | 2.00 b | 1.72 b | BDI#81 | 1.22 a | 1.67 b | 1.45 b |
| BDI#33 | 1.78 a | 2.67 a | 2.22 a | BDI#82 | 1.00 a | 2.33 a | 1.67 b |
| BDI#34 | 1.33 a | 2.00 b | 1.67 b | BDI#83 | 1.67 a | 2.00 b | 1.83 b |
| BDI#36 | 1.44 a | 2.33 a | 1.89 b | BDI#84 | 2.00 a | 2.17 b | 2.08 a |
| BDI#37 | 1.44 a | 1.83 b | 1.64 b | Beatriz | 1.89 a | 2.50 a | 2.20 a |
| BDI#38 | 1.45 a | 2.50 a | 1.97 a | Barbara | 1.55 a | 2.33 a | 1.94 a |
| BDI#39 | 1.33 a | 2.17 b | 1.75 b | C. Vitoria | 1.33 a | 1.50 b | 1.42 b |
| BDI#40 | 1.33 a | 2.83 a | 2.08 a | Marcela | 1.56 a | 3.17 a | 2.36 a |
| BDI#41 | 1.22 a | 1.83 b | 1.53 b | Duda | 1.33 a | 2.50 a | 1.92 b |
| BDI#42 | 1.44 a | 1.67 b | 1.56 b | Amanda | 1.67 a | 2.83 a | 2.25 a |
| BDI#43 | 1.11 a | 2.83 a | 1.97 a | BDI#91 | 1.44 a | 1.83 b | 1.64 b |
| BDI#44 | 1.33 a | 2.17 b | 1.75 b | BDI#92 | 1.89 a | 2.17 b | 2.03 a |
| BDI#45 | 1.45 a | 2.17 b | 1.81 b | BDI#93 | 1.11 a | 2.33 a | 1.72 b |
| BDI#46 | 1.33 a | 2.17 b | 1.75 b | BDI#94 | 1.44 a | 1.83 b | 1.64 b |
| BDI#47 | 1.22 a | 2.83 a | 2.03 a | A. Clara | 1.33 a | 2.17 b | 1.75 b |
| BDI#48 | 1.56 a | 2.17 b | 1.86 b | BDGU35 | 1.67 a | 1.67 b | 1.67 b |
| BDI#49 | 2.00 a | 2.50 a | 2.25 a | BDGU36 | 1.44 a | 2.00 b | 1.72 b |
| Means / Medias | 1.49 b | 2.09 a | 1.85 | Means / Medias | 1.49 b | 2.09 a | 1.85 |
zMeans with the same letter in each column do not differ statistically (Scott-Knott, P ≤ 0.05).
The parents selected for ethanol production that gave rise to the evaluated parents were tested under conditions of high infestation of insects and nematodes during their selection, initiated in 1997. According to Silveira et al. (2008), these genotypes were selected for their higher root yield and lower damage caused by soil insects, as evidenced in the present study where the genotypes and varieties showed a high level of tolerance to soil insect attack.
In this work, the best results were obtained in Palmas in the classification of insect incidence (1.49), by having less root damage, whereas in Gurupí the average was 2.09. According to the results of both environments, 64 genotypes were classified in the best group. Of these, those that stood out were BDI#70, BDI#69, BDI#27, Carolina Vitoria, BDI#67 and BDI#81, with values between 1.25 and 1.45.
The ethanol yields of the 94 genotypes (there was a loss of 6 genotypes) evaluated in both environments presented significant statistical differences (P ≤ 0.05). In Palmas, they were classified into three groups, highlighted by BDI#83, BDI#02, BDI#39, BDI#26, BDI#11, BDI#57, BDI#73, BDI#52 and Duda, with yields between 8.40 and 11.24 m3∙ha-1. In Gurupí, genotypes were divided into two groups; of these, 36 were placed in the group with the highest yield, highlighted by BDI#70, BDI#57, BDI#79, BDI#47, Duda, BDI#03, BDI#67, BDI#52, BDI#72, BDI#14, BDI#83 and BDI#09, with ethanol yields of 7.05 to 9.35 m3∙ha-1 (Table 6).
According to the ethanol production in the two environments evaluated, the genotypes were classified into three groups, highlighted by BDI#11, BDI#39, BDI#79, BDI367, BDI#26, BDI#72, BDI#73, BDI#57, BDI#83, BDI#52 and Duda, with ethanol yields of between 7.11 and 9.39 m3∙ha-1 (Table 7). These values contrast with the average sugarcane yield of 6.8 m3∙ha-1 (Kohlhepp, 2010), which is lower than that found with most of the sweet potato clones used in this research.
Table 7 Average ethanol yield (m3∙ha-1) in two evaluation environments.
| Genotype | Locality | Media | Genotipo | Locality | Media | ||
|---|---|---|---|---|---|---|---|
| Palmas | Gurupí | Palmas | Gurupí | ||||
| BDI#01 | 6.93 bz | 3.37 b | 5.15 b | BDI#50 | 4.02 c | 3.20 b | 3.61 c |
| BDI#02 | 8.57 a | 4.26 b | 6.42 b | BDI#51 | 6.19 b | 2.77 b | 4.48 c |
| BDI#03 | 3.29 c | 7.62 a | 5.46 b | BDI#52 | 10.85 a | 7.84 a | 9.35 a |
| BDI#04 | 6.94 b | 4.83 b | 5.89 b | BDI#53 | 1.33 c | 5.70 a | 3.52 c |
| BDI#05 | 4.84 c | 3.54 b | 4.19 c | BDI#54 | 1.33 c | 1.74 b | 1.54 c |
| BDI#06 | 2.62 c | 3.99 b | 3.31 c | BDI#55 | 2.61 c | 3.23 b | 2.92 c |
| BDI#07 | 3.39 c | 1.75 b | 2.57 c | BDI#56 | 3.25 c | 3.02 b | 3.14 c |
| BDI#08 | 3.75 c | 2.92 b | 3.33 c | BDI#57 | 9.45 a | 7.15 a | 8.30 a |
| BDI#09 | 4.37 c | 9.35 a | 6.86 b | BDI#58 | 4.56 c | 4.06 b | 4.31 c |
| BDI#10 | 1.53 c | 3.17 b | 2.35 c | BDI#59 | 3.22 c | 4.69 b | 3.96 c |
| BDI#11 | 8.82 a | 5.41 a | 7.12 a | BDI#60 | 3.24 c | 3.99 b | 3.62 c |
| BDI#12 | 3.03 c | 5.18 a | 4.10 c | BDI#61 | 6.42 b | 4.74 b | 5.58 b |
| BDI#13 | 6.41 b | 5.94 a | 6.18 b | BDI#62 | 4.23 c | 4.41 b | 4.32 c |
| BDI#14 | 5.41 c | 8.17 a | 6.79 b | BDI#63 | 1.76 c | 4.93 a | 3.35 c |
| BDI#15 | 3.48 c | 3.64 b | 3.56 c | BDI#64 | 4.10 c | 3.73 b | 3.92 c |
| BDI#16 | 3.70 c | 2.76 b | 3.23 c | BDI#65 | 1.46 c | 1.97 b | 1.72 c |
| BDI#17 | 3.10 c | 1.30 b | 2.20 c | BDI#66 | 3.96 c | 3.21 b | 3.58 c |
| BDI#18 | 2.71 c | 1.06 b | 1.89 c | BDI#67 | 7.28 b | 7.72 a | 7.50 a |
| BDI#19 | 1.98 c | 2.22 b | 2.10 c | BDI#68 | 1.20 c | 3.69 b | 2.45 c |
| BDI#20 | 1.78 c | 1.51 b | 1.64 c | BDI#69 | 3.89 c | 3.04 b | 3.47 c |
| BDI#21 | 5.07 c | 4.51 b | 4.79 c | BDI#70 | 4.14 c | 7.06 a | 5.60 b |
| BDI#22 | 3.04 c | 2.04 b | 2.54 c | BDI#71 | 5.77 b | 5.20 a | 5.49 b |
| BDI#23 | 4.90 c | 3.40 b | 4.15 c | BDI#72 | 7.77 b | 8.16 a | 7.96 a |
| BDI#24 | 4.93 c | 6.10 a | 5.52 b | BDI#73 | 10.37 a | 5.87 a | 8.12 a |
| BDI#26 | 8.78 a | 6.37 a | 7.58 a | BDI#74 | 6.05 b | 3.85 b | 4.95 c |
| BDI#27 | 6.63 b | 4.77 b | 5.70 b | BDI#75 | 2.52 c | 5.92 a | 4.22 c |
| BDI#28 | 2.72 c | 3.44 b | 3.08 c | BDI#77 | 3.73 c | 4.25 b | 3.99 c |
| BDI#29 | 2.53 c | 4.62 b | 3.58 c | BDI#78 | 3.12 c | 5.49 a | 4.31 c |
| BDI#30 | 2.78 c | 3.61 b | 3.20 c | BDI#79 | 7.36 b | 7.23 a | 7.29 a |
| BDI#31 | 2.75 c | 5.62 a | 4.19 c | BDI#80 | 3.39 c | 3.67 b | 3.53 c |
| BDI#32 | 3.35 c | 3.55 b | 3.45 c | BDI#81 | 7.42 b | 6.39 a | 6.90 b |
| BDI#33 | 5.64 b | 6.55 a | 6.10 b | BDI#82 | 2.35 c | 6.07 a | 4.21 c |
| BDI#34 | 2.90 c | 3.06 b | 2.98 c | BDI#83 | 8.40 a | 9.01 a | 8.71 a |
| BDI#36 | 5.06 c | 4.09 b | 4.58 c | BDI#84 | 2.59 c | 5.50 a | 4.05 c |
| BDI#37 | 2.85 c | 3.79 b | 3.32 c | Beatriz | 5.12 c | 5.56 a | 5.34 b |
| BDI#38 | 4.44 c | 4.58 b | 4.51 c | Barbara | 5.89 b | 6.31 a | 6.10 b |
| BDI#39 | 8.77 a | 5.78 a | 7.28 a | C.Vitoria | 6.56 b | 5.96 a | 6.26 b |
| BDI#40 | 3.75 c | 3.84 b | 3.80 c | Marcela | 6.57 b | 5.88 a | 6.23 b |
| BDI#41 | 5.29 c | 5.14 a | 5.21 b | Duda | 11.24 a | 7.55 a | 9.39 a |
| BDI#42 | 2.89 c | 5.70 a | 4.30 c | Amanda | 4.88 c | 2.46 b | 3.67 c |
| BDI#43 | 2.58 c | 3.95 b | 3.26 c | BDI#91 | 2.74 c | 3.52 b | 3.13 c |
| BDI#44 | 5.33 c | 2.26 b | 3.79 c | BDI#92 | 1.92 c | 1.48 b | 1.70 c |
| BDI#45 | 4.86 c | 2.43 b | 3.64 c | BDI#93 | 5.07 c | 1.45 b | 3.26 c |
| BDI#46 | 3.07 c | 2.03 b | 2.55 c | BDI#94 | 6.69 b | 1.72 b | 4.20 c |
| BDI#47 | 2.50 c | 7.49 a | 5.00 c | A. Clara | 4.82 c | 3.89 b | 4.35 c |
| BDI#48 | 3.76 c | 4.12 b | 3.94 c | BDGU35 | 3.12c | 3.93 b | 3.53 c |
| BDI#49 | 3.94 c | 3.51 b | 3.72 c | BDGU36 | 6.79 b | 6.60 a | 6.69 b |
| Means / Medias | 4.60 a | 4.50 a | 4.55 c | Means / Medias | 4.60 a | 4.50 a | 4.55 c |
zMeans with the same letter in each column do not differ statistically (Scott-Knott, P ≤ 0.05).
Table 8 shows a positive and significant correlation (P ≤ 0.01) between root yield and ethanol yield. These results showed that the selection to obtain higher production and dry matter content provided genotypes with higher liquid ethanol productivity.
Table 8 Pearson correlations for root yield, dry matter content, soil insect incidence and ethanol in sweet potato gentoypes.
| Characters | Insects | Dry matter | Ethanol |
|---|---|---|---|
| Root yield | 0.08 | -0.071 | 0.978** |
| Insects | -0.05 | 0.223** | |
| Dry matter | 0.78** |
** = P ≤ 0.01
The use of sweet potato as raw material for ethanol production was described by Tavares et al. (2007), Silveira et al. (2008), Gonçalves-Neto et al. (2011) and Jin et al. (2012). The results indicate that the higher the productivity in the field, the higher the ethanol yield. There are cases where high root yield is not associated with high ethanol yield; this is because the raw material for ethanol production is the carbohydrates present in root dry matter, content that can vary according to the genotype.
In this study, root yield was highest in BDI#73 with 46.99 t∙ha-1, and its ethanol production was 8.12 m3∙ha-1, although it was not the highest (Table 4). By contrast, the Duda variety did not have the highest yield in the field, but it did have the highest ethanol yield, due to the high content of dry matter and carbohydrates in its roots. This demonstrates the importance of breeding in the selection of new sweet potato genotypes with specific characteristics for the ethanol industry.
Damage caused by soil insects and ethanol yields (Table 8) showed a positive and significant correlation (P ≤ 0.01), but low. Thus, it is considered that insect attack on roots did not affect their production, confirming that its incidence was not an important factor.
Conclusions
The use of crosses between contrasting genotypes is a strategy that enables identifying superior sweet potato genotypes for ethanol production.
Genotypes BDI#73, BDI#52, BDI#83, from single crosses, and the Duda variety showed high total root yield potential and low soil insect incidence, and are promising for the ethanol industry with experimental yields of 8.12, 9.34, 8.71 and 9.39 m3∙ha-1, respectively.
The correlation of root yield and root dry matter content with ethanol production in sweet potato is highly significant.

