


 text in
  English (pdf)
 Article in xml format
 Article references
 Send this article by e-mail
 Cited by SciELO
  Similars in
SciELO
Similars in
SciELO 
 Permalink
Introduction
The management of heterosis that enables the production of outstanding hybrid varieties is probably the greatest success of plant breeding. The development of outstanding hybrid varieties, however, is no easy task: less than 1 % of single-cross maize (Zea mays L.) hybrids become commercial varieties (Bernardo, 1996), and something similar must occur in others crops, particularly among some that are autogamous species, such as tomato (Solanum lycopersicum L.). The greatest obstacle faced by plant breeders is the need to evaluate in the field a large number of experimental hybrids, which usually exceeds the capacity of breeding programs. To address this difficulty, theory and methods for predicting the genotypic value of varieties that do not physically exist have been developed. These methods are based on the formation and experimental evaluation of a small sample of crosses and on the coancestry of the parental lines, estimated on the basis of their pedigree records or genomic fingerprints (Henderson, 1985; Bernardo, 1994; Gbur et al., 2012).
In maize, the grain yield of single crosses has been predicted by a prediction equation that produces the best linear unbiased predictions (BLUP) (Bernardo, 1993, 1995). These predictions were based on RFLP molecular markers (Bernardo, 1994, 1996) and microsatellite markers (Balestre, Von Pinho, & Souza, 2010). Correlation coefficients (r) between observed and predicted yields ranged between 0.43 and 0.76, and between 0.55 and 0.70, respectively. Also in maize, Massman, Gordillo, Lorenzana, and Bernardo (2013) made a genomic prediction by ridge regression BLUP (RR-BLUP), based on SNP (single nucleotide polymorphism) markers, with prediction levels similar to those of BLUP. An attractive feature of the RR-BLUP method is that it uses all molecular markers and assumes that each of them represents the same proportion of genetic variance (Meuwissen, Hayes, & Goddard, 2001).
Although tomato is the second most important horticultural species in the world, and its breeding in recent decades has been oriented to the production and release of F1 hybrid varieties, there are few reports on hybrid yield prediction. This may be due to the fact that plant breeding is mainly carried out by the private sector and only in a limited way by public programs. The cost of tomato production is very high, especially if it is done in a greenhouse. The phenotyping of new cultivars involves a high financial investment. To make it more productive, it is necessary to implement strategies, such as fruit yield prediction, that enable making and evaluating only those crosses with the greatest probability of success.
Mirshamsi, Farsi, Shahriari, and Nemati (2008) used RAPD markers to estimate genetic distances between parents and to determine the correlation between them and the fruit performances of hybrids produced by their crosses. However, the correlation coefficients obtained, due to their reduced value (r < 0.40), suggest that this method is of little practical use.
In breeding vegetables, especially tomato (despite its great methodological value), antecedents for predicting performance characters are scarce. Therefore, this study was undertaken in order to predict the firmness, number and total and commercial yield of fruits of tomato single crosses using the BLUP and ridge regression BLUP methods.
Materials and methods
This research was carried out from February 2013 to November 2015 and consisted of three stages: 1) analysis of elite tomato lines with ISSR molecular markers, selection of parental lines and carrying out of directed crosses, 2) evaluation of fruit firmness, number and yield of single crosses and 3) prediction of performance of crosses using BLUP and RR-BLUP and validation of methods.
Selection of parental lines
In 2013, 39 elite F8 tomato lines were sown in 200-well polystyrene trays with peat moss as substrate. Between 30 and 40 days after sowing (das), tissue samples of tender, green and apparently undamaged leaves were taken from 10 seedlings. The leaves were washed with 70 % alcohol and dried with paper towels. Next, 0.3 g of leaf were placed in a porcelain mortar, liquid nitrogen was added and it was ground to a fine powder, which was transferred to a 1.5-mL microtube with 600 μL of extraction buffer (100 mM Tris HCl, 20 mM EDTA, 1.4 M NaCl, 2.0 % CTAB and 0.2 % 2-Mercaptoethanol), preheated to 65 °C in a thermoblock and stirred until homogenized. It was once again heated to 65 °C for 20 min. Next, it was removed from the heat, left to cool and centrifuged at 21,000 x g for 20 min. The solution was transferred to another microtube, 600 μL of chloroform:isoamyl alcohol (24:1) were added and it was stirred for 20 min. Subsequently, it was centrifuged at 12,000 x g for 5 min and the aqueous (upper) phase was placed in another tube with 500 μL of cold isopropanol, gently stirred by inversion, kept at -20 °C for 60 min to precipitate the DNA, centrifuged at 12,000 x g for 5 min and the supernatant was decanted. Then 700 μL of solution (10 mM Tris HCl, 1 mM EDTA, 10 mM NaCl, pH 8.0) were added to dissolve the pellet and it was refrigerated (4 °C) for 12 h.
Once the DNA was resuspended, 4 μl of RNase were added and incubated at 37 °C for 1 h. The DNA was reprecipitated with 70 μL of 3 M sodium acetate and 700 μL of cold isopropanol, stirred by inversion and stored in the freezer for 2 h. It was centrifuged at 8,000 x g for 10 min, the supernatant was removed and the pellet was washed with 500 μl of 70 % ethanol (reagent grade). It was centrifuged again, the supernatant was removed and the pellet dried at room temperature. Finally, it was dissolved with 50 μL of TE and stored at 4 °C.
To quantify DNA purity, a Thermo Scientific NanoDrop Lite spectrophotometer was used. Working solutions with 10 μg·μL-1 DNA were prepared. DNA quality was verified on a 0.8 % agarose gel of 4 mm thickness and 0.5 % TAE, after which 10 μL of the working solution with DNA were deposited in each well. Electrophoresis was performed for 2 h in a Thermo Scientific Owl A3-1 chamber. The gel was stained with ethidium bromide solution at a concentration of 0.5 μg·mL-1 for 20 min and photographed with a UVP TFM-26 transilluminator photodocumentation system.
In the amplification and separation of fragments by polymerase chain reaction (PCR), 29 ISSR (Inter-Simple Sequence Repeat) primers were used; the annealing temperatures are given in Table 1. The amplification reaction was performed with: 5.2 μL of H2O, 10.0 μL of dNTP’s [500 μM], 2.5 μL of buffer [10 x], 1.5 μL of MgCl2 [50 mM], 3.0 μL of ISSR primer [10 ng·μL-1], 0.3 μL of Taq DNA polymerase enzyme [5 u·μL-1] and 2.5 μL of DNA [10 ng·μL-1], giving a total volume of 25 μL.
Table 1 Sequence of ISSR primers used in the characterization of the genetic divergence of 39 elite tomato lines, annealing temperature (At), total number of amplified (TB) and polymorphic bands (PB) and percentage of polymorphism (PP).
| Primer | Sequence 5’-3’ | At (ºC) | TB | PB | PP (%) | Primer | Sequence 5’-3’ | At (ºC) | TB | PB | PP (%) |
|---|---|---|---|---|---|---|---|---|---|---|---|
| 17898 B | (CA)6GT | 42 | 7 | 4 | 57.1 | PHV7 | (GTG)2(TG)6T | 58 | 2 | 1 | 50.0 |
| 17899 A | (CA)6AG | 42 | 9 | 4 | 44.4 | UBC807 | (AG)8T | 50 | 9 | 7 | 77.8 |
| Echt 5 | (AGAC)2GC | 42 | 6 | 3 | 50.0 | UBC811 | (GA)8C | 52 | 5 | 2 | 40.0 |
| ISSR01 | (CA)8AAGG | 62 | 15 | 15 | 100.0 | UBC815 | (CT)8G | 52 | 9 | 2 | 22.2 |
| ISSR02 | (CA)8AAGCT | 62 | 15 | 15 | 100.0 | UBC822 | (TC)8ª | 50 | 3 | 0 | 0.0 |
| ISSR03 | (GA)8CTC | 58 | 17 | 17 | 100.0 | UBC827 | (AC)8G | 52 | 8 | 5 | 62.5 |
| ISSR04 | (AG)8CTC | 58 | 18 | 17 | 94.4 | UBC836 | (AG)8CTA | 52 | 11 | 9 | 81.8 |
| ISSR05 | (AC)8CTA | 56 | 10 | 8 | 80.0 | UBC844 | (CT)8AC | 54 | 9 | 8 | 88.9 |
| ISSR06 | (AC)8CTG | 58 | 12 | 11 | 91.7 | UBC845 | (CT)8AGG | 54 | 13 | 12 | 92.3 |
| ISSR07 | (AG)8CTG | 53 | 10 | 10 | 100.0 | UBC847 | (CA)8AGC | 52 | 7 | 3 | 42.9 |
| ISSR08 | (AC)8CTT | 56 | 9 | 9 | 100.0 | UBC848 | (CA)8AGG | 56 | 8 | 8 | 100.0 |
| ISSR10 | (GA)8T | 50 | 9 | 8 | 88.9 | UBC862 | (AGC)6 | 68 | 9 | 6 | 66.7 |
| LOL2 | (CT)8GC | 56 | 8 | 6 | 75.0 | UBC873 | (GACA)4 | 48 | 11 | 6 | 54.5 |
| LOL9 | (CAC)3GC | 38 | 9 | 8 | 88.9 | UBC886 | YXY(CT)7 | 52 | 10 | 8 | 80.0 |
| PHV6 | CCA(CT)3 | 57 | 8 | 3 | 37.5 | Total | 276 | 215 | 77.9 |
Y = GAC, X = GAT.
PCR was carried out in a TECHNE-brand FTC41H2D thermocycler, with the following program: initial denaturation at 93 °C for 1 min, followed by 40 cycles, each with 20 s at 93 °C, 60 s at the annealing temperature of the tested primer and 20 s at 72 °C, and a final extension at 72 °C for 6 min. The sample was cooled to 10 °C. The final products were brought to electrophoresis in 2 % agarose gel with 1x TAE; ethidium bromide staining and photodocumentation were then performed.
From the matrix of binary data obtained from the genomic fingerprints, the Jaccard similarity coefficient (S rs ) was constructed for each pair of genotypes (Khattree & Naik, 2000). With the dissimilarity matrix (d = 1 - S rs ), clustering was performed using Ward’s minimum variance method with Infostat statistical software. The result was the formation of three groups, of which two considered genetically different were chosen. These two were called X and Y.
Evaluation of fruit yield of intergroup crosses
Twelve elite F8 high-fruit-yield lines were selected, six belonging to group X (lines L5BI, L37SI, L59BI, L61BI, L65BI and L76BI) and six to Y (lines L6BI, L45BI, L68BI, L69BD, L80BI and L88BI). They were sown in February 2013 and the 36 (6x6) intergroup direct single crosses (SCs) were performed; because no maternal effects in tomato have been reported, the lines of groups X and Y were used as females and males, respectively. Upon reaching consumption maturity, the fruits were harvested and the seed of each cross was separated and processed.
In order to determine the fruit yield of the SCs, they were sown in February 2014 and 2015, in 200-well polystyrene trays with peat moss as substrate. The transplant was made 35 das in a greenhouse under a hydroponic system. Black 18-L polyethylene bags with volcanic foam substrate were used. The nutrient solution used was the one proposed by Cadahia (2000) for tomato; the amount applied varied according to the phenological stage and climatic conditions. Plant density was 3.3 per m-2.
The experimental unit consisted of two pots, each with two plants. A randomized complete block experimental design with three replicates was used. Fruit yield was evaluated in the first four clusters. The response variables recorded were: fruit number (FN) per square meter, total fruit yield (TFY) in kg∙m-2, commercial fruit yield (CFY) in kg∙m-2 and fruit firmness (FF) recorded in kgf∙cm-2. A fruit reached the category of commercial fruit if its weight was greater than 100 g and it had no physical or mechanical damage, physiological disorder or damage by pests and diseases that demerit its appearance. FF was quantified in four fruits per experimental unit, twelve days after having been harvested in the breaker ripening stage and having remained at room temperature. A manual GY-1 fruit penetrometer (Sundoo Instruments) was used.
Prediction of single-cross performance using BLUP and RR-BLUP
BLUP
The coefficients of coancestry (f ij ) based on ISSR (Bernardo, 1993) were calculated according to the expression:

where S ij is the Jaccard similarity estimated with molecular markers between the lines i and j of the group X, S i- is the average proportion of ISSR variants that i shares with all the lines of the opposite hetertic group (Y) and S j- is the average proportion of ISSR variants that the line j shares with all the lines of the opposite hetertic group (X). As by definition the coefficients of coancestry are not negative, those that resulted were equal to zero.
The model for fruit yield (y) was (Bernardo, 1994; Massman et al., 2013):
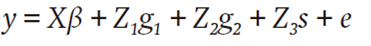
where y is a p×1 vector of p observed yields of the N single crosses, β is a c×1 vector of fixed effects of the c evaluation environments, g 1 is a n 1×1 vector of random effects of general combining ability (GCA) of the lines of group X, g 2 is a n 2×1 vector of random effects of GCA of the lines of group Y, s is a N×1 vector of the random effects of specific combining ability (SCA) of the N single crosses, e is the p×1vector of residuals and X, Z 1, Z 2, and Z 3 are matrices whose elements are 0 or 1 to denote absence or presence of effects relating to y with β, g 1, g 2 and s, respectively.
The covariance (Cov) between the intergroup SCs ij and i'j' was expressed on the basis of a k loci model and the simplification resulting from the derivation of Melchinger (1988):

where V A(X/Y) is the additive variance of the alleles i and j from the group X or Y through the k loci of i’ and j’ involved and V D(XY) is the dominance variance through the k loci of the allelic pairs, each formed by an allele of X and one of Y. Restricted maximum likelihood estimates were obtained by iteration from equation routes for V E (non-genetic variance), V A(X/Y) , V A(Y/X) and V D(XY) (Henderson, 1985; Bernardo, 1994; Gbur et al., 2012). In addition to the prediction, estimates of these variances were used to obtain heritabilities.
Hybrid fruit yields were based on mixed model theory that produces linear, unbiased and minimum variance predictors (BLUP). Hybrid performance prediction was based on the observed yields of the remaining hybrids, called predictor hybrids. According to Bernardo (1994), the yield adjusted by fixed effects of these hybrids (y T ) was expressed as:

where R is a diagonal matrix and the elements are the reciprocal of the number of environments of the experiment. On the other hand, the vector formed with the predicted yields of the unknown hybrids (y U ) was calculated according to the expression:

where C UT is a N U ×N T matrix whose ij-th element is the genetic covariance between the i-th hybrid subject to prediction and the j-th predictor hybrid, and C TT is the N T ×N T matrix of the covariances of the n predictor hybrids. The C UT elements and those outside the CTT diagonal were calculated according to the expression of the covariance between an unknown hybrid and a predictor, in terms of coancestry and genetic variances.
RR-BLUP
The prediction of SC yield using genomewide prediction was made by means of RR-BLUP with the linear model proposed by Massman et al. (2013) for N M markers:

where y, X, β and e were as already defined, m
1 is a N
M
×1 vector of GCA random effects of markers of the maternal lines, m
2 is a N
M
×1 vector of random effects of GCA of the markers of the paternal lines and m
3 is a N
M
×1 vector of GCA random effects associated with the allelic markers of both heterotic groups. W
1 and W
2 are incidence matrices whose elements were equal to 1 or -1. The elements of W
3 at a given locus were the same as the product of the elements of W
1 and W
2 at the same locus, as proposed by Massman et al. (2013). In theory  ,
,  ,
,  ), as well as m
1, m
2 and m
3 are independent; e is a random error vector of p×1 dimension and
), as well as m
1, m
2 and m
3 are independent; e is a random error vector of p×1 dimension and  .
.
To evaluate the BLUP prediction method in terms of sample size, we worked with sets of n predictor hybrids (n = 6, 12, 18, 24 and 30), selected at random from the 36 possible options. To verify the stability of the predictions, 1,000 random samplings were performed on each number of predictor hybrids (n) and the fruit yield of the remaining 36-n hybrids was predicted in each case. Subsequently, for each value of n, the correlations between the observed and corresponding predicted yields were calculated. In the case of RR-BLUP, n corresponded to the training set and 36-n to the test set. The procedure described was applied to the four variables.
To predict using BLUP, a program was built in the IML module of the SAS statistical package. The prediction with RR-BLUP was made based on the BGLR function library (Pérez & de los Campos, 2014) of the statistical package R.
Results and discussion
Selection of parental lines using ISSR
A total of 276 bands, of which 215 were polymorphic, were amplified. The number of bands per ISSR primer ranged from 2 to 18, with an average of 9.52 (Table 1). These values are low compared to those of Aguilera et al. (2011), who reported the amplification of 9 to 22 bands per primer, with an average of 14.4, although they found a lower level of polymorphism (34 %), with an average of 5.3 polymorphic bands per primer. In the present work, 7.4 polymorphic bands were amplified per ISSR with 77.9 % general polymorphism, with a minimum of zero and a maximum of 100 %.
Ward’s clustering method defined three sets of lines (Figure 1). The first group consisted of 17 lines (green to yellow), the second with four (yellow tones) and the third with 18 (orange to intense red). In this figure, the lighter blue tones indicate shorter genetic distance; therefore, light blue tones predominate within each group and darker tonalities among groups. No association between the groups generated with molecular markers and a phenotypic characteristic was detected. In each group there is diversity in the type of growth (determinate and indeterminate), type of fruit (saladette and ball) and fruit color (yellow, orange and red).

Evaluation of fruit yield and firmness of intergroup crosses
Of the 36 intergroup crosses evaluated (Table 2), in 2014 the values of the four variables were higher, whereas in 2015 there were on average fewer fruits (7) and kilograms of total (0.94) and commercial fruit (1.3) produced. However, the crosses behaved similarly within each environment. The same cross recorded the highest (or lowest) value for FN, CFY and TFY in both evaluations. In the case of FF, the cross with the highest value was not the same in the two years evaluated; however, the highest FF was associated with crosses involving the L68BI line and the lowest FF corresponded to crosses with the L59BI line (Table 2).
Table 2 Maximums, minimums, means and estimates of variances and heritabilities of four characters of 36 tomato single crosses in two production cycles (2014 and 2015), grown hydroponically under greenhouse conditions.
| Max, Min estimates of variances and h 2 | FN | TFY (kg∙m -2 ) | CFY (kg∙m -2 ) | FF (kgf∙cm -2 ) |
|---|---|---|---|---|
| Evaluation 2014 | ||||
| Max (cross) | 117.0 (L37SIxL80BI) | 13.723 (L76BIxL69BD) | 11.958 (L76BIxL68BI) | 13.83 (L5BIxL68BI) |
| Min (cross) | 51.7 (L76BIxL45BI) | 8.153 (L59BIxL88BI) | 4.373 (L37SIxL80BI) | 5.98 (L59BIxL88BI) |
| Mean | 77.3 | 10.488 | 8.630 | 9.44 |
| Evaluation 2015 | ||||
| Max (cross) | 102.0 (L37SIxL80BI) | 12.048 (L76BIxL69BD) | 10.736 (L76BIxL68BI) | 11.04 (L61BIxL68BI) |
| Min (cross / cruza) | 49.2 (L76BIxL45BI) | 7.358 (L65BIxL6BI) | 2.658 (L37SIxL80BI) | 6.81 (L59BIxL45BI) |
| Mean | 70.7 | 9.553 | 7.332 | 8.94 |
| Variances | ||||
| VACG1 | 184.85 | 2.837 | 4.753 | 6.714 |
| VACG2 | 147.53 | 2.083 | 4.120 | 5.881 |
| VACE | 39.67 | 0.586 | 1.390 | 1.662 |
| VE | 10.77 | 0.192 | 0.371 | 0.491 |
| h2 | 0.986 | 0.983 | 0.982 | 0.983 |
Max: maximums, Min: minimums, NF: fruit number, TFY: total fruit yield, CFY: commercial fruit yield, FF: fruit firmness, VACG1: variance of the effects of general combining ability of the lines of group X, VACG2: variance of the effects of general combining ability of the lines of group Y, VACE: variance of the effects of specific combining ability of the crosses, VE: error variance and h2: heritability. Estimates were made using molecular markers and BLUP.
Prediction of single-cross performance using BLUP and RR-BLUP
The coefficients of coancestry estimated by molecular markers were, in general, low. In the group X lines, they ranged from 0.01 between the pair of L5BI and L65BI lines, to 0.327 between L59BI and L65BI, with average coancestry of 0.108. In the group Y lines, inferior values, from 0 (in six combinations) to 0.175 between the pair L45BI and L80BI, with an average of 0.06, were presented.
The estimates of genetic and non-genetic variances of the four variables studied, with ISSR markers using BLUP (Table 2), allowed calculating the heritability (h 2) of each character (Bernardo, 1996). Thus, for TFY, CFY, and FF, the heritability was very high (0.98); FN recorded h 2 = 0.99. In the case of TFY, the estimated value of h 2 in this study is far from that published by Dordevic, Zecevic, Zdravkovic, Zivanovic, and Todorovic (2010) of 0.451. In addition to random error variations, this discrepancy can be attributed to differences between genetic materials and environments. Wessel-Beaver and Scott (1992) obtained h 2 estimates of 0.65 and 0.81 for yield of the same tomato population grown in Puerto Rico and Florida, respectively.
The heritability values in this study allow predicting success in the selection of the best hybrids, as well as in a selection-based breeding program. The ratio of specific combining ability variance (V SCA) to total genetic variance among SCs was 0.107, 0.106, 0.135 and 0.117, for FN, TFY, CFY and FF, respectively. Similar values were reported by Massman et al. (2013) in maize by using BLUP (from 0.10 for moisture to 0.18 for grain yield). Based on the above, it can be inferred that in this research BLUP exploited additive effects to a greater extent than dominance.
Correlations between observed and predicted yields
The average of 1,000 correlations between the predicted value and the recorded field value for each set of n predictor hybrids is summarized in Table 3. Both BLUP and RR-BLUP predicted adequately in the four variables analyzed, and in all cases BLUP estimated values closer to the real ones than RR-BLUP. As expected, when n was increased the values of the correlations were also increased, although from n = 24 these increases were of low magnitude and even a reduction was recorded. In this study, with 18 predictor hybrids (n = 18), the greatest stability in the predictions was obtained and it would be the number of ideal predictors in a cost scenario where an increase in n implies greater investment.
Table 3 Average cross-validation correlations for two methods (BLUP and RR-BLUP) for predicting tomato hybrids in terms of four variables. Data correspond to 1,000 independent random samples of 36 predictor hybrids.
| N | FN | TFY (kg∙m -2 ) | CFY (kg∙m -2 ) | FF (kgf∙cm -2 ) | ||||
|---|---|---|---|---|---|---|---|---|
| BLUP | RR-BLUP | BLUP | RR-BLUP | BLUP | RR-BLUP | BLUP | RR-BLUP | |
| 6 | 0.53 | 0.45 | 0.52 | 0.36 | 0.36 | 0.25 | 0.41 | 0.32 |
| 12 | 0.72 | 0.66 | 0.69 | 0.58 | 0.48 | 0.40 | 0.57 | 0.55 |
| 18 | 0.80 | 0.75 | 0.76 | 0.68 | 0.55 | 0.49 | 0.65 | 0.63 |
| 24 | 0.83 | 0.80 | 0.79 | 0.73 | 0.58 | 0.54 | 0.69 | 0.68 |
| 30 | 0.83 | 0.83 | 0.75 | 0.69 | 0.57 | 0.53 | 0.71 | 0.67 |
| Mean | 0.74 | 0.70 | 0.70 | 0.60 | 0.51 | 0.44 | 0.61 | 0.57 |
N: number of predictor hybrids, BLUP: best linear unbiased prediction, RR-BLUP: ridge regression BLUP, FN: fruit number, TFY: total fruit yield, CFY: commercial fruit yield and FF: fruit firmness.
When considering each variable separately, FN recorded the highest correlation coefficients (from 0.45 to 0.83), followed by TFY (0.36 to 0.73), FF (0.32 to 0.68) and lastly CFY (0.25 to 0.54), with RR-BLUP. The correlation values between observed and predicted values with BLUP maintained the same trend: FN (0.53 to 0.83), TFY (0.52 to 0.79), FF (0.41 to 0.71) and lastly CFY (0.36 to 0.58).
The correlations obtained for TFY are generally similar to those reported by Hernández-Ibáñez, Sahagún-Castellanos, Rodríguez-Pérez, and Peña- Ortega (2014) in tomato (between 0.45 and 0.79), and by Bernardo (1994) in maize grain yield. The latter group used RFLPs and the highest correlations were 0.80. The high correlations obtained suggest that the method used to predict the yield of tomato hybrids is promising. However, extrapolation must be made with reservations, since the correlation between observed and predicted hybrids increases as the number of predictor hybrids increases, but only up to a certain level, after which one runs the risk of having smaller and even negative correlations. In addition, the results presented correspond to a relatively small set of SCs. Bernardo (1996) applied this methodology at a larger scale (16 combinations of nine heterotic groups in maize), and the correlations between predicted and observed yields that he obtained were slightly lower (from 0.426 to 0.762), very similar to those obtained in the present work.
Massman et al. (2013) made a comparison between BLUP and RR-BLUP on four variables in maize and produced high correlations (0.87, 0.90, 0.69 and 0.84, for grain yield, grain moisture, stalk and root lodging, respectively), without significant differences between methodologies; therefore, they affirmed that RR-BLUP did not surpass the results obtained with BLUP. These results suggest that the genetic factor may modify the predictive ability of the models.
The results obtained in the present work in tomato can be considered to be in agreement with those reported in maize, despite the fact that they are contrasting species. While tomato is an autogamous species with a low level of heterosis, maize is a cross-pollinated species with high heterosis expressions. In tomato, in addition to TFY, CFY and FF are very important after the harvest, so other genes in addition to those that strictly control yield are involved and thus adversely affect the correlations between the various yield components and the production of tomato fruit. Epistatic and linkage effects, among other genetic factors, in addition to the environment, can also affect the correlation. This explains the difficulty in predicting these characters, and therefore the low prediction levels obtained.
Conclusions
The correlation coefficients between observed and predicted values for FN, TFY, CFY and FF, estimated by BLUP and RR-BLUP in tomato SCs, ranged between 0.25 and 0.83, values that suggest that these methods have value for breeders.
BLUP consistently recorded higher correlation results between observed and predicted values, compared to RR-BLUP. In both cases, the magnitude of the correlations always increased when n increased. Therefore, in order to achieve greater accuracy and reliability in predictions made with BLUP or RR-BLUP, a greater number of predictor crosses must be evaluated in the field, in as many environments as funding allows.

