


Servicios Personalizados
Revista
Articulo
 Inglés (pdf)
 Artículo en XML
 Referencias del artículo
 Enviar artículo por email
Indicadores
-
 Citado por SciELO
 -
 Accesos
Links relacionados
-
 Similares en
SciELO
Similares en
SciELO
Compartir

 Permalink
Revista Chapingo. Serie horticultura
versión On-line ISSN 2007-4034versión impresa ISSN 1027-152X
Rev. Chapingo Ser.Hortic vol.21 no.3 Chapingo sep./dic. 2015
https://doi.org/10.5154/r.rchsh.2014.04.015
Artículo científico
Determination of the nitrogen requirement for habanero pepper (Capsicum chínense Jacq.)
Determinación del requerimiento de nitrógeno del chile habanero (Capsicum chínense Jacq.)
Gelacio Alejo-Santiago1; Gregorio Luna-Esquivel1; Rufo Sánchez-Hernández2*; Eduardo Salcedo-Pérez3; Juan Diego García-Paredes1; Víctor Manuel Jiménez-Meza1
1 Unidad Académica de Agricultura, Universidad Autónoma de Nayarit. Carretera Tepic-Compostela km. 9, Tepic, Nayarit, C.P. 63780, MÉXICO.
2 División Académica de Ciencias Agropecuarias, Universidad Juárez Autónoma de Tabasco. Carretera Villahermosa-Teapa km. 25.5, Ranchería La Huasteca, municipio del Centro, Tabasco, C.P. 86280, MÉXICO. Correo-e: rusaher@hotmail.com (*Autor para correspondencia).
3 Departamento de Madera, Celulosa y Papel, Universidad de Guadalajara. Carretera Guadalajara-Nogales km. 15.5, Jalisco, C.P. 45110, MÉXICO.
Received: April 03, 2014.
Accepted: October 2, 2015.
Abstract
An experiment was conducted under protected conditions using soilless culture to determine the internal nitrogen requirement (INR) for habanero pepper (Capsicum chínense Jacq.) variety Big Brother. Treatments consisted of four concentrations of nitrate (NO3-) in nutrient solution (5, 10, 15 and 20 meq·L-1). The response variables were dry matter (DM) production and N concentration in the different plant organs. The results indicate that a plant produces an average of 357.1 g DM, of which 64.5 % is fruit, while the rest is distributed in stem, leaves and flowers. However, with regard to DM weight, leaves and flowers concentrated more N than fruit, with 2.3 and 3.3 % respectively, while fruit concentrated 1.5 % N. It was found that the NO3- concentration in the nutrient solution had a significant effect on the N concentration in total DM, ranging from 1.06 to 2.74 %. The highest yield was obtained in plants treated with the 15 meq·L-1 NO3- concentration, while the concentration with 20 meq·L-1 significantly reduced fruit yield. The minimum N concentration in total biomass when maximum fruit yield was reached was 2.2 %, a value that was considered as the INR for the crop. Based on this value, the N requirement for habanero pepper variety Big Brother is 5.1 kg per ton of fruit.
Keywords: soilless culture, crop nutrition, nutrimental removal, internal requirement.
Resumen
Se realizó el experimento bajo condiciones protegidas e hidroponía para determinar el requerimiento interno (RI) de nitrógeno (N) en chile habanero (Capsicum chínense Jacq.), variedad Big Brother. Los tratamientos consistieron en cuatro concentraciones de nitrato (NO3-) en la solución nutritiva 5, 10, 15 y 20 meq·L-1. Las variables de respuesta fueron la producción de materia seca (MS) y las concentraciones de N en los diferentes órganos de la planta. Los resultados indicaron que una planta en promedio produce 357.1 g de MS; de los cuales 64.5 % corresponde a frutos, el resto se distribuye en tallo, hojas y flores. No obstante, con respecto al peso de MS, las hojas y flores son las que concentran más N, 2.3 y 3.3 % respectivamente; mientras que los frutos solo 1.5 %. Se observó que la concentración de NO3- en la solución nutritiva tuvo efecto significativo en la concentración de N en la MS total, con intervalo de 1.06 a 2.74 %. El mayor rendimiento se obtuvo en las plantas tratadas con la solución de 15 meq·L-1; mientras que la concentración de 20 meq·L-1 redujo significativamente el rendimiento de fruto. La concentración mínima de N en la biomasa total cuando se obtuvo el máximo rendimiento del fruto fue de 2.2 %, valor que fue considerado como el RI de N para el cultivo. Con base en este valor, el requerimiento de N para chile habanero variedad Big Brother fue de 5.1 kg por tonelada de fruto.
Palabras clave: hidroponía, nutrición de cultivos, extracción nutrimental, requerimiento interno.
INTRODUCTION
Improper fertilizer use is a factor in environmental degradation. On the one hand, an insufficient dose from the nutritional point of view generates low yields, while an excessive one generates high economic and environmental costs. Therefore, in recent decades, a balanced fertilization approach, which consists of supplying nutrients in the amount and at the time required by the crop, has been promoted (Ryan, 2008). Under this view, knowledge regarding crop nutrient requirements and nutrient supply, based on chemical analysis of the soil and plants, is needed.
According to Etchevers (1999), information on the nutrient content of plants at harvest time, along with the expected or possible yields, enables us to calculate the nutrient demand (ND), and thereby determine the kilograms of nutrients per hectare that plants need to remove and incorporate into their tissues to achieve the highest possible yields. According to Rodríguez, Pinochet, and Matus (2001), calculating ND requires knowing the crop's internal requirement (IR), which they defined as the minimum optimum concentration of the nutrient in the dry matter produced. In addition, they stated that to facilitate the calculation of ND based on the harvested product, factors have been established from the IR and the proportion of the harvested product in the total aboveground biomass produced. Also, other methodologies have been put forward that indicate that it is possible to determine the internal nitrogen requirement (INR) by determining its concentration during growth phases, although such methodologies indicate that DN varies based on phenological stages, and that plant organs are continually being adapted depending on N requirements (Caloin & Yu, 1984).
The close relationship that N has with some specific activities of the various plant organs makes it possible to indirectly identify some of these physiological functions. One of them is respiration, which has a close correlation with the accumulation of N in the different plant organs. It has been observed that by increasing the respiration rate, the tissue N content increases, with the leaves and roots having the greatest N demand to carry out this process (Reich et al., 2008). The same authors proposed that quantifying N in plant components may be an indirect measure to determine respiration rate. Also, the photosynthetic capacity of plants is related to the N content, since this element is a constituent of thylakoid proteins, which are involved in the Calvin cycle (Evans, 1989; Barker & Bryson, 2007). Because respiration and photosynthesis are functions that, preferably, are made by the aboveground part of plants, there are other approaches in which it is stated that the IR is the optimum nutrient concentration in total aboveground biomass at harvest time (Greenwood et al. 1980). In this sense, a methodology for determining the IR in vegetables consists of providing increasing doses of the nutrient under evaluation to a given crop, seeking to maintain the sufficiency level in the rest of the nutrients, a situation that is difficult to control under experimental field conditions; therefore, it is recommended that this type of research be conducted under controlled conditions, i.e., hydroponically (Bugarín, Galvis, Sánchez, & García, 2002).
Etchevers (1999) pointed out that in soils it is common to find a deficit of N, P and K, and eventually of B and Mg. In this regard, Marschner (2012) mentioned that the optimum N concentration to achieve good growth and development in most crops is 2 to 5 %, although this range may vary depending on the species and the state of development of the organs. Havlin, Tisdale, Beaton, and Nelson (2004) indicated that the N level in plants is between 1 and 5 % of total DM. Some of the important N functions in plants are related to the molecular synthesis of nucleic acids, amino acids, proteins, chlorophylls and alkaloids; in addition, the nitrate ion (NO3-) and other reduced forms of N contribute to reducing the hydric potential of the vacuole in the osmoregulation process (Cárdenas-Navarro, Sánchez-Yánez, Farías-Rodríguez, & Peña-Cabriales, 2004). Considering that water is the main limiting factor for plant development and that it is the only substance capable of integrating growth and metabolic activity at the cellular level, the role of N as an osmotic agent has been considered very important in plant nutrition (Mcintyre, 2001; Mengel, Kirkby, Kosegarten, & Appel, 2001).
Another important factor in the dynamics of the N concentration in plants is the growth stage. In some crops, such as cereals, the greatest N demand occurs during grain production, and even within this vegetative stage there is differentiation in the need for this nutrient, being during grain filling where up to two-thirds is required. According to Lemaire, Jeuffroy, and Gastal (2008), knowing the correct amount and time for supplying a nutrient demanded by a crop allows controlling its status without falling into excesses or deficits, which can affect both costs and the environment. In this sense, Fageria, Santos, and Cutrim (2008) determined that the genetic factor influences the N requirement in plants; therefore, it is necessary to specifically identify the appropriate amount of N for each species and variety as a strategy to get the best possible yield.
Pereira et al. (2013) highlighted the importance of knowing the nutrient status of plants in order to generate the most appropriate fertilizer doses to maximize yields, and the need to identify the amount demanded, the time at which it is required and the relationships maintained among the different nutrients. Furthermore, although eventually visual diagnosis is a tool to identify deficiencies, tissue analysis, particularly of the leaves, is the most appropriate strategy for generating more accurate fertilizer dose recommendations.
Although studies have been performed to determine the IR of various crops (Rodríguez, 1993; Galvis, Alvarez, & Etchevers, 1998; Bugarín et al., 2002), there are others for which there is a lack of information, which prevents, among other things, determining the optimum fertilization doses for different growing areas. One such crop is the habanero pepper (Capsicum chinense Jacq.), which, in recent years, has aroused great interest in the United States and Canada markets, since it is considered one of the spiciest and aromatic peppers in the world, characteristics that have made it one of the favorites in international cuisine; it has a wide variety of applications, such as natural colorants, as a source of minerals and vitamins and as an input in the pharmaceutical and chemical industries. The leading exporters of this vegetable are Mexico and Belize; it is usually distributed in fresh or paste form (Ruiz-Lau, Medina-Lara, & Martínez-Estévez, 2011).
Due to the importance of habanero pepper in Mexico's economy and the role played by nitrogen in the physiology of this plant, the aim of this study was to determine the internal requirement, and with this calculate the nitrogen nutrient demand of habanero pepper (Capsicum chínense Jacq) variety Big Brother, under greenhouse and hydroponic conditions.
MATERIALS AND METHODS
The experiment was conducted in a greenhouse equipped with a hydroponic system at Autonomous Nayarit University (UAN), in Xalisco county, state of Nayarit, Mexico, located at coordinates 21° 25' 33.96" NL and 104° 53' 30.68" WL. During the production cycle the minimum and maximum temperatures recorded were 16 and 34 °C, respectively.
Seeds of habanero pepper (Capsicum chinense Jacq.) variety Big Brother were sown in 200-cavity plastic trays. When seedlings presented two true leaves, they were transplanted into 20-L polyethylene bags, which were filled with red basaltic volcanic scoria substrate, with grain size of 3-6 mm in diameter.
Treatments consisted of four concentrations of nitrates (5, 10, 15 and 20 meq·L-1) in the nutrient solution (NS). These solutions were formulated in accordance with the methodology proposed by Steiner and Van-Winden (1970). As macronutrient sources, potassium nitrate, calcium nitrate, 85 % phosphoric acid, 98 % sulfuric acid, potassium sulfate, magnesium sulfate, calcium sulfate and 55 % nitric acid were used, while H3BO3, MnSO4·4H2O, ZnSO4·7H2O and CuSO4·5H2O were used as micronutrient sources. The Fe was provided in the form of EDTA-Fe. The details of the chemical composition of the NS evaluated are presented in Table 1.
As can be seen, as the concentration of nitrates (NO3-) in treatments 1, 2 and 3 was increased, the concentration of sulfates (SO4=) was modified, without exceeding the anion concentration of 20 meq·L-1. In the case of treatment 4, it was necessary to raise the K+ concentration to 12 meq·L-1 in order to maintain the electrolyte balance between anions and cations. The adjustment of NS pH between 6 and 6.5 was done by providing NaOH or 1N H2SO4, every 24 hours.
The NS was provided by a drip irrigation system, applying six daily irrigations of 300 mL per plant. Each irrigation lasted 5 minutes, with 90-minute intervals, starting at 9:00 am The chemical composition expressed in meq·L-1 of drinking water, used in the preparation of the NS, was 2.1 Na+, 0.15 K+, 0.3 Mg2+, 0.1 Ca2+, 0.1 SO42-, 1.3 HCO3- and 0.1 Cl-, as well as EC 0.20 dS·m-1, pH 6.19 and SAR 4.5; therefore, it was classified as C1S1 according to the Riverside standard (Dell'Amico, Morales, & Calaña, 2011). As response variables, DM production, N concentration in different plant organs and agronomic yield (AY) were evaluated.
At the beginning of harvest time, 25 plants per treatment were labeled. For seven weeks fruit collections were performed, with one-week inStervals. The AY was determined from the sum of the weights of the collected fruits, regardless of their size and quality. At the end of the harvest period, the plants were cut at the base of the stem, they were weighed complete and the leaves, stems, flowers and fruits were sectioned. The sectioned parts were washed with distilled water and dried at 65 °C in a Lumistelf Model HTP-42 forced air oven, to constant weight. Once the samples were dried, they were ground and passed through a 20-mesh screen (850 μm in diameter). Subsequently, the samples were prepared using as extractant a 2:1 mixture of nitric acid and perchloric acid, according to the methodology proposed by Alcántar and Sandoval (1999).
In this experiment, the root was not considered, as suggested by the methodology proposed by Greenwood et al. (1980). Some studies report that the proportion of DM corresponding to the root ranges from 5 to 7 %, while the stem, leaves and fruit account for 15, 16 and 64 % respectively, i.e. together they represent between 95 and 97 % of total DM produced by pepper plants. Besides the above, it is reported that the lowest levels of N, P and K are concentrated in the root mass (Terbe, Szabó, & Kappel, 2006).
The N was determined by the Kjeldahl method, modified by Bremmer and Mulvaney (1982) to include NO3-. The P concentration was determined by the ammonium molybdate method (Chapman & Pratt, 1979), the K+ by flamometry (Kalra, 1998), and the Ca2+, Mg2+, Cu2+, Fe2+, Mn2+ and Zn2+ by spectrophotometry (Kalra, 1998).
The experiment was established under a completely randomized design, with four treatments and five replications; each experimental unit included five plants. Data were analyzed by analysis of variance and the Tukey test (P ≤ 0.05) after transforming the percentages using the arcsine function. Furthermore, quadratic regression analysis was performed to obtain the relationship between the N concentration in total biomass (TB) and AY. For the above, the Statistical Analysis System, ver 6.12 (SAS, 2013) was used.
RESULTS AND DISCUSSION
Dry matter (DM) production
By increasing the NO3- concentration in the NS, the DM production in the different plant organs significantly increased (P ≤ 0.01). It was noted that with the dose of 20 meq·L-1, the DM corresponding to leaves, stems and flowers was the highest compared to the other treatments. However, the greatest total DM production was recorded in the 15 meq·L-1 treatment (Table 2).
These results are due to the decrease in DM production in fruit, starting with the 20 meq·L-1 treatment, which meant a reduction in total DM, since the biomass corresponding to this organ is equivalent to 61 % of the plant total. DM gain in leaves, stems and flowers, by increasing NO3- levels in the NS, coincides with that reported by Landis (2000), who notes that high N levels promote rapid cell division and elongation. Salisbury and Ross (2000) indicated that slow growth in plants may be due to low N availability, so nitrogen fertilization, supplemented with other elements such as P and K, contributes to increased plant height (Close, Bail, Hunter, & Beadle, 2005).
Nutrients are involved in specific physiological functions in plants, and they are also structural components of cells; in the case of N at high doses, it is regarded as a stimulator of increased vegetative growth (Rubio-Covarrubias, Grünwald, & Cadena-Hinojosa, 2005). This may explain the reduction in DM production in fruit, since plants that received a higher N dose had increased leaf and stem production, which required a greater amount of minerals in their tissue formation, diverting it from fruit filling, so towards the end of the harvest cycle it was eventually reflected in lower DM production in the fruits. The habanero pepper, like other vegetables, is phenologically characterized because the greatest biomass production in fruits is recorded during the first harvests or cuts, whereas, as a result of the senescence of the plant and its energy expenditure, during the last collections, even though a greater number of fruits can be obtained, they are smaller, so total DM production is reduced.
According to Bar-Tal, Aloni, Karni, and Rosenberg (2001), a15 meq·L-1 N dose in the NS causes decreased DM production in peppers grown hydroponically. In research conducted in other species of vegetables, similar results have been reported. Tei, Benincasa, & Guiducci (2000) noted that the N supply to lettuce plants may have greater effect on fresh weight, rather than DM production, because it has been shown that the accumulation of N as NO3- exerts an osmotic effect on the water content in the plant. Lefsrud, Kopsell, and Kopsell (2007) reported that N addition in lettuce can increase its production, an effect that was also indicated by Kandil and Gad (2009) in broccoli plants. The results obtained in the present study confirm that crops have an N saturation point; therefore, DM production stops or is reduced, even though the fertilization doses are increased.
The concentrations of 5 and 10 meq·L NO3- can be considered deficient in N supply for growing habanero pepper, because, as can be seen, DM production in leaf and fruit were the lowest (Table 2). A study conducted by Doncheva, Vassileva, Ignatov, and Pandev (2001) in Capsicum annuum L. cv. Zlatan medal, indicates that N deficiency affects CO2 assimilation and photosynthetic efficiency, so DM accumulation is directly affected by both processes.
N concentration in plant organs
The N concentration in different harvested organs is presented in Table 3, where highly significant differences among treatments (P ≤ 0.01) are shown. The accumulation of N in different plant components increased as the NO3- concentrations in the MS were increased.
As can be seen, the greatest N accumulation in the plant organs was recorded in the 20 meq·L-1 treatment (Table 3); this is a result of the high affinity between the root system and the ion NO3-. Glass et al. (2002) reported that many upper plants have a higher affinity for this ion, enabling more efficient N absorption. However, the highest DM production was recorded in the 15 meq·L-1 treatment, so it appears that this element can be absorbed and structurally accumulated in different plant organs, without this meaning greater yield of the organ of interest. Conversely, higher biomass in stems, leaves and flowers could use a greater amount of nutrients and cause lower translocation to the fruits, as well as a lower harvest yield, such as occurred with the 20 meq·L-1 treatment.
This phenomenon can be interpreted as the accumulation of unnecessary or excessive nutrients, an effect described by Mourão and Brito (2001) as luxury N uptake, which not only reduces DM production but also even delays the time taken to reach commercial maturity. Reich et al. (2008) identified a close correlation between the respiration rate and N accumulation in different plant organs; they also observed that by increasing the respiration rate the N content of their tissues was increased, with the leaves and roots demanding the most N. The aforementioned authors also proposed that quantifying N in the components of the plant may be an indirect measure of its respiration rate.
The concentrations of 5 and 10 meq·L-1 NO3- recorded the lowest N levels in leaf, stem, flower and fruit, plus they were the ones with the lowest fruit production, so these doses can be considered deficient for this crop. It was noted that the concentration of 2.8 % N in total biomass, which was obtained in the 20 meq·L-1 NO3-treatment, was similar to the 3.0 % obtained by Noh-Medina, Borges-Gómez, and Soria-Fregoso (2010) by applying a dose of 130 kg N per hectare via fertigation to a habanero pepper crop. Undoubtedly, the criteria for determining the appropriate fertilization dose under field conditions are different from those of a hydroponic system; in both cases, the results suggest that when the N contribution reaches a saturation level, it may cause an overdose that would affect both DM production and potential yield. From this comes the importance of generating a dose that addresses fertilizer recovery efficiency, as well as considers the N from other supply sources, such as, possibly, soil organic matter. Moreover, Medina-Lara et al. (2008) reported a 3.5 % N concentration in leaf by using nutrient solutions with concentrations of 308 and 420 mg-L-1 N; that is, with levels higher than those used in this study, the N concentrations in the leaf component were similar.
Agronomic yield (AY) and internal N requirement (INR)
Agronomic yield is the most important in production, as it represents the DM component that generates income for producers. This yield is the result of an adequate nutrient supply, and good functioning of the plants. It was observed that increasing the NO3-concentration in the NS, up to a dose of 15 meq·L-1, resulted in an increase in AY. However, starting with a dose of 20 meq·L-1, the AY began a significant decline (Figure 1).
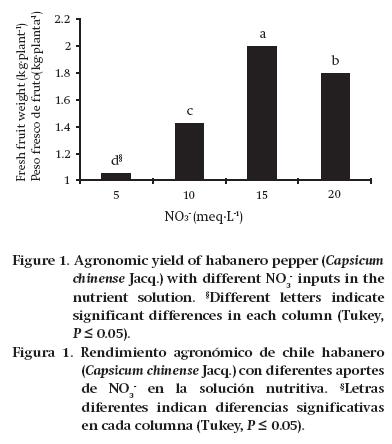
According to Evans (1983), it is inappropriate in plant nutrition to provide only NO3- as a source of N; this is because once the NO3- enters the plant, it has to expend energy converting the NO3- to NH4+ to continue the development pathway of amino acids and proteins. This energy expenditure can explain, in part, the decrease in AY that occurred with the 20 meq·L-1 NO3- treatment. This author stated that the relationship between the N concentration in leaves and the CO2 assimilation rate is quadratic, which means that there is a point at which the N concentration does not correspond to an increase in CO2 uptake. In this sense, Medina-Lara et al. (2008) evaluated increasing N doses in the NS for growing habanero pepper, concluding that 210 mg·L-1 N is the optimum dose, since it allows greater fruit set, while exceeding that concentration decreases the number of fruits. In the case of the present study, the 15 meq·L-1 NO3- solution was the one that generated the most fresh fruit production (kg·plant1). In this regard, Pire and Colmenarez (1994) observed that increasing the N dose from 270 to 360 kg·ha-1 in sweet pepper significantly reduced fruit yield. Borges-Gómez et al. (2010) stated that to improve AY and fruit quality it is necessary that the conditions in which the plant develops allow good nutrient uptake, regardless of the increase in fertilization doses.
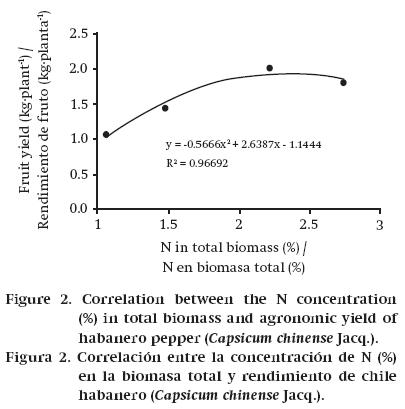
As already mentioned in Table 3, the N concentration in total aboveground biomass was increased by increasing the NO3- concentrations in the NS. It was also noted that fruit yield presented the same trend up to the concentration of 15 meq·L-1 NO3-, since from 20 meq·L-1 it decreased significantly.
According to the results obtained in this research, the INR in habanero pepper is 2.2 % (Figure 2). Taking into account that the crop produced 0.232 kg DM per kilogram of fresh fruit, then to get a ton of fresh habanero pepper requires the production of 232 kg DM, which creates a demand for 5.1 kg N. This value is less than that reported by Pire and Colmenarez (1994) for sweet pepper; by quantifying an N removal of 97.65 kg·ha-1, with yield of 12.07 t de fruit, the demand per ton of fruit amounts to 8.09 kg N; however, these authors suggest that with this level of removal there may have been an oversupply of N to the crop.
Nutrient content in total biomass
NO3- concentrations showed a significant impact on the absorption of other ions present in the NS. An upward trend was observed in most ions, with the exception of Ca and Fe, where no significant differences were observed (Table 4). Other research suggests that NO3-, provided as a source of N in the solution, helps raise the salinity of that NS (González-Raya et al., 2005), which affects both the transpiration and absorption of other nutrients. According to Villa-Castorena, Catalán-Valencia, Inzunza-Ibarra, and Sánchez-Cohen (2006), at the beginning of growth, salinity reduces transpiration and nutrient uptake, but at later stages of growth, salinity does not affect transpiration and increases nutrient uptake.
CONCLUSIONS
The N concentration in TB increased as the NO3-concentration in the NS increased. However, this increase did not have a directly proportional effect on AY. The highest yield was obtained with the 15 meq·L-1 solution. Plants treated with that solution recorded an N concentration in biomass of 2.2 %; this value was considered the INR for growing habanero pepper variety Big Brother. Based on this INR, the demand for N in the crop was 5.1 kg per ton of fresh fruit.
REFERENCES
Alcántar, G. G., & Sandoval, V. M. (1999). Manual de Análisis Químico de Tejido Vegetal. Guía de Muestreo, Preparación, Análisis e Interpretación. Sociedad Mexicana de la Ciencia del Suelo (Publicación especial No. 10). Chapingo, México. 156 p. [ Links ]
Barker, A. V., & Bryson, G. M. (2007). Nitrogen. In: Barker, A. V., & Pilbeam, D. J. (Eds.), Handbook of plant nutrition (pp. 21-50). CRC Press. Boca Raton, USA. [ Links ]
Bar-Tal, A., Aloni, B., Karni, L., & Rosenberg, R. (2001). Nitrogen nutrition of greenhouse pepper. II. Effects of nitrogen concentration and NO3-:NH4+ ratio on growth, transpiration, and nutrient uptake. Hortscience, 36(7), 1252-1259. Recuperado de http://hortsci.ashspublications.org/content/36/7/1252.full.pdf. [ Links ]
Borges-Gómez, L., Cervantes, C. L., Ruiz, N. J., Soria, F. M., Reyes, O. V., & Villanueva, C. E. (2010). Capsaicinoides en chile habanero (Capsicum chínense Jacq.) bajo diferentes condiciones de humedad y nutrición. Terra Latinoamericana, 28(1), 35-41. [ Links ]
Bremmer, L. M., & Mulvaney, C. S. (1982). Total nitrogen. In: Page, R., Miller, H., & Keeney, D. R. (Eds.), Methods of soil analysis. Part 2. Chemical and microbiological properties (pp. 595-634). Second edition. Madison, USA. [ Links ]
Bugarín, M. R., Galvis, S. A., Sánchez, G. P., & García, J. D. (2002). Demanda de potasio del tomate tipo saladette. Terra Latinoamericana, 20(4), 391-399. [ Links ]
Caloin, M., & Yu, O. (1984). Analysis of the time course of change in nitrogen content in Dactylis glomerata L. using a model of plant growth. Annals of Botany, 54, 69-76. [ Links ]
Cárdenas-Navarro, R., Sánchez-Yánez, J. M., Farías-Rodríguez, R., & Peña-Cabriales, J. J. (2004). Los aportes de nitrógeno en la agricultura. Revista Chapingo Serie Horticultura, 10(2), 173-178. [ Links ]
Chapman, H. D., & Pratt, P. F. (1979). Métodos de análisis para suelos, plantas y agua. Trillas. México, D.F. 195 p. [ Links ]
Close, D. C., Bail, I., Hunter, S., & Beadle, C. L. (2005). Effects of exponential nutrient-loading on morphological and nitrogen characteristics and on after-planting performance of Eucalyptus globulus seedlings. Forest Ecology and Management, 205(1-3), 397-403. doi:10.1016/j.foreco.2004.10.041. [ Links ]
Dell'Amico, R. J., Morales, G. D., & Calaña, N. J. M. (2011). Monitoreo de la calidad del agua para riego de fuentes de abasto subterráneas en la parte alta del nacimiento de la cuenca Almendares-Vento. Cultivos tropicales, 32(4), 71-81. [ Links ]
Doncheva, S., Vassileva, V., Ignatov, G., & Pandev, S. (2001). Influence of nitrogen deficiency on photosynthesis and chloroplast ultrastructure of pepper plants. Agriculture and Food Science in Finland, 10, 59-64. [ Links ]
Etchevers, J. D. (1999). Técnicas de diagnóstico útiles en la medición de la fertilidad del suelo y el estado nutrimental de los cultivos. Terra Latinoamericana, 17(3): 209-219. Recuperado de http://chapingo.mx/terra/contenido/17/3/art209-219.pdf. [ Links ]
Evans, J. (1989). Photosynthesis and nitrogen relationships in leaves of C3 plants. Oecologia, 78, 9-19. doi: 10.1007/BF00377192. [ Links ]
Evans, J. R. (1983). Nitrogen and photosynthesis in the flag leaf of wheat (Triticum aestivum L.). Plant Physiology, 72(2), 297-302. doi: org/10.1104/pp.72.2.297. [ Links ]
Fageria, N. K., Santos, A. B., & Cutrim, V. A. (2008). Dry matter and yield of lowland rice genotypes as influence by nitrogen fertilization. Journal of Plant Nutrition, 31(4), 788-795. DOI:10.1080/01904160801928471. [ Links ]
Galvis, S. A., Álvarez, S. E., & Etchevers, B. J. (1998). A method to quantify N fertilizer requirement. Nutrient Cycling in Agroecosystems, 51, 155-162. doi: 10.1023/A:1009714932119. [ Links ]
Glass, A. D. M., Britto, D. T., Kaiser, B. N., Kinghorn, J. R., Kronzucker, H. J., Kumar, A., Okamoto, M., Rawat, S., Siddiqi, M. Y., Unkles, S. E., & Vidmar, J. J. (2002). The regulation of nitrate and ammonium transport systems in plants. Journal of Experimental Botany, 53(370), 855-864. Recuperado de http://jxb.oxfordjournals.org/content/53/370/855.full.pdf. [ Links ]
González-Raya, E., Benavides-Mendoza, A., Ramírez, H., Robledo-Torres, V., Maiti, R., Reyes-López, A., Aguilera-Carbo, A. F., Fuentes-Lara, L. O., & Hernández-Valencia, R. E. M. (2005). Crecimiento de jitomate y calidad de frutos con diferentes concentraciones de nitrato. Terra Latinoamericana, 23, 105-111. [ Links ]
Greenwood, J. D., Cleaver, T. J., Turner, M. K., Hunt, J. Niendorf, K. B., & Loquens, S. M. H. (1980). Comparison of the effects of potassium fertilizer on the yield, potassium content and quality of 22 different vegetable and agricultural crops. The Journal of Agricultural Science, 95, 441-456. doi: 10.1017/S0021859600039496. [ Links ]
Havlin, J. L., Tisdale, S. L., Beaton, J. D., & Nelson, W. L. (2004). Soil fertility and fertilizers: an introduction to nutrient management. Seventh edition. Prentice Hall, Inc. New Jersey, USA. [ Links ]
Kalra, Y. P. (1998). Handbook of reference methods for plant analysis. CRC Press. Boca Raton, Florida, USA. [ Links ]
Kandil, H., & Gad, N. (2009). Effects of inorganic and organic fertilizers on growth and production of brocoli (Brassica oleracea L.). Factori si Procese Pedogenetice din Zona Temperata, 8, 61-69. [ Links ]
Landis, T. D. (2000). Manual de viveros para la producción de especies forestales en contenedor. In: Landis, T. D., Tinus, R. W., McDonald, S. E., & Barnett, J. P. (Eds.), Manual Agrícola (pp. 1-67, vol. 4). Department of Agriculture Forest Service. Washington, DC. USA. [ Links ]
Lefsrud, M. G., Kopsell, D. A., & Kopsell, D. E. (2007). Nitrogen levels influence biomass, elemental accumulations, and pigment concentrations in spinach. Journal of Plant Nutrition, 30(2), 171-185. doi: 10.1080/01904160601117838. [ Links ]
Lemaire, G. M., Jeuffroy, H., & Gastal, F. (2008). Diagnosis tool for plant and crop N status in vegetative stage theory and practices for crop N management. European Journal of Agronomy, 28, 614-624. doi: 10.1016/j.eja.2008.01.005. [ Links ]
Marschner, P. (2012). Mineral nutrition of higher plants. Academic Press. San Diego, CA, USA. [ Links ]
Mcintyre, G. I. (2001). Control of plant development by limiting factors: A nutritional perspective. Physiologia Plantarum, 113, 165-175. [ Links ]
Medina-Lara, F., Echevarría-Machado, I., Pacheco-Arjona, R., Ruiz-Lau, N., Guzmán-Antonio A., & Martínez-Estévez, M. (2008). Influence of nitrogen and potassium fertilization on fruiting and capsaicin content in habanero pepper (Capsicum chinense Jacq.). Hortscience, 43(5), 1549-1554. doi: 10.1007/978-94-010-1009-2. [ Links ]
Mengel, K., Kirkby, E. A., Kosegarten, H., & Appel, T. (2001). Principles of plant nutrition. Kluwer Academic Publishers. Dordrecht, Netherlands. [ Links ]
Mourão, I., & Brito, M. (2001). Effects to direct film crop cover and top dress Nitrogen on earliness and yield of broccoli crop (Brassica oleracea var. italic Plenk). Acta Horticulturae, 563, 103-109. doi: 10.17660/ActaHortic.2001.563.12 [ Links ]
Noh-Medina, J., Borges-Gómez, L., & Soria-Fregoso, M. (2010). Composición nutrimental de biomasa y tejidos conductores en chile habanero (Capsicum chinense Jacq.). Tropical and Subtropical Agroecosystems, 12(2), 219-228. [ Links ]
Pereira-Serra, A., Bungenstab, D. J., Estevão-Marchetti, M., Nunes-Guimarães, F. C., Do Amaral-Conrad, V., Soares-de Morais, H., Gonçalves-da Silva, M. A., & Pereira-Serra, R. (2013). Diagnosis and Recommendation Integrated System (DRIS) to assess the nutritional state of plants. In: Matovic, M. D. (Eds.), Biomass now-sustainable growth and use (pp. 129-146). InTech, Canada. doi: 10.5772/54576.
Pire, R., & Colmenarez, O. (1994). Extracción y Eficiencia de Recuperación de Nitrógeno por plantas de pimentón sometidas a diferentes dosis y fraccionamiento del elemento. Agronomía Tropical, 46(4), 353-369. [ Links ]
Reich, P. B., Tjoelker, M. G., Pregitzer, K. S., Wright, I. J., Oleksyn, J., & Machado, J. L. (2008). Scaling of respiration to nitrogen in leaves, stems and roots of higher land plants. Ecology Letters, 11, 793-801. [ Links ]
Rodríguez, S. J., Pinochet, T. D., & Matus, B. F. (2001). La fertilización de los cultivos. LOM Ediciones. Santiago de Chile. [ Links ]
Rodríguez, S. J. (1993). La Fertilización de los cultivos, un método racional. Colección en Agricultura. Facultad de Agronomía e Ingeniería Forestal. Pontificia Universidad Católica de Chile. Santiago de Chile. [ Links ]
Rubio-Covarrubias, O. A., Grünwald, N. J., & Cadena-Hinojosa, M. A. (2005). Influencia del nitrógeno sobre la infección de tizón tardío en el cultivo de papa en Toluca, México. Terra Latinoamericana, 23(4), 487-493. [ Links ]
Ruiz-Lau, N., Medina-Lara, F., & Martínez-Estévez, M. (2011). El chile habanero: su origen y usos. Ciencia, 70-77.
Ryan, J. J. (2008). A perspective on balanced fertilization in the Mediterranean region. Turkish Journal of Agriculture and Forestry, 32(2), 79-89. [ Links ]
Salisbury, F., & Ross, C. (2000). Fisiología Vegetal. Thomson Editores, Spain Paraninfo. Madrid, España. [ Links ]
Statistical Analysis System (SAS Institude). (2013). SAS/STAT 6.12 user's guide. Cary, NC, USA: Author. [ Links ]
Steiner, A. A., & Van-Winden, H. (1970). Recipe for ferric salts of ethylenedia minetetra acetic acid. Plant Physiology, 46, 862-863. [ Links ]
Tei, F., Benincasa, P., & Guiducci, M. (2000). Effect of nitrogen availability on growth and nitrogen uptake in lettuce. Acta Horticulturae, 533, 385-392. doi: 10.17660/ActaHortic.2000.533.47. [ Links ]
Terbe, I., Szabó, Z. S., & Kappel, N. (2006). Macronutrient accumulation in green pepper (Capsicum annuum L.) as affected by different production technologies. International Journal of Horticultural Science, 12(1), 13-19. [ Links ]
Villa-Castorena, M., Catalán-Valencia, E. A., Inzunza-Ibarra, M. A., & Sánchez-Cohen, I. (2006). La fertilización nitrogenada y la salinidad del suelo afectan la transpiración y absorción de nutrimentos en plantas de chile. Terra Latinoamericana, 24(3), 391-399. [ Links ]

