


Servicios Personalizados
Revista
Articulo
 Inglés (pdf)
 Artículo en XML
 Referencias del artículo
 Enviar artículo por email
Indicadores
-
 Citado por SciELO
 -
 Accesos
Links relacionados
-
 Similares en
SciELO
Similares en
SciELO
Compartir

 Permalink
Revista Chapingo. Serie horticultura
versión On-line ISSN 2007-4034versión impresa ISSN 1027-152X
Rev. Chapingo Ser.Hortic vol.21 no.1 Chapingo ene./abr. 2015
https://doi.org/10.5154/r.rchsh.2014.04.020
Comparison of the approaches mean-variance and mean-semivariance to choose an agricultural portfolio
Comparación de los enfoques media-varianza y media-semivarianza para elegir un portafolio agrícola
Albert León-Herrera; Miguel Ángel Martínez-Damián*; Laura Elena Garza-Bueno
Colegio de Postgraduados, División de Economía, Campus Montecillo. Carretera México-Texcoco km 36.5. Texcoco, Estado de México, C. P. 56230, MÉXICO. Correo-e: angel01@colpos.mx (*Autor para correspondencia).
Received: April 4, 2014.
Accepted: April 6, 2015.
Abstract
The objective of this research was to compare the method proposed by Markowitz (mean-variance) and the method proposed by Estrada (mean-semivariance), in the choice of an agricultural portfolio. The data were the returns of five agricultural products for the period 1980-2009; both the covariance matrix and semicovariance matrix were estimated to be used in either method. Later, a size n = 30 simulation of 100 replications was performed, to obtain the yields of each product, thus 100 solutions per method. For comparative purposes, a histogram was constructed; this was completed with the t test concluding that the average portfolio is the same under both methods.
Keywords: Semivariance, diversification, return, net earnings.
Resumen
El objetivo de esta investigación fue comparar el método propuesto por Markowitz (media-varianza) y el propuesto por Estrada (media-semivarianza), en la elección de un portafolio de inversión. Los datos trabajados fueron rentabilidades de cinco productos agrícolas, del periodo 1980-2009; se estimó la matriz de covarianzas y semi-covarianzas para emplearla en ambos métodos. Posteriormente, se realizó una simulación de 100 repeticiones tamaño n = 30, para obtener los rendimientos de cada producto y por ende 100 soluciones por método. Con propósitos comparativos se construyó un histograma de frecuencias; esto se complementó con prueba de t para ambos métodos, donde se concluye que el portafolio promedio es el mismo bajo ambos métodos.
Palabras clave: Semi-varianza, diversificación, rentabilidad, ganancia.
Introduction
In agricultural finance, as in any other aspect of the economy, searching for greater benefit is one of the main objectives of the different agents interacting in a market. This interest prevails whether, in their interaction, exchange of goods and asset transactions are conducted. In either case, the transactions are faced with several alternatives so the decision maker must choose between them, whom unfortunately must do under conditions of uncertainty. In other words, when making an investment decision, the economic agent assumes the risk of error and therefore to lose all or part of the expected net earnings. Therefore, the deep interest of those who invest in assessing properly to reduce the possibility of losses.
The risk is related to the variability (Levi, 1999), with the possibility of an event that results in losses for those involved in markets, such as producers, investors, borrowers and financial institutions. "The risk is the result of the uncertainty on the value of assets, due to adverse movements of the factors establishing their price; upon greater uncertainty higher risk" (Banco de Mexico, 2005). Since the risk depends on the variability of the assets, the more stable they are, the lower the risk. One way to assess this is the deviation of the yield of an asset, with respect to any measure of central tendency; an example is the standard deviation, which measures the dispersion with respect to the arithmetic mean.
One of the fundamental aspects in making decisions for a producer is the return, which depends on several factors such as price of the product, price of inputs, interest rate, among others. However, the safety of an activity refers to the relationship between risk and return. Unfortunately, these two have a direct relationship, i.e., higher yield greater risk.
One way to minimize investor's risk, at national or international level, is by integrating a portfolio, since in this manner diversification is achieved (Levi, 1999). Although the overall risk is measured by any method of dispersion, such as standard deviation, it can be decomposed into two parts: a) diversifiable (unsystematic), which can be eliminated by diversification, b) non diversifiable (systemic) or market risk. So, market risk or non-diversifiable risk is the only important risk in diversified portfolios. Markowitz (1952) was a pioneer in the search for a method for optimizing the portfolio. While investors were already practicing diversification, the contribution of Markowitz (1952 and 1959) was key to be done rigorously. The method developed by this author, is based on rational behavior of the decision maker, regarding that he prefers return and rejects risk. Therefore, a portfolio is efficient if it provides the maximum return for a given risk, or equivalently, if it has the lowest risk for a given level of return.
Under the approach of Markowitz (1952), the expected return of a portfolio is obtained by the mean or mathematical expectation; while for risk measurement, the variance and covariance matrix should be considered. When variance is used to obtain risk, there is a latent problem that both variations above the mean and variations below the mean are included in the measurement; of which only negative variations are effectively a loss to the producer. In this sense, a variation above the mean, even though it adds a measure of variation, is not necessarily an adverse event for the decision maker's budget. This problem has led to the alternative measure of risk, known as semivariance (Berck & Hihn, 1982), which considers the risk only from variations that are below the mean or negative. However, this measure has the following problems: difficulty in its calculation (as it requires knowledge of the distribution function), and at the same time lack of an estimator of the measure for more than two assets comprising a portfolio. In other words, in an applied situation, trying to find an optimal portfolio under such alternative approach, there is no matrix estimator of semi-covariances. Estrada (2008) proposes a solution to the above problem, generating an easily and accurately-symmetric exogenous matrix of semi-covariances, which according to the author, tends to produce better portfolios than those based on variance.
Both methodologies, that of Markowitz (1952) and that of Estrada (2008), have been proposed to optimize a portfolio of assets; however, the two methods can be used to compare different types of assets and goods with a level of risk. González-Estrada, Martínez-Damián, and Avilés-Cano (2006) and Díaz-Carreño, Juárez-Toledo, and Gómez-Chagoya (2007), use the model of Markowitz to optimize a portfolio of agricultural products; later de Jesús-Uribe, Martínez-Damián, and Ramírez-Valverde (2009) use again this method with the same purpose, in addition to generate an estimator that allows to use the semivariance to measure risk.
Therefore, it is important to assess the risk of investing in certain crops and taking into account that agricultural production depends on inherent uncertainty to the activity, such as: climatic conditions (particularly altered in recent years), incidence of pests, diseases and other due to the insertion into markets (González-Estrada, 2002; Quintana & Víctor, 2003; Reyes, Martínez, & Morales-García, 2012). Subject of particular concern for both the public and the private sector as long as it allows them support their decisions in a more solid way. Especially when, for diversifying risk, resource allocation arises to a set of assets, each one with particular risk profile; the dilemma is then to solve the optimal agricultural portfolio.
As a result, the methods of Markowitz and Estrada were applied to an agricultural portfolio consists of five agricultural products (tomatoe, potato, bean, maize and sorghum) in order to compare both methods of solution, as agricultural production itself is a risky investment. This happens after generating the correlations of data obtained from 13 different products (green pepper, tomato, avocado, potato, rice, beans, maize, sorghum, apple, mango, orange, pork and beef) and selecting products with negative correlation, this last happens because for the portfolio decision maker a positive covariaton implies that when a crop generates losses the same applies for the other crop; on the other hand, negative covariation is when one crop generates losses the other one can yield profit, and this is how risk is managed.
The aim of this study is divided into two parts; first, to choose an optimal portfolio using semivariance as a measure of risk and second, to compare this portfolio with that suggested by the mean-variance approach. Sustained hypothesis is that the share of each crop in the optimal portfolio differs depending on the extent of risk that is variance or semi-variance.
MATERIALS AND METHODS
The statistical data used in this study comes from the Statistical Yearbook of Mexico issued by the Instituto Nacional de Estadística y Geografía (INEGI). From this yearbook we obtained the annual return per hectare harvested in Mexico, for the period 1980-2009, of the following products: green pepper, tomato, avocado, potato, rice, beans, maize, sorghum, apple, mango, orange, pork and beef. The information obtained was deflated with the CPI (consumer price index), base 2003 to work with real data, from there net earnings were generated such as G = Dif [log(VR)], where G is the net earnings of a good and VR is the real value of the return (VR = [PP/IPC * 100]) of each of the different agricultural products, PP is the producer price and Dif is the differential operator.
To evaluate the two methods, yields of five agricultural products were used: tomatoes, potatoes, beans, maize and sorghum. With this data, the mean and the variance and covariance matrix were obtained. The result was treated as a 5 χ 1 random vector with multivariate normal distribution, with parameters set by their estimates, the mean vector, and the variance and covariance matrix mentioned.
With a normal random vectors generator in Statistical Analysis System (SAS, 2004) under the RANDNORMAL function (30, MEAN, COV) where MEAN is the mean vector and COV is the variance and covariance matrix, both estimates; 100 random samples of size 30 each were generated; this allows sufficient number of estimators and at the same time we have characteristics of large sample. The objective was to get the 100 optimal portfolios under each approach and proceed to compare the 100 solutions using the T-test. To contribute to the robustness of the results, the experiment with five different products (rice, green pepper, orange, avocado and mango, selected for showing a negative correlation) was repeated and the results were verified. This approach reflects the fact that, in spite of a multivariate normal distribution in yields the distribution of optimum shares in each portfolio will be unknown therefore simulation is used.
Basic model of a mean-variance (mv) investment portfolio
Markowitz (1952) sets the goal of setting the menu of possible combinations of return (P) and risk that can be chosen, with the weights assigned to crops (xi) the variable on which the individual will have the capacity to decide. In a set of portfolios, it can be calculated by solving the following parametric quadratic programming problem:
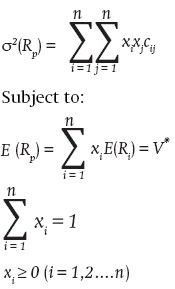
where xi is the unknown variable of the problem, i.e., the share of the portfolio for crop i; σ2(RP) is the variance of portfolio p; cij is the covariance between crop i and j yields; E(Rp) is return or expected yield of the portfolio p. So that by varying the parameter V* the set of crops shares xi is obtained in each case, minimizing the portfolio risk and its corresponding expected value.
Basic model ofa mean-semivariance (msv) investment portfolio
Estrada (2008) proposed a heuristic approach that produces a symmetric and exogenous semicovariance matrix, both easily and accurately, which ensures, tends to produce better portfolios that based on variance. The advantages of the proposed approach are two: First, the estimation of the semivariance of the portfolio is as easy as estimating the variance and secondly, it can be done with a known expression without having to resort to a numerical algorithm. In this sense the semi-covariance between the cops i and j with respect to the yield of fixed reference Β(ΣijB) is defined as:
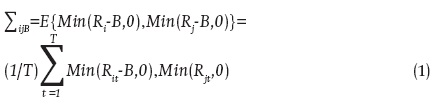
Definition, which can be adapted to any B desired (In an application we seek for positive B and presumably lower than R on average) and generate symmetric semicovariance matrix (ΣijB = ΣjiB) and exogenous simultaneously. The expected return (Ep) and the variance  of a portfolio are given by:
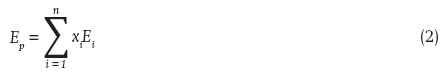
where xi which indicates the proportion of the portfolio invested in the crop i ; Ei. the return expected of the active i and n the number of crops in the portfolio, σij = is the element ij of the matrix of semicovariances.
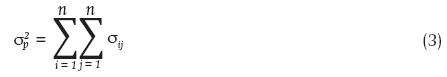
The semi-variance of a portfolio with respect to the yield of reference B can be approximated by the expression:
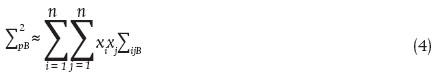
where ΣijB is defined as in (1). This expression obtains an exogenous and symmetric semicovariance matrix, which can be used in the same way that the covariance matrix in solving portfolio problems.
RESULTS
From the data obtained, correlations of thirteen different products were generated and one portfolio was selected which included negative correlations; it was composed of tomatoes, potatoes, beans, maize and sorghum (Table 1) data. Table 2 shows earning rates of tomatoes, potatoes, beans, maize and sorghum for the period 1979-2009. Of which the covariance matrix was obtained, from there 100 samples of size n = 30 were generated by simulating the behavior of these products under the multivariate normal distribution of size five.
With this sample the optimum shares were estimated by setting the constraints of the Markowitz model (MV) and the alternative proposal of Estrada (MSV); in this way we obtained the results optimizing the investment portfolio under both methodologies, having 100 different solutions and showing the results via a frequency histogram, to see if the solutions differ. Figures 1 and 2 show the 100 optimal shares for maize under each solution. Only the shares of maize are shown to not be repetitive, the other histograms are similar.
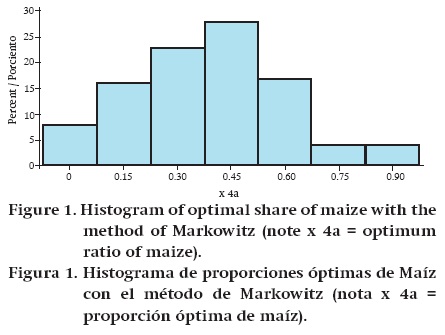
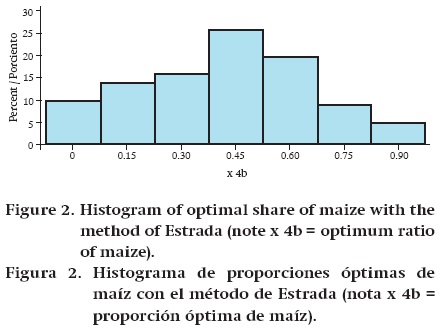
It is noted that, under the results presented, both methods solutions match; the optimum share under each approach is 0.45. For further support of the results, t test was performed for the optimum share of each crop under the null of equal shares for each method and alternative that the shares differ according to the method used. The results are shown in Table 3.
DISCUSSION
From these results it is observed that there is no statistical difference in solving a method and another, therefore it is indifferent to use either of them, and moreover, the assertion of Estrada, that this method generates a more efficient portfolio is not proven in this study. Given the lack of similar results with other authors and to make a further contribution to this discussion, the experiment was repeated with five different products (rice, green pepper, orange, avocado and mango). Rice was the most profitable option, solution that both methodologies generated. In the same matter, the test results of the t test were similar, which are shown in Table 4.
These results, although they are statistically equal, may reflect the choice of a symmetric distribution, as is the normal distribution. This choice was largely due to the central limit theorem and the lack of multivariate distributions that exhibit asymmetry, in this last case we would expect the results to change. However, the evaluation of methods, here studied, is an empirical question treated in an original way.
CONCLUSIONS
The method of Markowitz (1952), of using the variance in calculating the risk measure is adequate and well known to solve the problem of choosing an investment portfolio. Estrada (2008) proposes a way to evaluate a portfolio with semivariance as a measure of risk. By having two alternative ways to solve the same problem, the dilemma of assessing what is best arises; however, it was found that no results statistically different from the solution proposed by Markowitz were obtained, when dealing with a multivariate normal distribution. The choice of latent data distribution influenced this result, but the two methodologies should be examined together.
REFERENCES
Berck, P. & Hihn, J. M. (1982). Using the semivariance to estimate safety-first rules. American Journal of Agricultural Economics, 64(2), 298-300. doi: 10.2307/1241139. [ Links ]
Banco de México. (2005). Definiciones Básicas de Riesgos. Recuperado de: http://www.banxico.org.mx/sistema-financiero/material-educativo/intermedio/riesgos/%7BA5059B92-176D-0BB6-2958-7257E2799FAD%7D.pdf. [ Links ]
de Jesús-Uribe, L. M., Martínez-Damián, M. Á., & Ramírez-Valverde, G. (2009). Método de semivarianza y varianza para la selección de un portafolio óptimo. Revista Mexicana de Economía Agrícola y de los Recursos Naturales 2(1), 103-113. Recuperado de: http://www.chapingo.mx/revistas/revistas/articulos/doc/remecaren2840.pdf. [ Links ]
Díaz-Carreño, M. Á., Juárez-Toledo, R., & Gómez-Chagoya, M. C. (2007). Conformación de una cartera de inversión óptima de cultivos agrícolas para México. Revista Economía, Sociedad y Territorio, 7(25), 49-63. Consultado en: http://est.cmq.edu.mx/index.php/est/article/view/231/237. [ Links ]
Estrada, J. (2008). Mean-semivariance optimization: A heuristic approach. Journal of Applied Finance, 18(1), 157-172. doi: http://dx.doi.org/10.2139/ssrn.1028206. [ Links ]
González-Estrada, A. (2002). Dinámica de los cultivos básicos en la liberalización comercial de México: modelo dinámico multisectorial de equilibrio general. INIFAP-CONACYT. Chapingo, México. Libro técnico (5), 120. [ Links ]
González-Estrada, A., Martínez-Damián, M. A., & Avilés-Cano, M. (2006). Análisis de riesgo, portafolios óptimos y diversificación en la agricultura. Agrociencia, 40(3), 409-417. Recuperado de: http://www.colpos.mx/agrocien/Bimestral/2006/may-jun/art-13.pdf. [ Links ]
Instituto Nacional de Estadística y Geografía (INEGI) (2010). Año de consulta 2011. [ Links ]
Levi, M. D. (1999). Finanzas Internacionales, editorial McGraw-Hill (pp. 720): Tercera. [ Links ]
Markowitz, H. (1952). Portfolio selection. Journal of Finance, 7(1), 77-91. [ Links ]
Markowitz, H. M. (1959). Portfolio selection: efficient diversification of investments (Vol. 16): Yale university press. [ Links ]
Quintana, S. & Víctor, M. (2003). El círculo vicioso del Tratado de Libre Comercio de América del Norte: la amarga experiencia mexicana en el agro a partir del TLCAN. Deslinde, 33, 26-38. Recuperado de: http://www.rebelion.org/hemeroteca/sociales/030607quintana.htm. [ Links ]
Reyes, G., Martínez, B., & Morales-García, C. (2012). Precios internacionales de los alimentos, demanda futura y crisis alimentaria. En: Políticas agropecuarias Forestales y pesqueras (Vol. 9) [ Links ]
Statistical Analysis System (SAS Institute Inc.). (2004). What is new in SAS' 9.0, 9.1, 9.1.2 and 9.1.3. Cary, NC: SAS Institute Inc. USA. p 340. [ Links ]

