


Servicios Personalizados
Revista
Articulo
 Inglés (pdf)
 Artículo en XML
 Referencias del artículo
 Enviar artículo por email
Indicadores
-
 Citado por SciELO
 -
 Accesos
Links relacionados
-
 Similares en
SciELO
Similares en
SciELO
Compartir

 Permalink
Revista Chapingo. Serie horticultura
versión On-line ISSN 2007-4034versión impresa ISSN 1027-152X
Rev. Chapingo Ser.Hortic vol.15 no.2 Chapingo may./ago. 2009
Nitrogen impact on nutritional status of phosphorus and its main bioindicator: response in the roots and leaves of green bean plants
Impacto del nitrógeno sobre el estado nutricional del fósforo y su principal bioindicador: respuesta en raíces y hojas de plantas de frijol ejotero
E. Sánchez Chávez1*, E. Muñoz1, Á. Anchondo2, J. M. Ruiz3 y L. Romero3
1 Centro de Investigación en Alimentación y Desarrollo, A. C. Av. 4ta. Sur 3820, Fracc. Vencedores del Desierto. Cd. Delicias, Chihuahua. C. P. 33089, México. Tel. +52 (639) 4748400. Fax: + 52 (639) 4748704. Correo–e: esteban@ciad.mx (*Autor responsable)
2 Facultad de Ciencias Agrícolas y Forestales, Universidad Autónoma de Chihuahua. Km. 2.5 Carretera Delicias–Rosales. Cd. Delicias, Chihuahua, México.
3 Departamento de Fisiología Vegetal, Facultad de Ciencias, Universidad de Granada, 18071–Granada, España.
Recibido: 11 de marzo, 2009
Aceptado:21 de julio, 2009
Resumen
El objetivo del presente trabajo fue determinar el efecto de la aplicación de diferentes dosis de nitrógeno (N) sobre el estado nutricional del fósforo (P) en raíces y hojas de plantas de frijol ejotero (Phaseolus vulgaris L. cv. Strike), y además, estudiar la respuesta de la actividad fosfatasa ácida como el principal bioindicador de P. El N fue aplicado a la solución nutritiva como NH4NO3 y en dosis crecientes de: N1 = 1.5 mM, N2 = 3.0 mM, N3 = 6.0 mM, N4 = 12.0 mM, N5 = 18.0 mM y N6 = 24.0 mM de N. Los resultados indican que las dosis deficientes y tóxicas de N se caracterizaron por presentar los niveles más bajos de fósforo total, inorgánico y orgánico, así como la mayor actividad fosfatasa ácida, esto debido a la influencia directa que se da entre los niveles de N y los de P. El tratamiento N4 presentó los mayores niveles de las distintas fracciones de P y la menor actividad fosfatasa ácida. Además, se encontró que la mayor proporción de P en raíces y hojas están en las formas de P inorgánico (Pi) y P orgánico las cuales integran más del 65% del P total, por lo que puede decirse que representan las principales formas de P en las plantas de frijol ejotero. Finalmente, se indica que la actividad fosfatasa ácida presentó una relación significativa con el Pi, lo cual demuestra que se puede usar como un buen indicador del estado nutricional del P en las raíces y hojas de frijol ejotero.
Palabras claves: Phaseolus vulgaris L., fosfatasa ácida, nutrientes.
Abstract
The objective of the present work was to determine the effect of different doses of nitrogen (N) on the nutritional status of phosphorus (P) in roots and leaves of green bean plants (Phaseolus vulgaris L. cv. Strike), and also to examine the response of acid–phosphatase activity as the main bioindicator of P. Nitrogen was applied to the nutrient solution as NH4NO3 and increasing doses of: N1 = 1.5 mM, N2 = 3.0 mM, N3 = 6.0 mM, N4 = 12.0 mM, N5 = 18.0 mM, and N6 = 24.0 mM of N were added. The results indicate that both deficient and toxic N doses were characterized by the lowest level of total, inorganic and organic phosphorus, as well as the highest activity of acid phosphatase; these effects are due to the direct influence between N and P levels. Treatment N4 presents the highest levels of the diverse fractions of P and the lowest activity of acid phosphatase. Additionally, it was found that the highest proportion of P in roots and leaves are in the forms of P–inorganic (Pi) and P–organic. These represented more than 65% of total P, so it can be said that they represent the main forms of phosphorus in green bean plants. Finally, it should be noted that acid phosphatase activity was significantly correlated with Pi, which indicates that it can be used as a good indicator of the nutritional status of P in the roots and leaves of green bean plants.
Key words: Phaseolus vulgaris L., acid–phosphatase, nutrients.
INTRODUCTION
Beans are grown and consumed in nearly all the world. In many developing countries, 20% of the available protein is provided by beans. Beans also represent an integral part of dietary protein for 50% of the world's population (Deshpande et al., 1984). Beans are produced in large quantities in the American Continent and East Africa (Singh, 1999).
Phosphorus (P), an essential element for higher plants, is required in substantial concentrations in plant tissues and is particularly critical during vegetative growth (Jeschke et al., 1996). The principal effects of P deficiency are: a reduction of foliar expansion (Fredeen et al., 1989), a decrease in the number of leaves (Lynch et al., 1991), and a loss of photosynthetic efficiency (Lauer et al., 1989). In terms of dry–matter yield, the roots are much less affected by P deficiency than are the leaves (Heuwinkel et al., 1992). Studies on the nutritional status of P indicate that its concentration in the leaves has a powerful impact on the regulation of phosphate flux (Adalsteinsson et al., 1994; Jeschke et al., 1996).
The acquisition of nutrients of slow–mobility nutrient such as P is strongly influenced by root's morphological and physiological properties (Adalsteinsson et al., 1994). Several physiological responses have been demonstrated within the roots, such as the release of organic acids, especially citrate (Hoffland et al., 1989a), the release of phosphatase and therefore the increase of its activity in the rhizosphere (Barret–Lennard et al., 1993), and the acidification of the rhizosphere by the net release of H+, which ocurrs principally when plants are supplemented with NO3– (Hoffland et al., 1989b; le Bot et al., 1990). All of the physiological responses enhanced the P uptake from the soil.
Deficiency or poor availability of P in plants may be caused by a low effectiveness of P fertilizers and/or by interactions of this element with others in the culture medium. In this sense, it is known that N–assimilation is disturbed when plants, growing with an adequate concentration of NO3–, are limited by inadequate P levels (Rufty et al., 1993). Three different adverse effects have been identified in this regard: (i) a diminishing of NO3– root absorption (Rufty et al., 1991); (ii) a reduction of NO3– translocation from roots to shoots, with a collateral increment of the NO3– concentration in roots (Rufty et al., 1990); and (iii) an increase the accumulation of aminoacid ions in leaves (Israel and Rufty, 1988). Sporadically, the accumulation of aminoacids has been shown in roots as well (Rabe and Lovatt, 1984; Rufty et al., 1990).
The excessive use of fertilizers in present–day agriculture (specially of nitrogen) makes it indispensable to study the interactions of the nutrients involved, both in terms of uptake and metabolism. Phosphorus, one of the most basic macronutrients, is specially useful in agriculture, principally because P is a key component of many molecules that participate in plant basic processes, such as nucleic acids, phospholipids or ATP.
Therefore, the objective of this work is (i) to determine the effect of different dosages of N on the nutritional status of P both on the roots and leaves of green bean plants, and (ii) to examine the response of acid–phosphatase activity as the principal bioindicator of P.
MATERIALS AND METHODS
Crop design and plant sampling
Seeds of Phaseolus vulgaris cv. Strike were sown and grown in a growth chamber under controlled environmental conditions, with a relative humidity of 60–80%, a temperature of 30/20 °C (day/night), and a photoperiod of 16/8 h under a photosynthetic photon flux density of 350 ì mol·m–2·s–1 (measured at the top of the plants with a 190 SB quantum sensor, LI–COR Inc., Lincoln, NE). Four plants were grown in 8–liter pots (25 cm upper diameter, 17 cm lower diameter, 25 cm height), filled with vermiculite. For 30 days prior to experimental treatments (including 8 days for germination), the plants received a nutrient solution consisting of 6 mM NH4NO3, 1.6 mM H3PO4, 4.0 mM K2SO4, 4 mM CaCl2·2H2O, 1.4 mM MgSO4·H2O, 5 ì M Fe–EDDHA, 2 ì M MnSO4·H2O, 1 ì M ZnSO4·7H2O, 0.25 ì M CuSO4·5H2O, 0.3 ì M Na2MoO4·2H2O, and 25 ì M H3BO3. The nutrient solution (pH 6.0 ± 0.1) was renewed every 3 days.
Thirty days after sowing, the different N treatments in the form of NH4NO3 were applied for 30 days (until harvest) (N1 = 1.5 mM, N2 = 3.0 mM, N3 = 6.0 mM, N4 = 12.0 mM, N5 = 18.0 mM, and N6 = 24.0 mM). The N3 treatment constituted the optimal N–dosage for Phaseolus vulgaris under this experiment's the cultivation conditions the experiment (Carbonell–Barrachina et al., 1997). The experimental design was a complete randomized block with six replicates (individual pots), with 24 plants per treatment.
The plants were sampled at 60 days after sowing, at full pod development. All the root and leaf samples were taken in the mature state. The material was rinsed three times in distilled water after disinfection with a non–ionic detergent at 1% (Wolf, 1982), then blotted on filter paper. At each sampling, fresh root and leaf matter were used for the analysis of acid phosphatase activity (APA). A leaf and root subsample was dried in a forced–air oven at 70 °C for 24 h, ground in a Wiley mill and then placed in plastic bags until analysis for total P, inorganic P, and organic P. Dry weight (DW) was recorded and expressed as mg DW per root or per leaf. All determinations were performed in triplicate.
Plant analysis
Extraction and assay of acid phosphatase activity (APA, EC 3.1.3.2). Acid phosphatase activity (APA) assay was determined according to Besford (1979), Ruiz et al. (1996), and López–Cantarero et al. (1998). Fresh matter was homogenized with a 0.1 M sodium acetate buffer, and then centrifuged at 30,000 g. All procedures were carried out at 4 °C. Protein was estimated by the Bradford method (1976), using bovine serum albumine (BSA) as the standard. Enzyme extracts were incubated for 30 min. at 30 °C. Hydrolysis of the p–nitrophenyl phosphate (p–NPP) was determined as APA by spectrophotometry at 405 nm. The results were expressed as μmol of p–NPP hydrolyzed h–1 at 30 °C.
Determination of the phosphorus forms. Dry matter was digested with 96% H2SO4 in the presence of hydrogen peroxide (H2O2) (Wolf, 1982). Total P was analyzed by the vanadomolybdophosphoric colorimetric method at 430 nm (Hogue et al., 1970; Valenzuela and Romero, 1996; López–Cantarero et al., 1998). Inorganic P was analyzed after aqueous extraction of 0.2 g of dried and ground material in 10 ml of bi–distilled water. After filtration, the eluate was used for the direct determination of the inorganic P, as described for total form (Ruiz et al., 1996; López–Cantarero et al., 1998). Organic P levels were calculated from the difference between total and inorganic P. The P concentrations were expressed as mg·g–1 dry weight (dw).
Statistical analysis
Data were analyzed using ANOVA (SAS, 1987). When F tests were significant, differences between treatment means were compared using LSD at the 0.05 probability level. Also, correlation analyses were made between the different variables. Levels of significance were represented by * at P < 0.05, ** at P < 0.01, *** at P < 0.001, and NS: not significant. Data shown are mean values ± SE.
RESULTS AND DISCUSSION
Nitrogen is currently the nutrient most widely used as fertilizer and demanded for growing agricultural crops (Weinhold et al., 1995). In our experiment, treatment N3 presented the maximum production of foliar biomass, which was increased 43% over treatment N6, the one that exhibited the lowest biomass value (Figure 1). Regarding the production of root biomass, treatment N1 presented the greatest production, 51% higher than N6, which again registered the least production of root biomass.
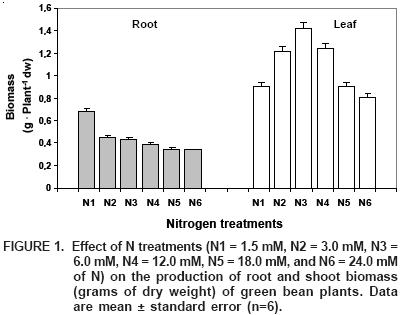
It should be mentioned that the application of 6 mM N (N3) was the best treatment to increase the production of root and shoot biomass in green bean plants. Low–N treatments (N1 and N2), can be considered as N–deficient and were characterized by a relative increase in root biomass and a reduction in the growth of aerial biomass, hence an increase in the root to shoot ratio. Meanwhile, doses above optimum (N4, N5 and N6), considered in this experiment as elevated to toxic, because of the decrease they caused in root and shoot growth, the latter being most affected.
Phosphorus (P), after N, is the second most limiting nutrient element for plant growth (Raghothama, 1999). In our study, the application of different N–doses significantly favored the levels of both total P and its different fractions in roots and leaves (Figure 2); P increases were greater than 22% in roots and 18% in leaves, with regard to the smaller levels found in treatments N1 and N6. Previously, López–Cantarero et al. (1998) found a positive effect of nitrogen fertilization on the nutritional status of total phosphorus in eggplants. What possibly happened is that the uptake of low–mobility nutrients, like phosphorus, is enhanced by rizosphere acidification through net release of H+, which occurs when plants are supplemented with NO3– (Hoffland et al., 1989b; le Bot et al., 1990). In our experiment, N was applied as NH4NO3; in this way, an increase in the N dose apparently stimulated P uptake due to rizosphere acidification.
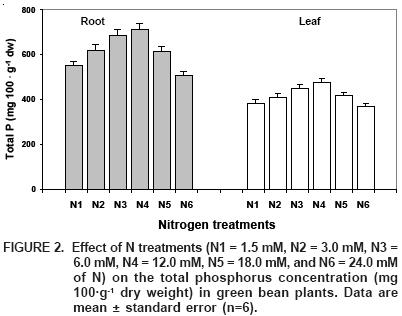
The stimulative effect of N on P uptake can be attributed to: (1) greater root expansion as a response to N application, since the uptake of low–mobility nutrients such as P is profoundly influenced by root morphology and physiology; (2) P availability in soil which is modified by acidity and other chemical changes in the rizosphere; and (3), physiological changes stimulated by N, that influence P transport within the plant (Adalsteinsson et al., 1994).
Regarding the P fractions analysed in our study, inorganic P (Pi) followed the trend of total P after N applications (Figura 3); maximum Pi concentrations occurred under treatment N4, which were 31 and 22% higher, respectively, when compared to the smallest concentrations found in N1. Additionally, it can be noticed that Pi is the most important fraction of total P in both the root and leaves of green bean plants, representing 48 and 42%, respectively. Theodorou and Plaxton (1993) mention that (Pi) is involved in the control of many enzymatic reactions and in the regulation of distinct metabolic processes.
As with total P, Pi concentration increased as N was increased (Figure 3). There are two contradictory opinions concerning Pi's behavior as a response to greater or lesser P uptake. Some researchers suggest that the difference in the plant's P nutritional status modifies the level of Pi in the leaf (Crafts–Brander, 1992). But others state that Pi is totally independent of P (Foyer and Spencer, 1986). In our experiment, the correlation between total P and Pi was positive and significant, both in roots (r = 0.78**) and leaves (r = 0.86**), which implies a dependence of Pi on the nutrient status of total P (P).
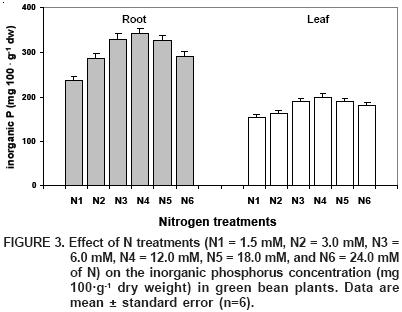
The fact that Pi is the most important fraction of total P in green bean plants (Figure 3) is probably due to its being a major component of the soluble fraction that acts as reserve P, which is used by the plant during times of higher rate synthesis of new chemical compounds (Bieleski and Ferguson, 1983).
In relation to the organic fraction of P in this study, maximum levels of this organic form occurred in treatment N4 (Figure 4), with increases of 51 and 42% in roots and leaves respectively, when compared to the low levels obtained in treatment N6. On the other hand, this organic fraction represents 22 and 24% of P total, respectively, which indicates that this is the second most important fraction of P in green bean plants.
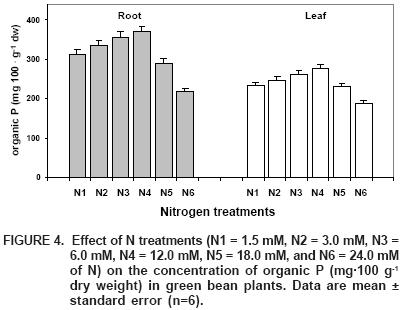
Alternately, we observe that under N–deficiency there is larger Pi accumulation, followed by soluble organic P (while under N–toxicity conditions the trend of these fractions is alike), the exception is that Pi increases at the expense of a reduction in the fraction of soluble organic P. This leads to believe that under stress conditions, whether a deficiency or toxicity of N, it is necessary for Pi to form and accumulate, in orden for the plant to tolerate this stress, and to be able to continue functioning in the best possible way (Marschner, 1995).
According to the results found for the different P fractions, we can infere that green bean plants under treatment N4 were the most efficient in P utilization, while treatments N1 and N6 gave way to the smallest concentrations of P (Figures 1, 2 and 3). This is probably due to the negative effect of deficient or toxic doses of N on P–absorption and transport. In the case of N toxicity, this negative effect was possibly favored by the concurrent presence of NO3–, which suppresses the accumulation of P in the vacuoles (Rabe and Lovat, 1984).
Another noteworthy finding is that the different forms of P: total, inorganic and organic, were at higher levels in roots than in leaves (Figures 1, 2 and 3). This could possibly be explained by the transport of these phosphorus compounds from leaves to fruits, the latter acting as physiological sinks.
The main enzyme used as a P–bioindicador is acid phosphatase. This enzyme catalyses the hydrolysis of phosphate esters, and its activity could be related to some stimulus during P removilization (Smith and Chevalier, 1984). In this experiment, we notice that the N–dose significantly influenced the activity of acid phosphatase in roots (P>0.01; Figure 5) and leaves (P>0.01; Figure 5). Treatment N4 showed minimum acid phosphatase activity with decreases of 34 and 51% in roots and leaves, respectively, when compared to the maximum activities registered for treatments N1 and N6.
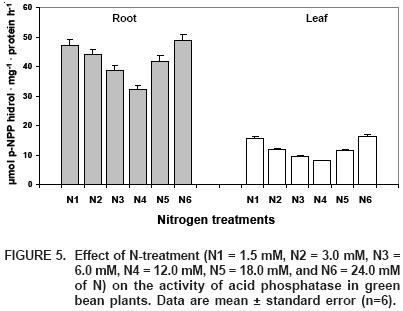
The increase in Pi levels in roots and leaves, as an effect of N application (Figure 3), is mirrored by acid phosphatase activity (Figure 5), since this enzyme's activity shows a relationship with the nutritional status of P. More specifically associated with Pi, there is an increase in the activity of acid phosphatase under deficiency and toxicity of P (Barret–Lenard et al., 1993; Ruiz et al., 1996; López–Cantarero et al., 1998; Baghour et al., 2001). In our experiment, the maximum enzymatic activity corresponded to the lowest levels of Pi, both parameters being significantly correlated in roots (r = –0.80**) and leaves (r = –0.78**). Due to the existing relationship between acid phosphatase activity and Pi, this enzyme could be a good bioindicador of the nutritional status of P.
CONCLUSIONS
The results indicate that both deficient and toxic doses of N were characterized by the lowest levels of total phosphorus, inorganic and organic, and by a greater activity of acid phosphatase, due to the direct influence between P and N levels. On the contrary, treatment N4 presented the highest levels of distinct fractions of P, and the lowest acid phosphatase activity. In addition, the greatest proportion of P in roots and leaves was found as Pi and organic–P, these represented over 65% of total P. It can be said that they represent the main form of phosphorus in green bean plants. Finally, it is worth mentioning that acid phosphatase activity was significantly correlated with Pi, which suggests that this enzyme could be used as a good indicator of the nutritional status of P in the roots and leaves of green bean plants.
LITERATURE CITED
ADALSTEINSSON, S.; SCHJORRING, J.K.; JENSÉN, P. 1994. Regulation of phosphate influx in winter wheat: root–shoot phosphorus interactions. J. Plant Physiol. 143: 681–686. [ Links ]
BAGHOUR, M.; SÁNCHEZ, E.; RUIZ, J.M.; ROMERO; L. 2001. Metabolism and efficiency of phosphorus utilization during senescence in pepper plants: response to nitrogen and potassium fertilization. J. Plant Nutr. 24: 1731–1743. [ Links ]
BARRET–LENNARD, E. G.; DRACUP, M.; GREENWAY, H. 1993. Role of extracellular phosphatases in the phosphorus–nutrition of clover. J. Exp. Bot. 44: 1595–1600. [ Links ]
BESFORD, R. T. 1979. Phosphorus nutrition and acid phosphatase activity in leaves of seven plant species. J. Sci. Food Agric. 30: 282–285. [ Links ]
BIELESKI, R. L.; FERGUSON, I. B. 1983. Physiology and metabolismo f phosphate and its compounds. In: Encyclopedia of plant physiology. Vol. 15a. Lauchli A, Bieleski RL. (eds.), Springer–Verlag, Berlin. [ Links ]
BRADFORD, M. M. 1976. A rapid and sensitive method for the quantification of microgram quantities of protein utilizing the principle of protein–dyebinding. Anal. Biochem. 72: 248–254. [ Links ]
CARBONELL–BARRACHINA, A. C.; BURLÓ–CARBONELL, F.; MATAIX–BENEYTO, J. 1997. Effect of sodium arsenite and sodium chloride on bean plant nutrition (macronutrients). J. Plant Nutr. 20: 1617–1633. [ Links ]
CRAFTS–BRANDNER, S. J. 1992. Phosphorus nutrition influence on leaf senescence in soybean. Plant Physiol. 98: 1128–1132. [ Links ]
DESHPANDE, S.; STYHE, S. K.; SALUNKHE, D. K. 1984. Interrelationships between certain physical and chemical properties of dry bean. Qual. Plant Foods Human Nutrit. 34: 53–65. [ Links ]
FOYER, C.; SPENCER, C. 1986. The relationship between phosphate status and photosynthesis in elaves. Effects on intracellular orthophosphate distribution, photosynthesis, and assimilate partitioning. Planta 167: 369–375. [ Links ]
FREDEEN, A. L.; RAO, I. M.; TERRY, N. 1989. Influence of phosphorus nutrition on growth and carbon partitioning in Glycine max. Plant Physiol. 89: 225–230. [ Links ]
HEUWINKEL, H.; KIRKBY, E. A. LE BOT, J.; MARSCHNER, H. 1992. Phosphorus deficiency enhances molybdenum uptake by tomato plants. J. Plant Nutr. 15: 549–568. [ Links ]
HOFFLAND, E.; FINDENEGG, G. R.; NELEMANS, J. A. 1989a. Solubilization of rock phosphate by rape. II. Local root exudation of organic acids as a response to P–starvation. Plant Soil. 113: 161–165. [ Links ]
HOFFLAND, E.; FINDENEGG, G. R.; NELEMANS, J. A. 1989b. Solubilization of rock phosphate by rape. I. Evaluation of the role of the nutrient uptake pattern. Plant Soil. 113: 155–160. [ Links ]
HOGUE, E.; WILCOW, G. E.; CANTLIFE, D. J. 1970. Effect of soil P on phosphate fraction in tomato leaves. J. Am. Soc. Hortic. Sci. 95: 174–176. [ Links ]
ISRAEL, D. W.; RUFTY, J. R. 1988. Influence of phosphorus nutrition on phosphorus and nitrogen utilization efficiencies and associated physiological responses in soybean. Crop Sci. 28: 954–960. [ Links ]
JESCHKE, W. D.; PEUKE, A.; KIRKBY, E. A.; PATE, J. S.; HARTUNG, W. 1996. Effects of P deficiency on the uptake, flows and utilization of C, N and H2O within intact plants of Ricinus communis L. J. Exp. Bot. 47: 1737–1754. [ Links ]
LAUER, M. J.; BLEVINS, D. G.; SIERZPUTOWSKA–GRACZ, H. 1989. 31P–nuclear magnetic resonance determination of phosphate compartmentation in leaves of reproductives soybeans (Glycine max L.) as affected by phosphate nutrition. Plant Physiol. 89: 1331–1336. [ Links ]
LE BOT, J.; ALLOUSH, G. A.; KIRKBY, E. A.; SANDERS, F. E. 1990. Mineral nutrition of chikpea plants supplied with NO3– or NH4+–N. II. Ionic balance in relation to phosphorus stress. J. Plant Nutr. 13: 1591–1605. [ Links ]
LÓPEZ–CANTARERO, I.; RUIZ, J. M.; HERNÁNDEZ, J.; ROMERO, L. 1998. Phosphorus metabolism and yield response to increases in nitrogen–phosphorus fertilization: Improvement in greenhouse cultivation of eggplant (Solanum melongena cv. Bonica). J. Agric. Food Chem. 46: 1603–1608. [ Links ]
LYNCH, J.; LÄUCHLI, A.; EPSTEIN, E. 1991. Vegetative growth of the common bean in response to phosphorus nutrition. Crop Sci. 31: 380–387. [ Links ]
MARSCHNER, H. 1995. Mineral nutrition of higher plants. Second Edition. Academic Press Inc., San Diego CA. pp. 245–281. [ Links ]
RABE, E.; LOVATT, C. J. 1984. De novo arginine biosynthesis in leaves of phosphorus–deficient Citrus and Poncirus species. Plant Physiol. 76: 747–752. [ Links ]
RAGHOTHAMA, K. G. 1999. Phosphate acquisition. Annu. Rev. Plant Physiol. Plant Mol. Biol. 50: 665–693. [ Links ]
RUFTY, T. W. JR.; MACKOWN, C. T.; ISRAEL, D. W. 1990. Phosphorus stress effects on assimilation at nitrate. Plant Physiol. 94: 328–333. [ Links ]
RUFTY, T. W. JR.; SIDDIQI, M. Y.; GLASS, A. D.; RUTH, T. J. 1991. Altered 15NO3– influx in phosphorus limited plants. Plant Sci. 76: 43–48. [ Links ]
RUFTY, T. W. JR.; ISRAEL, D. W.; VOLK, J. R.; QUI, J.; TONGMIN, S. A. 1993. Phosphate regulation of nitrate assimilation sin soybean. J. Exp. Bot. 44: 879–891. [ Links ]
RUIZ, J. M.; BELAKBIR, A.; ROMERO, L. 1996. Foliar level of phosphorus and its bioindicators in Cucumis melo grafted plants. A possible effect of rootstock. J. Plant Physiol. 149: 400–404. [ Links ]
SAS. 1987. SAS/STAT Guide for Personal Computers. Version 6, Statistical Analysis System Institute, Inc.: Cary, NC. pp. 1028–1056. [ Links ]
SINGH, S. P. 1999. Production and utilization. In: Sing, S.P. (ed), Common Bean Improvement in the Twenty–First Century. Developments in Plant Breeding. Vol. 7. Kluwer Acad., Dordrecht. The Netherlands. pp. 1–24. [ Links ]
SMITH, D. A.; CHEVALIER, P. 1984. Increases in phosphatise and b–glucosidase activities in wheat seedling in response to P–deficient growth. J. Plant Nutr. 7: 1221–1231. [ Links ]
THEODOROU, M. E.; PLAXTON, W. C. 1993. Metabolic adaptations of plant respiration to nutritional phosphate deprivation. Plant Physiol. 101: 339–344. [ Links ]
VALENZUELA, J. L.; ROMERO, L. 1996. Yield and optimum nutrient range in capsicum plants (Capsicum annuum L. cv. Lamuyo). Phyton–Int. J. Exp. Bot. 58: 69–75. [ Links ]
WEINHOLD, B. J.; TODD, P. T.; REICHMAN, G. A. 1995. Yield and nitrogen efficiency of irrigated corn in northern great plants. Agron. J. 87: 842–846. [ Links ]
WOLF, B. 1982. A comprehensive systems of leaf analysis and its use for diagnosing crop nutrients status. Commun. Soil Sci. Plant Anal. 13: 1035–1059. [ Links ]

