


 text new page (beta)
 English (pdf)
 Article in xml format
 Article references
 Send this article by e-mail
 Cited by SciELO
  Similars in
SciELO
Similars in
SciELO 
 Permalink
Introduction
Most of the world’s population is concentrated in large cities. Demographic increases have forced land-use changes from natural soils to cultivated and then to urban areas. These changes can induce a decrease in infiltration rates, promoting flooding (Pathiran et al., 2014), and can impact the regional climate by modifying the surface energy and water balances (Foley et al., 2005).
Mexico is highly exposed to hydrometeorological disasters. In 2013, hurricanes Manuel and Ingrid hit both sides of the country, affecting 77% of the territory, producing landslides and floodings in many states (Pedroza-Acuña, et al., 2015). Pedroza-Acuña et al. (2015) observed that land-use changes in urban areas significantly increase precipitation depth, and concluded that land-use planning is fundamental to reducing flooding risks in Mexico.
Colima is one of the Mexican states most susceptible to natural disasters (Padilla and de la Parra, 2015). It is located in the central-western coast of the country on a complex orographic and hydrographic system. Most of the region consists of volcanic rocks from the Colima Volcanic Complex (CVC). The Volcán de Colima is the youngest edifice of the CVC and is the most active volcano in Mexico (Capra et al., 2014). The city of Colima is settled on top of a volcaniclastic apron made of debris avalanche deposits originated from the collapse of the volcano approximately 7500 years ago (Luhr and Prestegaard, 1988; Cortés et al., 2005). The debris avalanche deposits correspond to a mixture of meter-sized andesitic clasts in a poorly sorted coarse-grained matrix, from gravel to clay (Roverato and Capra, 2013). Due to this heterogeneous texture, the soil is poorly developed and cultivated soils are made of improved crop land.
The metropolitan area of Colima-Villa de Álvarez (Figure 1) has been qualified with no risk of inundation in the case of moderate precipitation events (less than 20 mm) in the flood risk map of National Center for Disaster Prevention (CENAPRED, 2015). However, slightly higher precipitation causes inundation; such a rainfall occurred on 27 July, 2015, with 25 mm precipitation depth in less than one hour, producing urban floodings and hail, fallen trees, and warning of lahars affecting the northern part of the city (Periódico Ecos de la Costa, 2015). More common examples of rains causing floodings are extraordinary rainfalls such as hurricanes: Jova on October 11th, 2011 (174 mm/10 h), Manuel on November 6th, 2013 (117 mm/4 h), and Patricia on October 23th, 2015 (237 mm/17 h) (based on CONAGUA-EMA data, http://smn1.conagua.gob.mx/emas). These very intense storms (Figure 2) caused extensive damage including human casualties.

Figure 1 Landsat image showing the extent of the metropolitan area of Colima and Villa de Álvarez, included in the same hydrological basin (black line), which is the object of this study and the target area (white line) used as a buffer for land-use classification, sampling, and infiltration tests.
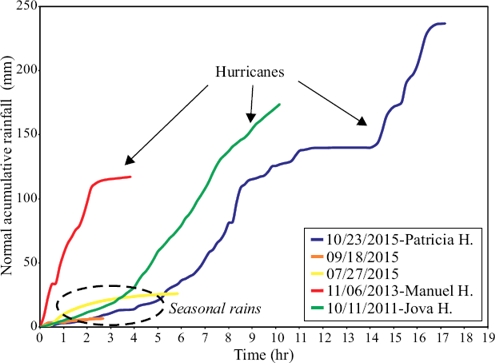
Figure 2 Cumulated curves of some rainfall events recorded at the Meteorological Station of Colima City (Comisión Nacional del Agua), including events related to hurricanes.
As observed in other main cities in Mexico (e.g., Eakin, 2010; Perevochtchikova, 2010), Colima experimented an important urban expansion during the last decade around its periphery, especially towards the north (SEMARNAT, 2000; Gobierno Municipal de Colima, 2012). Given this scenario, the purpose of this paper is to better understand how land-use change increases flooding in the urban area of Colima. Particularly, we will focus on land-use change during the last 10 years based on a spatio-temporal analysis of SPOT images, and the analysis of soils from different land uses to determine their physical and chemical characteristics, and their hydrological behavior based on in situ infiltration tests.
Methodology
Study area
The metropolitan area of Colima-Villa de Álvarez is located at approximately 500 m a.s.l. A basin analysis shows that the urban area is included in a 52 km2 hydrological basin that drains from the lowest slope of the Volcán de Colima. This basin was delineated using the basin tool in ArcMap 10.1, with a Digital Elevation Model (DEM) of 30 m resolution (INEGI, 2015). Inside this basin, a target area was selected in the northern part of the metropolitan area (Figure 1), where the greatest urban growth occurred during the past years. This area has native, cultivated, and urban surfaces and may provide significant information for land-use evolution (Yang and Zang, 2015). For the target area, a land-use classification, based on direct observations, was performed. In particular, the land use was subjectively classified using a 2015 Landsat image extracted from Google Earth, where different land uses were easily recognizable from surface characteristics. Each polygon drawn in the classification process was then visited in the field to verify the assigned surface category (Figure 3). Three land-use categories were created: native land (N1), urban land (N4), and cultivated land (N5). Each of these categories has subcategories depending on vegetative cover and/or level of urbanization (Table 1; Figure 3). The target area was then used to validate the image segmentation of the 2005, 2009, and 2015 SPOT images to define the spatial and temporal variation of land use of the entire basin. For each land-use category, soil samples were collected to analyze their physical and chemical characteristics and to perform in situ infiltration tests (Figure 4, and Tables 2 and 3). Figure 5 illustrates the steps of the methodological procedures.
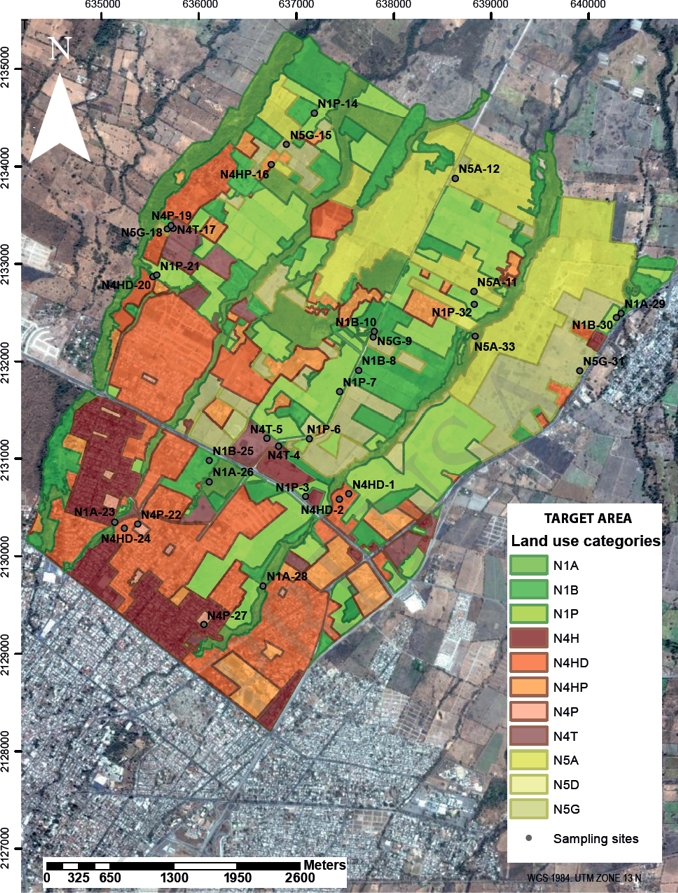
Figure 3 Land-use classification map for target area and location of sampled sites. An explanation of land-use classification labels can be found in Table 1.
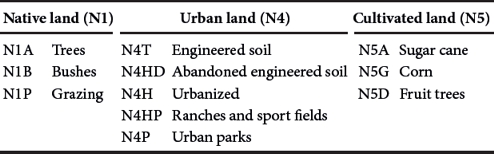

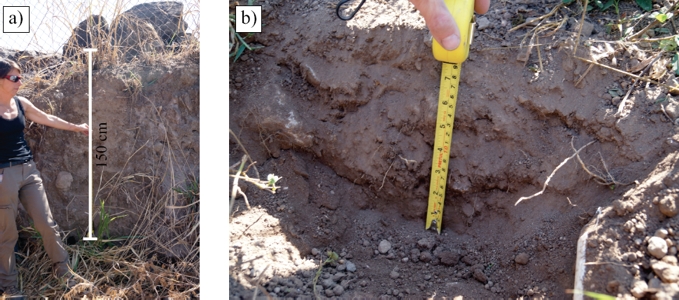
Figure 4 Pictures showing some of the procedures used in the present work. a) Example of sampling in an urban park using a 115 cm3 iron cylinder (shown in b). c) Initial and d) final step of the infiltration test with the drip infiltrometer.

Table 3 Summary of some physical and chemical characteristics of the soils by land-use category.
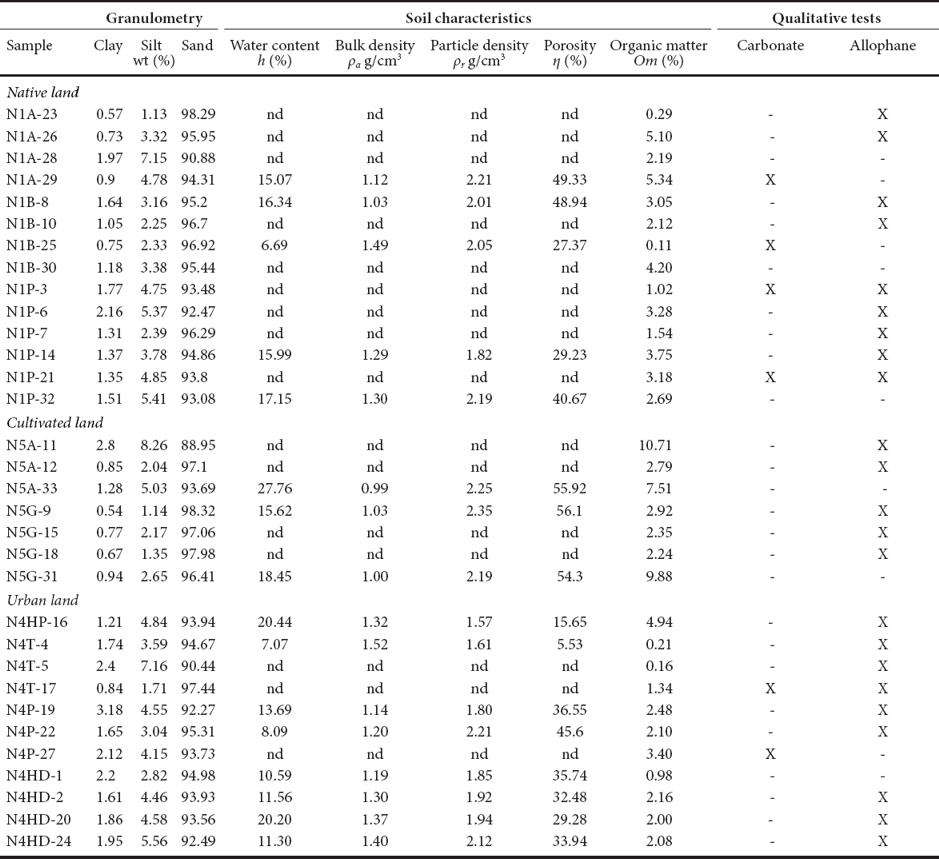
Note. nd: not determined; X: Positive to the test; -: Negative to the test. Sample code identify land-use category (see Table 1) and sample number.
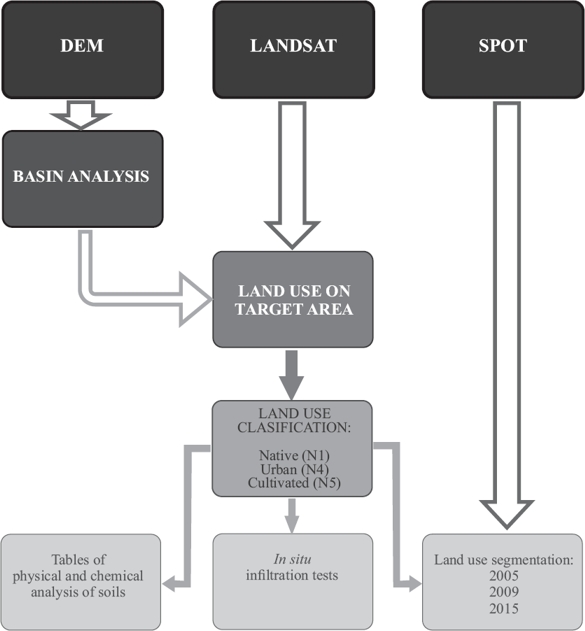
Figure 5 Flow diagram summarizing the methodology used in the present work. See Table 2 for analytical methods used for soil characterization.
Spatial and temporal changes in land use
To evaluate the spatial and temporal changes in land-use for the study area, three 1A level SPOT images of the dry season (without any previous geometric process) were selected to ensure the most similar image reflectance. The processed images are SPOT 4, 5, and 6 taken on May 2005, March 2009, and January 2015, respectively.
Radiometric and atmospheric corrections for the three 1A images were made using ENVI 5.1 software. Georeferentiation was performed in the IMAGINE AutoSync Workstation tool of ERDAS IMAGINE 2014 software using an orthophoto of the study area as a base image. The projected coordinate system used is the WGS 1984, UTM zone 13N. An average of 20 points were selected for each image, looking for a root mean square error (RMSE) of less than 3 on each point. For the performed analyses, the RMSE ranged from 0.24 to1.9.
Images were segmented to elaborate a land-use classification for the target area, using as training data the polygon of the land-use classification described above. This classification was performed only for urban land (N4), cultivated land (N5) and for native lands with trees (N1A) and grazing (N1P) land-uses. The land-use classification was then extended to the entire basin. The RMSE values of the supervised image classification were between 0.24 to 1.90.
Physical-chemical properties of soils
A total of 32 soil samples were collected in the target area and analyzed to determine their physical properties according to the methodology proposed by the USDA (1999, 2008) and Landscape for Life Organization (2016). Seventeen of these samples were extracted using a 115 cm3 iron sampling cylinder (Figures 4a and b) in order to get unaltered soil samples. For poorly developed soils with depths of less than 15 cm (Figure 6), the samples were collected with a shovel. Samples were carefully packed in plastic film to keep the in situ water moisture. Table 2 shows the analytical methods and the equations (1-6) used to determine bulk density (ρ α) and water content (h), granulometry, particle density (ρ r ), porosity (η), organic matter (Om), and carbonate and allophane qualitative estimation.
In situ infiltration measurements
Saturated hydraulic conductivity (K s ) is an important soil property, especially for surface runoff and infiltration processes. It can be obtained by field or laboratory methods; however, the measurement techniques are expensive and time consuming. Here, the K s was estimated based on a noninvasive field infiltration test. The model was proposed by Ekhmaj and Abdulaziz (2008) and it is based on the equation proposed by Wooding (1968) where discharge rate and a steady saturated radius are used to determine the saturated hydraulic conductivity:
 (7)
(7)
The left side of Equation 7 explains the gravity contribution to the flow, while the right side represents the capillarity and geometry of the source. In this equation q is the flux discharge per unit area (l/h/cm2); Q, the flux discharge (l/h); r s , the saturation radius of the water mirror when it becomes stable, i.e., ponded area (cm); K s , the saturated hydraulic conductivity (cm/h); and α is a constant relative to soil sorptivity, a property describing the rate of reduction in conductivity with matric head.
The soil moisture value is related to α as:
 (8)
(8)
where θ i is the initial soil moisture (%), θ f , the final soil moisture (%), S, the sorptivity (cm/h1/2), and b, the shape factor. The value of b is bounded between 1/2 and π/4. White and Sully (1987) suggested that b = 0.55 is a practical value for most soils.
To solve Equation 8 for K s , it is necessary to measure the initial (θ i ) and final (θ f ) soil moisture (Borselli et al., 2001). These values were obtained using a time-domain reflectometer (Turf-Tec International, 2016). Finally, the K s is obtained by equalizing the left term of Equation 7 with the equation proposed by Borselli et al. (2012):
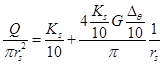 (9)
(9)
where G represents the capillarity depth, which can be expressed as:
 (10)
(10)
Finally, an algorithm in Excel was implemented with the solver tool, and K s and G area obtained by iteration from Equation 9.
The in situ infiltration measurements were made using a portable drip-infiltrometer. This drip-infiltrometer consists of three peristaltic pumps each connected by rubber hoses to a water container (Figure 4c). Each of the pumps supplies a different flow volume (Q1 = 1.56 l/h, Q2 = 2.71 l/h, and Q3 = 7.76 l/h). Pictures of the ponded area were taken every minute perpendicularly to the ground surface using a tripod, including a metric scale bar. The soils tests were performed in three sets of 15 minutes, one for each flow discharge, Q1, Q2, and Q3.
The ponded area was calculated excluding the capillarity portion, which is the wet area where the water had already infiltrated (Figure 4d). This image process was made using Corel-Photo-Paint X4 software. Once the area was defined, Image J software was used to calculate the surface of the ponded area needed to extrapolate the hydraulic conductivity.
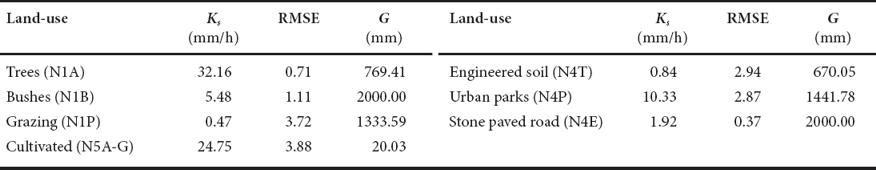
Finally, the K s was estimated using as input data in the solver the initial and final moisture, discharge rate, and ponded area, from which an optimized radius is calculated at each time step. Results are shown in Table 4.
Results
Physical and chemical properties of soils by land-use category
Based on land-use classification, representative soil samples were analyzed to obtain their physical and chemical characteristics to be correlated with their infiltration properties. In particular, unaltered lands (native) were distinguished by the presence of trees (N1A), bushes (N1B), and grazing (N1P). For altered lands (cultivated and urban), samples were obtained from agricultural land (N5, A for sugar cane and G for corn), engineered soil (native soil completely removed and replaced with compacted sand: N4T when in construction stage, and N4HD when partially abandoned and with incipient vegetative cover), rural altered land (e.g., ranches, N4HP), urban park area (N4P). Table 3 presents a summary of the physical and chemical characteristics of the analyzed soils.
Granulometric analysis
The particle-size distribution shows that all samples consist of more than 88% sand. The silt fraction is up to 8% and clay reaches a maximum of 3% (Figure 7).

Bulk (ρ α ) and particle density (ρ r ), water content (h), porosity (η), organic matter (Om), and allophane content
Samples from native land show highly variable properties. Bulk density varies from a minimum of 1.00 to a maximum of 1.50 g/cm3, while porosity varies from 6 to 56%. Water content varies from 7 to 28% and organic matter content from 0.16 to 11% (Table 3). Most of the analyzed samples contain allophane and few of them have carbonate. Samples from native land for grazing (N1P) show distinctive characteristics, with the lowest porosity values within the native land category, which ranged from 29 to 41%.
Samples from cultivated lands have more homogeneous characteristics, with bulk density around 1.00 g/cm3, porosity of 55%, water content between 28 and 18%, and organic matter values of 2%, with two samples that show values up to 11%. Almost all these samples contain allophane, but none of them contain carbonates.
Samples from urban lands represent the most heterogeneous group. The engineering soils show the lowest value of porosity (6%) and the highest bulk density (1.52 g/cm3, sample N4T-4). Samples from abandoned engineered soils (N4HD) show more homogeneous values with a lower average bulk density of 1.30 g/cm3, and porosity around 30%. The highest porosity and one of the lowest bulk density values were found in samples from urban parks (37% and 8.00 g/ cm3, respectively).
In summary, cultivated lands are the most homogenous type, while native and urban lands could be highly variable. Cultivated lands have very low bulk densities related to relative high organic matter content. They have the highest porosity values as a result of mechanical loosening during the cultivation process. In contrast, samples from grazing areas are the ones with the highest bulk density and the lowest porosity values. These properties differences play an important role in water infiltration as confirmed by the infiltration tests.
Soil permeability
The hydraulic conductivity (K s ) values obtained with the drip-infiltrometer (Table 4), varied from 32.16 to 0.47 mm/h. In the case of native lands, the K s has the highest value in the N1A category (trees). It drastically decreases to 5 mm/h for bush lands and to a minimum of 0.50 mm/h for grasslands used for grazing. Cultivated lands have a K s value of 24.75 mm/h. For urban surfaces, the park areas show the highest K s values for this category (10 mm/h), which drastically decreases to 0.80 mm/h for engineering soils. Stone paved roads (N4E) were also tested, even if they do not represent a land-use category at the scale of this study, obtaining a value of almost 2 mm/h. Thus, grazing lands are the least permeable among native lands (similar to engineering soils), whereas cultivated areas show one of the highest values (similar to natural lands with trees). Even if samples are up to 88% sand, the K s values obtained largely reflect their vegetative cover and degree of disturbance. Allophane content can also be an explanation for lower K s values, which are not expected for sandy soils. Finally, values calculated here were in the range of those reported previously for similar land uses (Christianson et al., 2012; Ferrer-Julia et al., 2003).
Land-use change
From 2005 to 2009 the urban area in the target zone has increased by 8% while, from 2009 to 2015, the increase was of 5%, with a total urban growth from 2005 to 2015 of 13%. Native soils and cultivated soils also changed during the considered period. Apparently, cultivated lands decreased 12% from 2005 to 2015, while native areas (all N1A and B land uses) decreased only 4% and grazing lands increased by 3% (Figure 8a, Table 5).

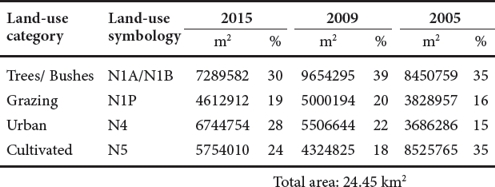
Considering the entire basin, where most of the land use is native or cultivated, natural lands increased by 9% from 2005 to 2015. Urban land, which represents ~28% of the entire basin, changed by 2% from 2005 to 2009 with practically no appreciable changes from 2009 to 2015. In contrast, cultivated lands showed a drastic decrease of 10% during this period that correlates with a similar increase in native lands (Figure 8b, Table 6).

Discussion
The land-use change phenomenon has been widely discussed, demonstrating that change in land use in developing countries modifies rainwater infiltration, increasing disasters associated to flooding (e.g., Gregory et al., 2006; Dong-Shen et al.,2008). In fact, land-use change, such as replacement of agriculture with housing, represents significant impacts on the rainfall runoff process. Residential construction also causes an increase in impervious areas, such as rooftops, driveways, and roads (Leopold, 1968).
On the basis of the physical and chemical characteristics of the analyzed soil samples representative of the different land uses classified here, and considering the K s values obtained from field tests, a preliminary evaluation between land-use change from 2005 to 2015 and flooding increase in the urban area of Colima is proposed. Several works pointed out that multiple infiltration tests are needed to appropriately estimate K s of disturbed or altered soils (e.g., Woltemade, 2010; Christianson et al., 2015). Here, we estimated the K s of each land use based only on one measurement. Nevertheless, by coupling these values with the physical and chemical characteristics of the analyzed sample, some observations about infiltration behaviors can be made.
The lowest bulk densities were found in soils from native land with trees, cultivated areas, and urban parks. Among these, cultivated soils have the highest porosity values (> 50%) due to constant agricultural plowing, resulting in a loose structure. This soil texture is in agreement with the result from the infiltration test, as the highest values of K s were obtained for these land use categories. In contrast, engineered soils and grazing lands show the highest bulk densities and the lowest porosities (between 5% and 30%) and they also correspond to the least permeable soils in the area, showing the lowest K s values (Tables 3 and 4). These characteristics can be easily explained considering that they are artificially (urban) or naturally (grazing) compacted.
Based on the temporal and spatial analyses of SPOT images, most changes in land use correspond to urban area and cultivated land (Figure 8), which show an increase and a drastic decrease, respectively. This was especially true for the target area, where urban growth was evident during the 2005-2009 period. In particular, the target area is representative of the northern portion of the urban area, which is the first to receive water runoff from the basin (Figure 9). Therefore, land-use change in this area can drastically change the amount of water runoff towards the central urban area. As more permeable lands are substituted by disturbed urban soils, the infiltration capability will be reduced, increasing flooding in Colima-Villa de Álvarez metropolitan area.
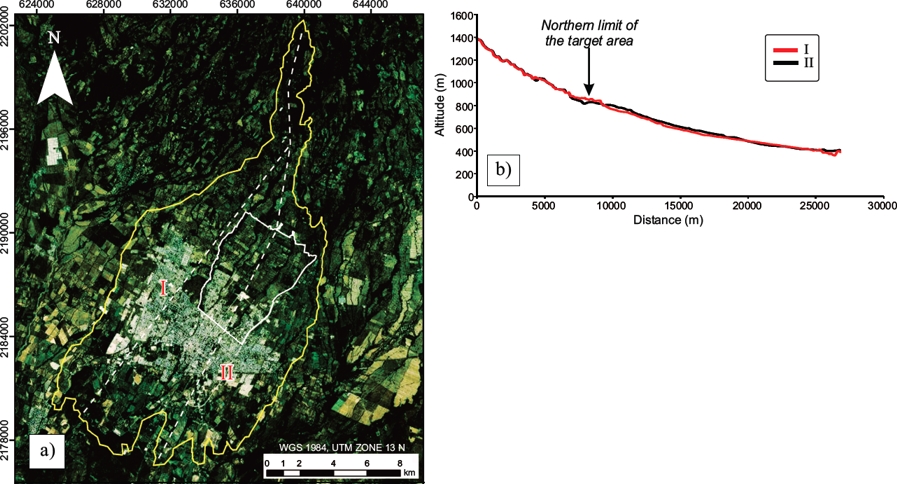
Figure 9 a) Landsat image showing the extent of the Colima hydrological basin along which two topographic profiles have been traced (I and II) to illustrate the water runoff being intersected by the northern neighborhoods of the urban zone before it drains into the metropolitan area. b) Topographic profiles showing how the urban development in the northern sector (target area) will control the amount of water runoff to the central urban area.
Conclusions and recommendations
The change in land use in the Colima urban area is identified here as one of the factors that is increasing its susceptibility to flooding and inundation. This is especially evident in the northern sector of the city, where urban development has increased, affecting lawn infiltration rates and storm-water runoff downslope. This is mainly due to the reduction of cultivated area and, therefore, of the most permeable soils among the natural soils analyzed. These lands are being abandoned probably because they will be soon dedicated to urban development (Reddy, 2012). In addition, it is also possible that the increase in urban area is changing the local rainfall behavior, increasing the precipitation intensity (Pathiran et al., 2014) due to the urban heat island effect (Dixon and Mote, 2003), which represents one of the many consequences of land-use change (Foley et al., 2005).
It is recommended to carefully supervise the way in which the urban zone of Colima-Villa Álvarez keeps growing. It is necessary to have an adequate management of land-use change and the conservation of permeable lands in order to control flooding zones (Pedroza-Acuña et al., 2015). Neglecting studies of natural and urban environments will promote an inadequate evolution of the cities, which will put the communities of this metropolitan area at higher risk. Correct land-use management, especially in urban areas, can reduce inundation susceptibility (González-Sosa et al.,2010).

