


 nova página do texto(beta)
 Inglês (pdf)
 Artigo em XML
 Referências do artigo
 Enviar este artigo por email
 Citado por SciELO
  Similares em
SciELO
Similares em
SciELO 
 Permalink
INTRODUCTION
Soil depth and texture exert strong controls on water and energy fluxes at the ground surface affecting their spatiotemporal distributions in watersheds (Saxton and Rawls, 2005; English et al., 2005). It is widely accepted that thin soils lead to the production of saturation-excess overland runoff, while thicker soils have more storage capacity, thus controlling biotic and abiotic processes (Bertoldi et al., 2006; Tromp-Van Meerveld and McDonnell, 2006; Gochis et al., 2010). Soil depth (or thickness) acts as a main reservoir for water in semiarid watersheds and affects plant transpiration and carbon fixation in ecosystems depending on the temporal and spatial availability of soil moisture. Similarly, soil texture (or particle size distribution) controls the storage and infiltration capacity of a soil profile leading to variations in soil water content and its dependent hydrologic processes. For these reasons, accurate spatial representations of soil depth and texture are important to identify the spatial patterns of hydrologic processes and their connectivity, as well as their persistence in time and space (e.g., Vivoni et al., 2008a; Pelletier and Rasmussen, 2009; Nicótina et al., 2011). Nevertheless, these soil properties are highly variable within a watershed due to the complex interactions between topography, climate and biophysical processes. Thus, determining the spatial distribution of soil thickness and texture remains an open question in Geosciences.
The use of topographic attributes, such as elevation, slope and curvature, is a promising approach for estimating the spatial distribution of soil depth. A common set of methods is based on empirical relations between local terrain attributes and the soil thickness observed at a limited number of sampling sites (e.g., Moore et al., 1993; Gessler et al., 1995; Saulnier et al., 1997; Heimsath et al., 1999, Catani et al., 2010). These methods have the capacity to overcome the need for a large number of soil depth observations that are difficult and time-consuming to obtain. When soil thickness varies spatially within a watershed, we would expect significant spatial differences in soil moisture, evapotranspiration and runoff production dictated by the soil depth patterns. Identifying whether this is the case is possible through the use of a numerical watershed model that accounts for the hydrologic processes in semiarid regions where terrain attributes have a strong control on soil distributions. Only a few studies have focused on the importance that soil thickness exerts on hydrologic processes in semiarid regions with complex topography (e.g., Gochis et al., 2010; Cuo et al., 2011 ; Rahimy, 2012; Garambois et al., 2013). However, in these studies, the spatial patterns of hydrologic states and fluxes typically have not been investigated. Furthermore, the controls of soil texture and its interaction with soil depth are often ignored by, for example, assuming a homogeneous soil type in the watershed.
Including the spatial distribution of soil texture is essential for depicting hydrologic properties, such as hydraulic conductivity, porosity and water holding capacity. Nevertheless, existing soil texture maps are often very coarse since these are based on limited soil sampling sites and interpolations using mapped topographic or geological units. Recent studies have shown that soil texture correlates with radiances in the visible and near infrared regions (Zhang et al., 1992; Sullivan et al., 2005). This characteristic allows for the use of multi-band remote sensing imagery to infer soil texture from satellites at high spatial resolutions (ranging from 15 to 90 m, depending on the satellite used). The role played by the spatial distribution of soil texture on the hydrologic response in a watershed can be quantified using a numerical watershed model able to represent the spatial variations in soil hydrologic properties at high resolution. This spatial control is often ignored in modeling studies which assume a single soil texture map that is typically coarser in resolution than the terrain or vegetation properties represented in the model.
In this study, we evaluate the effects of distributed soil depth and texture representations on the water and energy fluxes within a semiarid watershed of northwest Mexico. The study site was selected for its complex terrain leading to spatial variations in both soil depth and texture that affect hydrologic conditions during a wet summer season related to the North American monsoon (NAM). Thus, while the region is considered to be semiarid, Vivoni et al. (2010) suggest that the watersheds in the NAM region are ‘seasonally wet’ with sufficient soil moisture to induce downslope lateral transport that is impacted by the distribution of soil depth. The arrival of intense storms during the NAM (Mascaro et al., 2014) also implies that the soil textural controls on infiltration-excess overland flow are important within the watershed. We combine a diverse set of tools and datasets in this study, including: (1) a distributed hydrologic model tested thoroughly against field observations (Vivoni et al., 2010; Méndez-Barroso et al., 2014), (2) a set of soil depth observations including particle size distribution and (3) geospatial data layers from remote sensing used to conduct terrain analyses and soil mapping. Simulations during the Soil Moisture Experiment 2004 (SMEX04) were conducted for different combinations of soil depth and texture maps with a hydrologic model known as the Triangulated Irregular Network (TIN)-based Real-time Integrated Basin Simulator (tRIBS, Ivanov et al., 2004; Vivoni et al., 2007b). This hydrologic model has been used effectively in prior studies to identify the controls related to terrain and soil conditions on the spatial patterns of the hydrologic response (e.g., Vivoni et al., 2010; Mahmood and Vivoni, 2011; Robles-Morúa et al., 2012), but the combined sensitivity to spatial representations of soil depth and texture has not been investigated.
Although we have tested only one model, the hydrological model tRIBS shares common features with a wide range of process-based (or physically-based) hydrological models. Many current process-based models basically share the same structure in terms of process description, techniques of solution and model approach (see reviews by Singh et al., 2002; Fatichi et al., 2016). Modern process-based hydrological models (such as tRIBS) represent or estimate water fluxes and states by incorporating the spatial variability of meteorological forcings, the representation of the topographic features and the heterogeneity of land surface characteristics. At the same time, these models can resolve the lateral and vertical subsurface fluxes within a representative elemental unit. Therefore, these models require solving partial differential equations in three spatial dimensions and time which require numerical methods such as finite difference or finite element techniques. Similarly, tRIBS and other hydrological models are based on the integration of multiple process components that represents the dynamics in a watershed at a higher integrated scale. This latter is known as “bottom up” model approach. Furthermore, flow pathways in distributed process-based models, especially for shallow groundwater movement, typically rely on the assumption that these pathways are controlled by catchment topography. However, this assumption is valid for shallow soils underlain by impermeable bedrock. Recent modeling research has found that bedrock topography exerts a stronger control in downslope groundwater flows rather than surface topography (MacDonell et al., 1996). Despite these recent findings, the role of bedrock topography on the spatial variations of groundwater fluxes and the generation of runoff is still poorly understood.
METHODS
Study Watershed
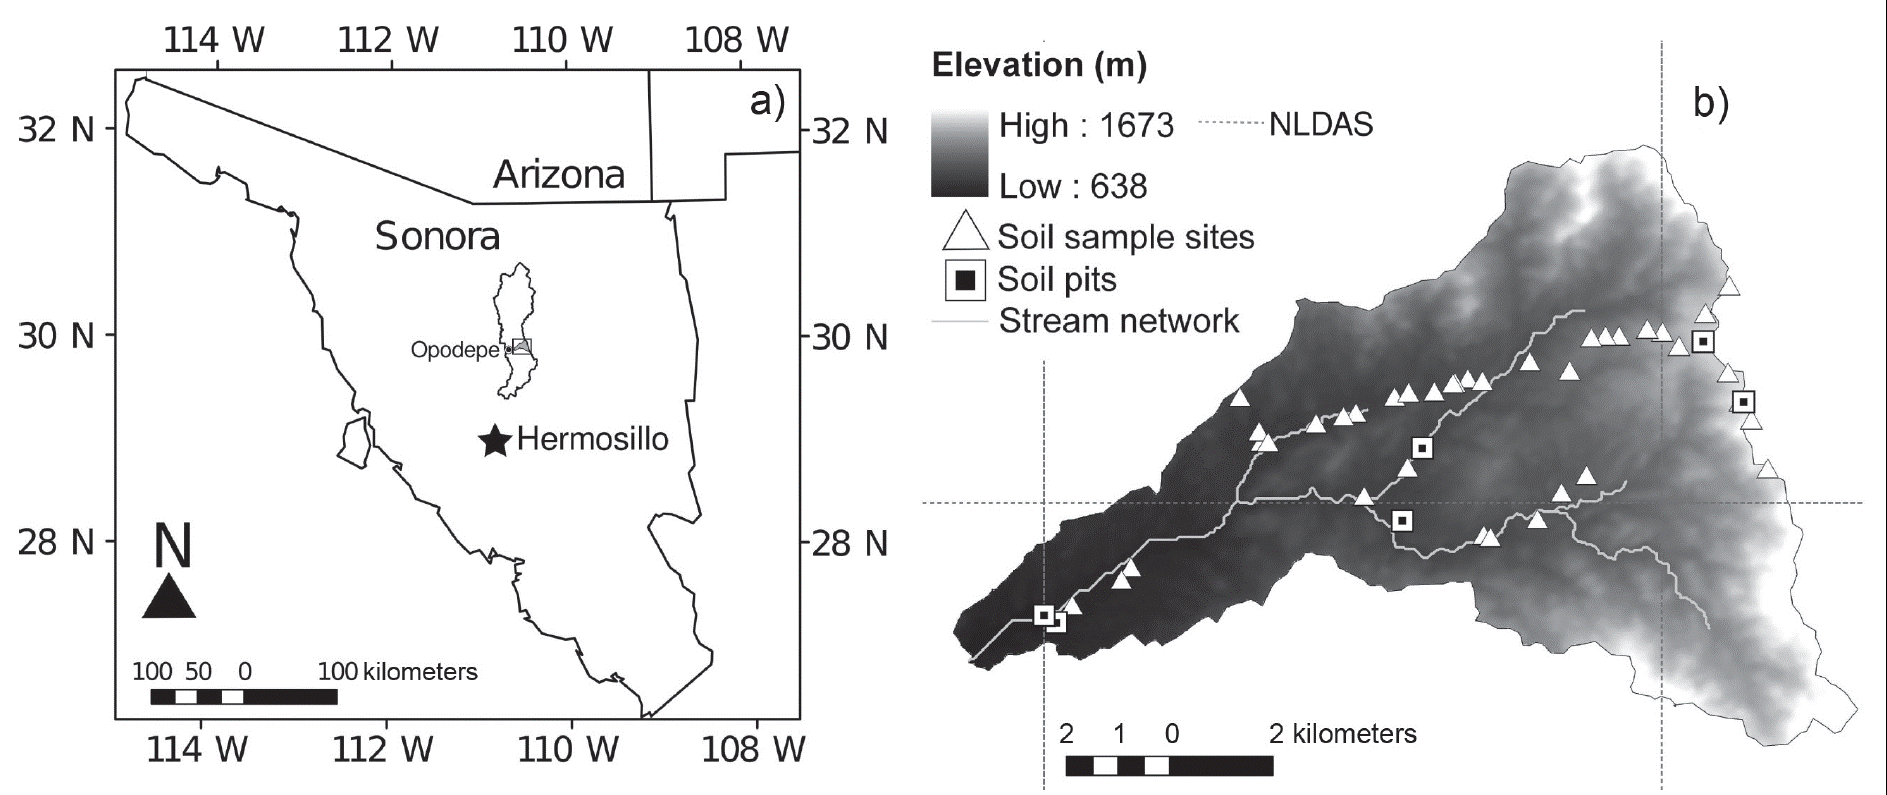
The study watershed is the Sierra Los Locos (SLL, 93.2 km2) basin located east of the small rural town of Opodepe, Sonora, and about 150 km northeast of Hermosillo, Sonora, Mexico. Figure 1 shows the location of SLL watershed that is nested inside the Rio San Miguel (3,796 km2) with its elevation characteristics. Elevation data at 30 m resolution from the Advance Spaceborne Thermal Emission and Reflection Radiometer (ASTER) was utilized to derive the topographic attributes (e.g., elevation, slope, curvature and topographic index) as well as the watershed boundary and stream network. Total relief in the watershed is 1,035 m, with the lower elevations dominated by subtropical scrubland, while oak woodlands and grasses dominate higher elevations (Vivoni et al., 2007a, 2010; Méndez-Barroso et al., 2009; Méndez-Barroso and Vivoni, 2010). Local topography influences the mean annual rainfall, which ranges from 500 to 700 mm/yr, with close to 70% of the annual amounts falling during the NAM from July to September (Xiang et al., 2014; Mascaro et al., 2014). Several studies in the NAM region have shown that rainfall seasonality leads to large changes in vegetation greenness which affect water and energy fluxes (e.g., Dominguez et al., 2008; Forzieri et al., 2011, 2014; Tang et al., 2012; Vivoni, 2012; Méndez-Barroso et al., 2014). As a result, it is important to incorporate the seasonal variations in rainfall and vegetation properties when identifying the role of soil thickness and texture on the spatial distribution of hydrologic processes in the watershed during the North American monsoon. As described later, the hydrologic model used here has the capability to account for dynamic changes of vegetation properties and hydrometeorological forcings.
Soil thickness and soil texture sampling
Two soil sampling activities were carried out in August 2007 in the SLL watershed (Vivoni et al., 2010), consisting of: (1) the estimation of soil depth from six soil pits and (2) the sampling of surface soils (0 to 5 cm depth) at forty-two locations distributed from the basin headwaters to the outlet. Because of limitations in site accessibility, we focused the sampling activities close to the main unpaved road traversing the watershed along an elevation transect. Figure 1b shows the location of soil pits (dark squares) and surface soil samples (triangles). Soil pit records, containing soil thickness and texture, were obtained at representative locations with varying characteristics such as elevation, slope and vegetation cover. The soil thickness was determined when an impermeable soil horizon was found. Soil samples were analyzed in the laboratory to determine particle size distribution (texture) and bulk density. Bulk density was estimated by the clod method (Blake, 1965), while the relative masses of sand, silt and clay were obtained through the “Pipette” method (Gee and Bauder, 1986). The soil textural class was found using the USDA triangle method based on the results from the particle size analysis.
Estimation of the spatial distribution of soil thickness
We used several empirical models to estimate soil thickness based on the topographic features obtained from the 30 m ASTER elevation map. First, we applied the approach of Saulnier et al. (1997) that assumes a linear decrease between soil thickness and elevation (referred to here as the S-Z-97 method). In this approach, the soil depth (hi) for pixel i is:
 (1)
(1)
where zi is the pixel elevation, zmin and zmax are the minimum and maximum elevations in the watershed and hmin and hmax are the minimum and maximum observed soil depths. Elevation values were extracted at the location of the soil pits from the 30 m ASTER digital elevation model while hi was computed with ArcGIS 10.1 raster calculator. Saulnier et al. (1997) also developed an alternative method for soil depth estimation assuming a linear relation between soil thickness and terrain slope (referred to here as the S-S-97 method) as:
 (2)
(2)
where tan θi is the local calculated slope in degrees and tan θmin and tan θmax are the minimum and maximum slopes in the watershed. Terrain slope was calculated using ArcGIS 10.1 (Spatial Analyst) using the ASTER digital elevation model as input data, while soil depth (hi) was estimated using the ArcGIS 10.1 raster calculator. Third, we implemented the approach of Gessler et al. (1995) to estimate the spatial distribution of soil thickness based on a multi-linear regression between curvature of the surface using the approach of Moore et al. (1993) , topographic index and soil depth (referred to here as the G-95 method). The topographic index (TI) in the watershed was obtained following the approach of Beven and Kirby (1979) as:
 (3)
(3)
where CA is the upslope contributing area obtained following Jenson and Domingue (1988) and θ is the local slope angle. The topographic index, contributing area and the surface curvature were computed in ArcGIS 10.1. The multi-linear regression was performed to estimate soil depth by using 30 m pixel values of curvature (CU, defined as the combination of plan and profile curvature) and TI at the soil pit locations as independent variables. Finally, we evaluated a soil thickness estimation approach relying on the curvature distribution, regarded as a preferred way to infer soil depth from terrain attributes (e.g., Heimsath et al., 1999; Dietrich et al., 2003). The method of Heimsath et al. (1999, referred to here as the H-99 method) is based on a linear regression between surface curvature obtained using a fourth-order polynomial (Moore et al., 1993) at the soil pit locations and the measured soil thickness. Estimated soil thickness distributions were smoothed and resampled to a resolution of 120 m using a bilinear interpolation method to reduce differences between adjacent pixels and avoid unrealistic soil depth gradients. Terrain analyses and processing steps were carried out using ArcGIS 10.1.
Estimation of the spatial distribution of soil texture
We used several methods to obtain the spatial distribution of soil texture within the SLL basin. First, the soil texture map from the Instituto Nacional de Estadística y Geografía (referred to here as the INEGI method) provided a coarse representation of the major variations in soil properties within the watershed. While this product cannot capture high-resolution variations in soil texture, it serves as a benchmark that is considered as a standard in Mexico. Second, we employed the soil map derived by Vivoni et al. (2010) that is based on a combination of the INEGI map and a classification of terrain slope with some limited verification with the soil sampling conducted in the watershed. While this map exhibits a marked improvement in the soil texture distribution, it assumes an empirical distribution between particle size distribution and surface slope (referred to here as the Slope-based method). Finally, we employed an ASTER image obtained during the dry season (May 15, 2008) to determine surface soil texture based on the L1B registered radiance values (referred to here as the ASTER-based method) using methods described by Apan et al. (2002) and Liao et al. (2014). Digital numbers (DN) for different bands were converted to radiances through the use of a unit conversion coefficient. Bands represent the visible to near infrared region (bands 1 to 7 at 15 m resolution) and the thermal infrared (band 10 to 14 at 30 to 90 m resolution) region. The image acquisition in the dry season allowed for maximum exposure of the surface soils and minimized the effects of vegetation. We grouped radiance values into the four texture classes found in the SLL watershed: sandy clay loam, sandy loam, loamy sand and sand. The mean and standard deviation of the radiance values of each band were calculated for each soil class. The bands that showed significant differences in radiance values among textural classes were then selected for a subsequent image classification based on cluster analysis and a maximum likelihood unsupervised approach implemented in ArcGIS 10.1.
Evaluation of performance of spatially-distributed soil texture and depth maps
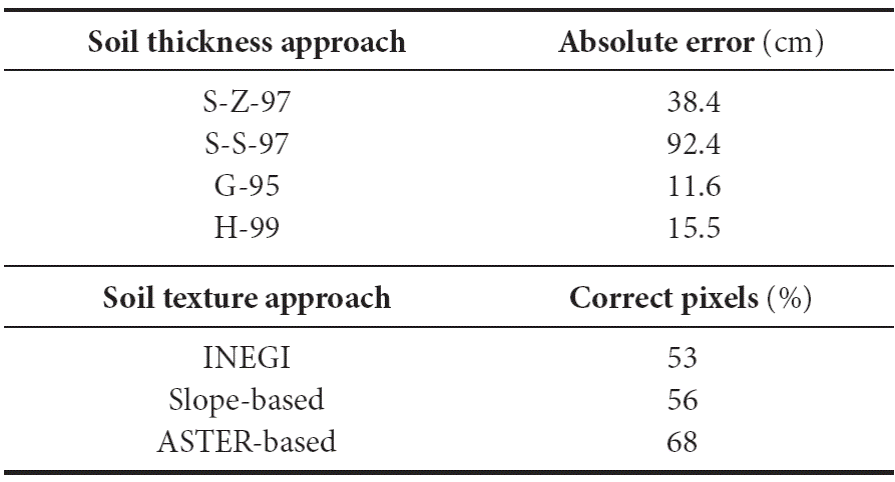
Performance of soil thickness model was evaluated with two different approaches. The first approach includes the estimation of mean absolute error (MAE) defined as:
 (4)
(4)
where n is the number of observations, Oi is the observed soil thickness and Ii is the estimated soil thickness. The second approach included the computation of the Akaike Information Criterion (AIC) which is an analysis that allows selecting the best model among several ones based on the strength of evidence for each one. The model with the smallest AIC is regarded as the optimal one of all the proposed models. AIC is defined as:
 (5)
(5)
where k is the number of estimated parameters in the model plus one and σ2 is an estimate of the variance of residuals and is given by:
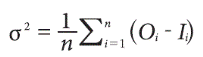 (6)
(6)
Furthermore, the delta AIC (∆ i) is defined as the difference between the AIC of certain model (AIC i) with the minimum AIC (AIC min). This is a measure of each model relative to the best model, where the larger the AIC difference of a model, the less plausible it is to be the best one. Finally, the Akaike weights (w i) represent the ratio of ∆i values for each model relative to the whole set of R candidate models:
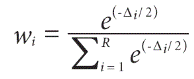 (7)
(7)
The interpretation of Akaike weights is straightforward, they indicate the probability that the model is the best among the whole set of candidate models. The accuracy of soil texture maps was evaluated by the use of an error matrix that consists of extracting the soil texture category in the estimated map at the location of the 42 surface samples. Once extracted, the texture category of the map is compared with the observed texture in the field. The accuracy of the map is reported as the ratio of correct classified pixels to total number of extracted pixels (n = 42).
Hydrologic model description, meteorological forcing and parameterization
Numerical simulations of hydrologic conditions were carried out in the SLL watershed using the tRIBS model. The Triangulated Irregular Network (TIN) that represents the watershed terrain consists of elevation, stream network and boundary nodes with a reduced number of model elements as compared to the original 30 m elevation field from ASTER (e.g., Vivoni et al., 2004). In the SLL watershed, the model is based on 49,390 Voronoi polygons that are the nearest neighborhood of each TIN node and used as a finite volume domain for water and energy calculations (Ivanov et al., 2004). For each Voronoi polygon, the model accounts for a range of hydrologic processes in response to meteorological forcing, including: (1) canopy interception; (2) evapotranspiration from bare soil and vegetated surfaces; (3) infiltration and soil moisture redistribution; (4) shallow subsurface flow; and (5) overland and channel flow. In previous studies, tRIBS has shown good performance with respect to soil moisture, surface temperature and evapotranspiration data in the SLL watershed (Vivoni et al., 2010; Mascaro and Vivoni, 2012; Méndez-Barroso et al., 2014; Xiang et al., 2014). Model simulations for the 2004 summer season (May 1 to September 30) were carried out using the parallel computing capabilities described by Vivoni et al. (2011) on 15 processors. The first month of simulation consisted of a dry period with no rainfall used as a model spin-up to deplete the initial soil moisture. The spin-up period was excluded from the model comparisons performed. During the simulation period, the meteorological forcing was based on ground-corrected grids obtained from the North American Land Data Assimilation System, version 2 (NLDAS-2), as described by Xiang et al. (2014). As shown in Figure 1b, the spatial resolution of the NLDAS-2 forcing fields (atmospheric pressure, relative humidity, incoming shortwave radiation, air temperature, wind speed and precipitation) was 12 km, leading to a few pixels over the SLL watershed (5 in total). In addition to the time-varying meteorological forcing, the simulations also accounted for the temporal variation of the vegetation conditions due to the rapid greenup occurring in the SLL watershed during the summer. This was achieved by developing empirical relations between remotely-sensed variables from the MODerate Resolution Imaging Spectrometer (MODIS) and vegetation parameters, as discussed in Méndez-Barroso et al. (2014). Albedo, Normalized Difference Vegetation Index (NDVI), Leaf Area Index (LAI) and the Fraction of Photosynthetically Active Radiation (FPAR), available at resolutions of 250 m to 1 km and repeat intervals of 8 to 16 days, were used to derive vegetation fields (vegetation fraction, stomatal resistance, maximum canopy storage, free throughfall coefficient, optical transmission coefficient and albedo) for the model.
Sensitivity analysis of soil thickness and soil texture distributions
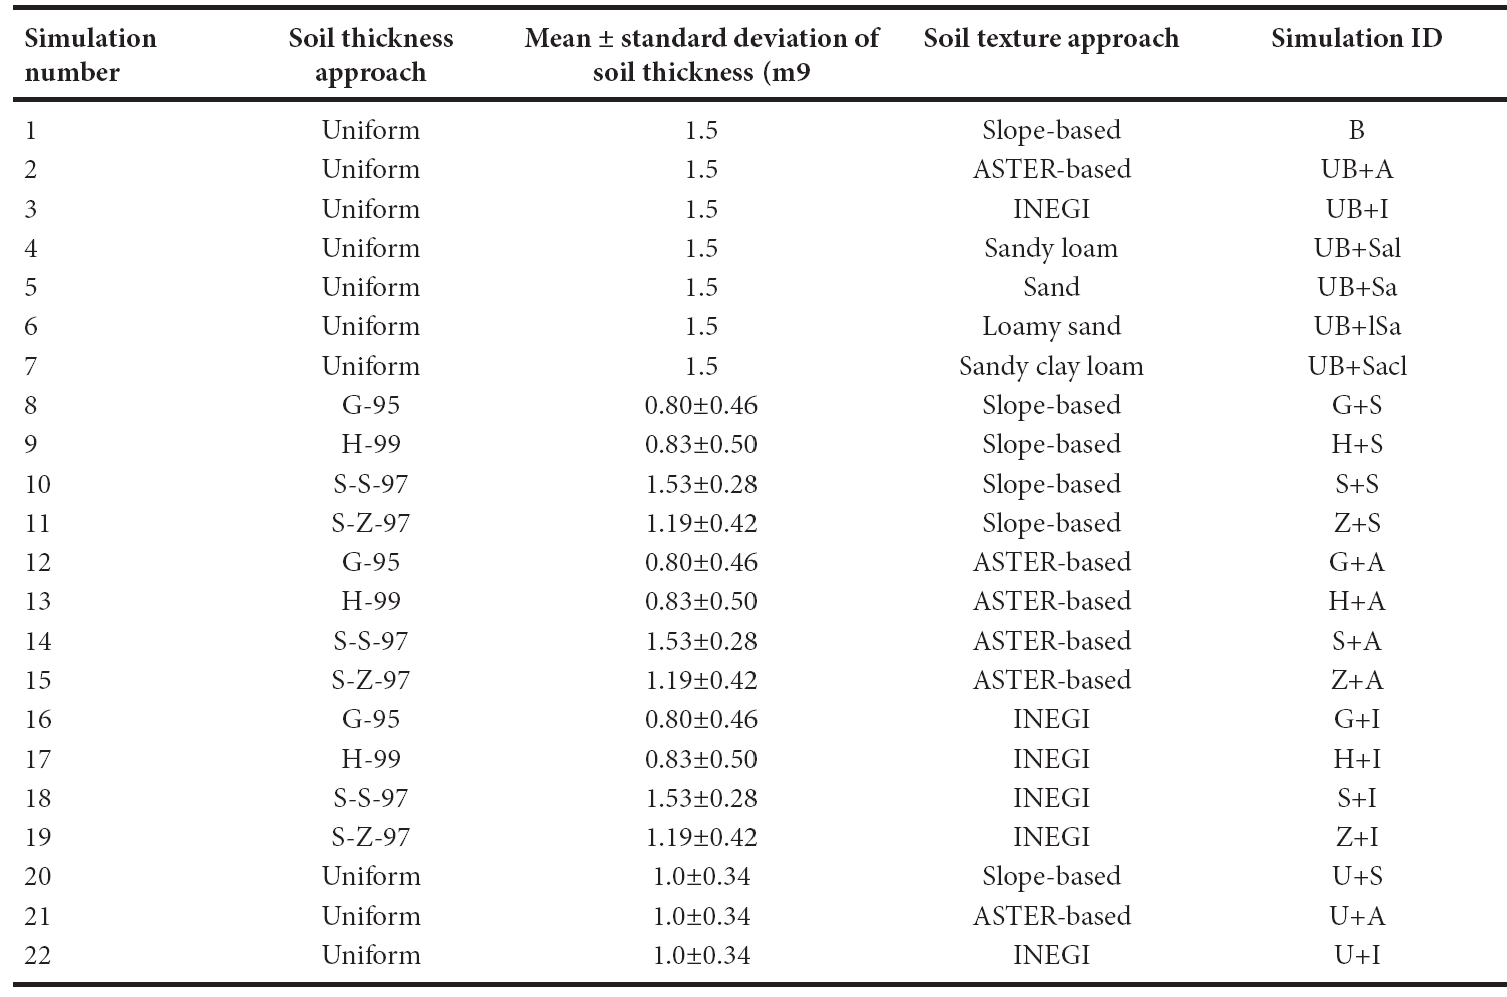
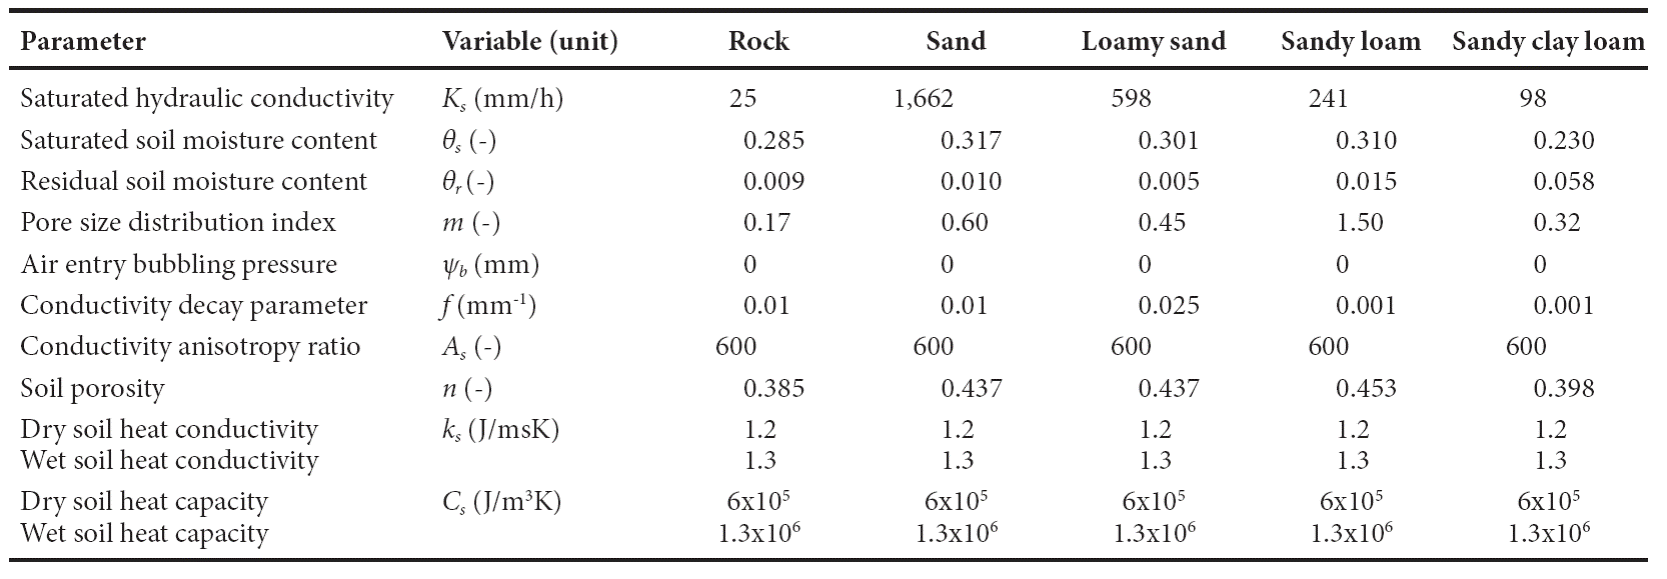
To evaluate the effects of soil thickness and texture on the hydrologic conditions in the SLL watershed, we conducted simulations for identical model setups (e.g., domain, initial state, meteorological forcing, vegetation variations), except for the specification of the soil property distributions. The simulation of Xiang et al. (2014) served as a benchmark case, where the Slope-based method for soil texture was used along with a uniform soil depth of 1.5 m. Given the excellent performance of the benchmark (B) case with respect to surface soil moisture, soil temperature and evapotranspiration measurements; it represents closely the hydrological conditions during the North American monsoon as reported in Xiang et al. (2014). Hence, the variation of the soil thickness and texture patterns performed here should be considered as a sensitivity analysis. We evaluated different combinations of soil depth and soil texture scenarios, as described in Table 1, for four spatially-variable soil depth maps (S-S-97, S-Z-97, G-95, H-99) and three spatially-variable soil texture maps (INEGI, Slope-based, ASTER-based), as well as two basin-wide uniform soil depths (1.0 and 1.5 m) and four basin-wide uniform textural classes (sand, sandy loam, sandy clay loam and loamy sand, with uniform soil depth of 1.5 m). As a result, a total of twenty-two different combinations of soil depth and texture were performed. In each simulation, the soil hydraulic properties for each soil texture class were kept identical, following Xiang et al. (2014), in such a way that the sensitivity analysis focused on the combined effects of the spatial patterns of soil thickness and texture. Xiang et al. (2014) obtained the initial soil parameters from soil pedotransfer functions based on particle size fraction and bulk density (Van Genuchten, 1980; Rawls et al., 1983; Rawls and Brakensiek, 1989) followed by manual calibration. Table 2 presents the soil parameter values for the tRIBS model used for each of the texture classes.
RESULTS AND DISCUSSION
Evaluation of distributed soil thickness and soil texture approaches
prior to discussing the effects of soil thickness and texture on the hydrologic response of the SLL watershed, we evaluate each approach with respect to the field observations. Figure 2 compares the spatial distribution of soil thickness derived from each method along with the resulting basin-averaged soil depth (
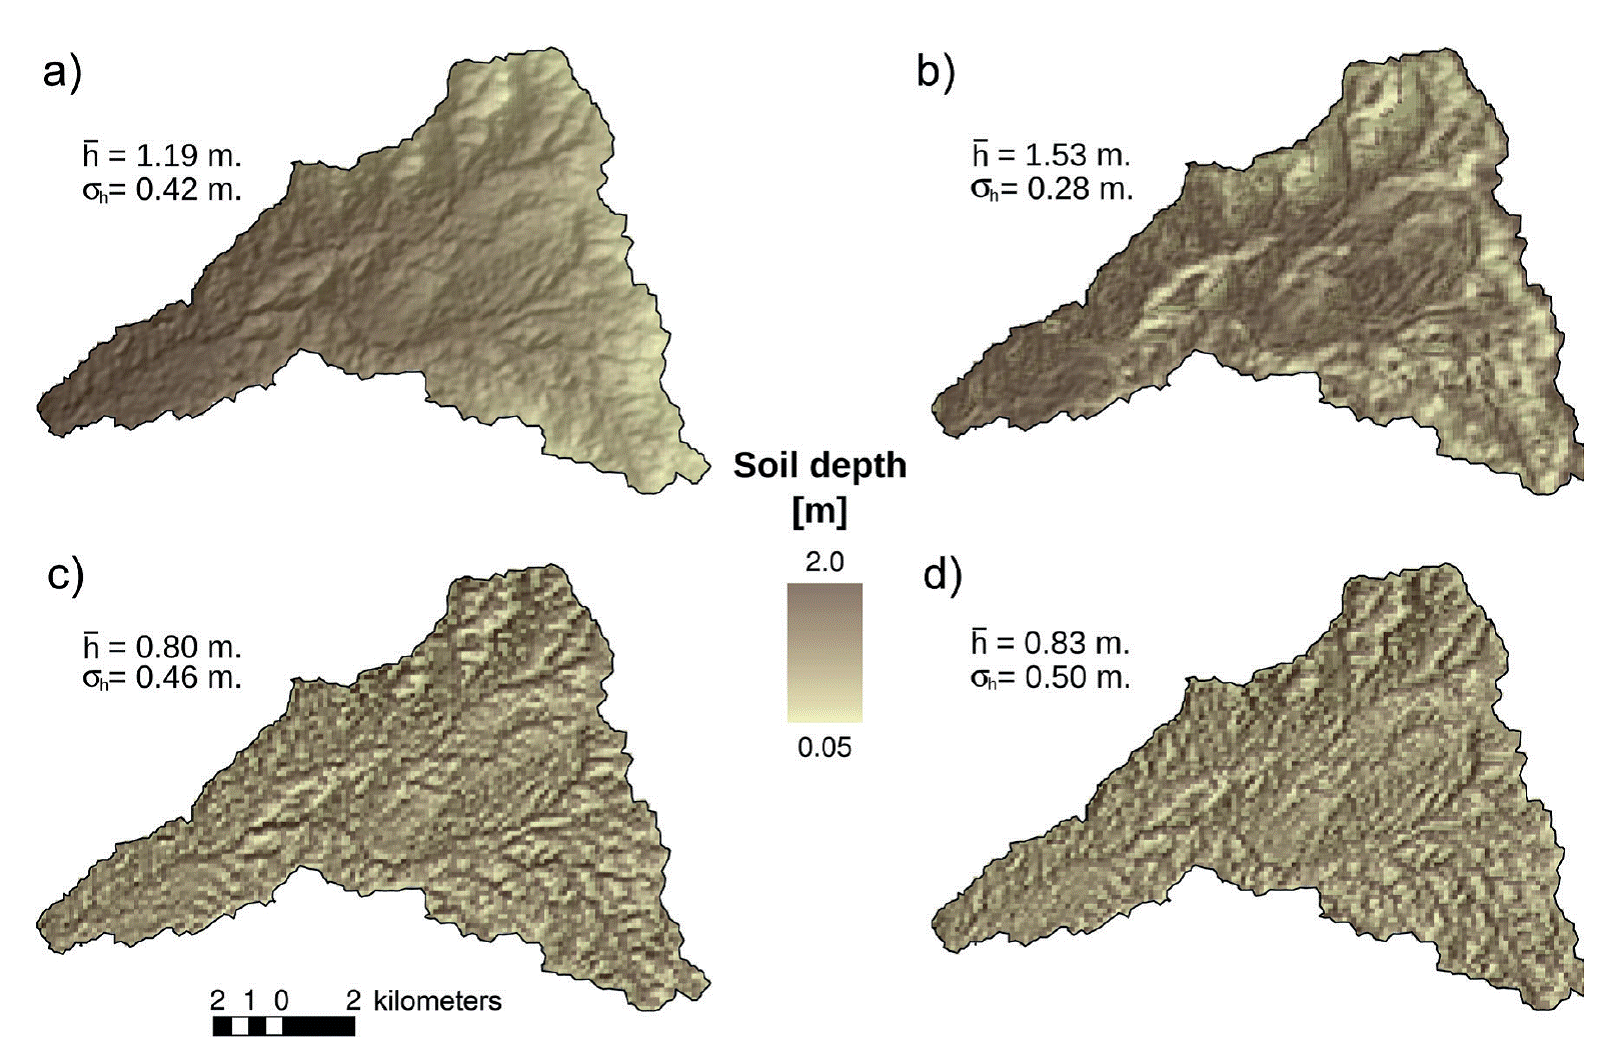
Figure 2 Comparison of soil thickness distributions for (a) S-Z-97, (b) S-S-97, (c) G-95 and (d) H-99 methods. The basin-averaged soil depth and the spatialstandard deviations are shown.
Table 3 Accuracy of soil thickness and texture approaches at soil pit and Surface sampling sites. The absolute error is the mean at the saoil pit locations.
The second approach to measure the selection of the “best model” with the application of the Akaike Information Criterion (AIC) is shown in Table 4 and provides consistent results to the prior analyses. The H-99 method resulted in the best model for soil depth estimation in the SLL basin, leading to the smallest AIC among the evaluated models (16.36), while the Akaike weight (wi) indicated a probability of 63% of being the best model. The G-95 method also exhibited a good performance, due to its relatively low AIC and ∆i. However, a relatively low value of wi (37% of being the best model) indicates this model is not as good as the H-99 method at this site. Thus, the two approaches used to assess the best method for soil depth estimation yielded consistent outcomes. Nevertheless, the main goal of this study is to evaluate the effect of different soil depth and texture distributions on controlling basin water fluxes and states.
Table 4b Results of the Akaike Information Criterion (AIC) for the models used to estimate spatially-distributed soil depth. In addition to the AIC, the difference to smallest AIC (Δi), and the Akaike weight (w i) were estimated.
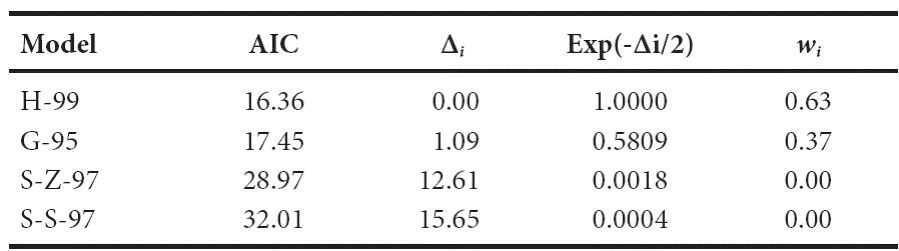
Figure 3 presents the comparison of the soil texture distributions for the three different methods, while Table 3 indicates the percentages of correctly classified pixels as compared to the surface soil samples (extracted pixels on the location of the 42 surface samples collected in the basin). The official soil map from INEGI has three soil classes with a clear pattern of finer soils at higher elevations (sandy loam) and coarser soils at lower elevations (sand), with 53% of pixels at sampling sites correctly classified. Accounting for surface slope, as performed by Vivoni et al. (2010), improved the classification accuracy to 56%, while also adding rock outcrops at the highest slope sites and sandy clay loam areas near the floodplain zones. The use of the ASTER visible and thermal bands showed clear spatial differences in radiances that were associated to surface soil features. For example, for bands 1 (green), 2 (red) and 3 (near infrared), a clear distinction was achieved between areas with sand and sandy loam soils, while thermal bands (12 and 13) helped to distinguish loamy sand and sand regions. As a result, the ASTER-based map shows some of the general characteristics of the other approaches with respect to the variation with elevation, but more clearly distinguishes the soil texture classes, including rock outcrops. From a geological perspective, the soil texture variations appear more realistic and achieve an improved accuracy of 68% as compared to the surface soil sampling sites.
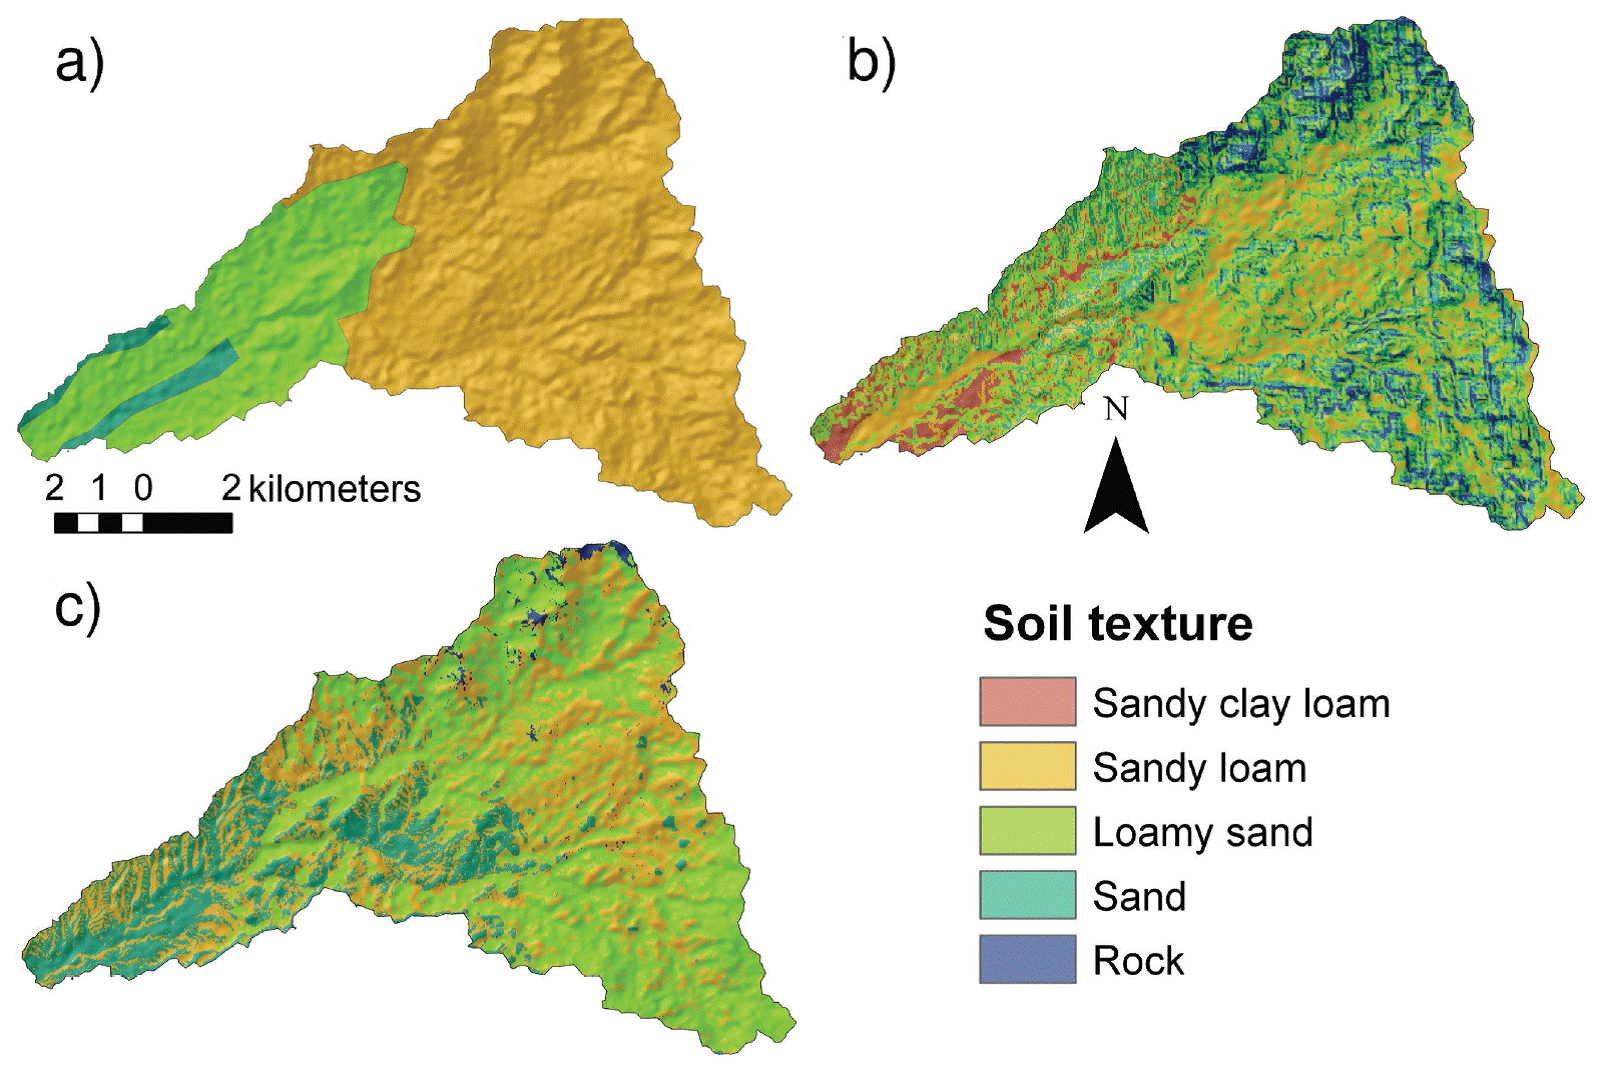
Figure 3 Comparison of soil texture distributions from (a) INEGI, (b) Slope-based method and (c) ASTER-based method with the corresponding textural clases described in Table 2.
Comparisons of basin-averaged water balance components to data for benchmark case
Given the importance of establishing confidence in the model simulations, we next present a comparison to the available field observations during SMEX04 (Vivoni et al., 2007a, 2008b; Ryu et al., 2010). Figure 4 shows the basin-averaged water balance components for the benchmark (B) simulation using a uniform soil thickness of 1.5 m and the Slope-based texture map, as in Xiang et al. (2014). The rainfall amounts and their distribution in time dictate the hydrologic responses in terms of soil moisture (SM), evapotranspiration (ET), streamflow (Q) and the change in the depth to the groundwater table (Nwt). With sufficient rainfall during the summer season, vegetation communities in the SLL watershed increase in greenness (NDVI) through leaf production (Vivoni, 2012). The temporal evolution of surface soil moisture (5 cm depth average SM) and root zone soil moisture (1 m depth average SM) illustrate well how the dry conditions prior to the NAM substantially change upon the arrival of rainfall events. In addition, the benchmark simulation captures a soil moisture recession period in August that is present in ground data (Vivoni et al., 2008b) and within a remotely-sensed product (2D-STAR, Ryu et al., 2010), providing confidence in the simulated surface soil moisture dynamics.
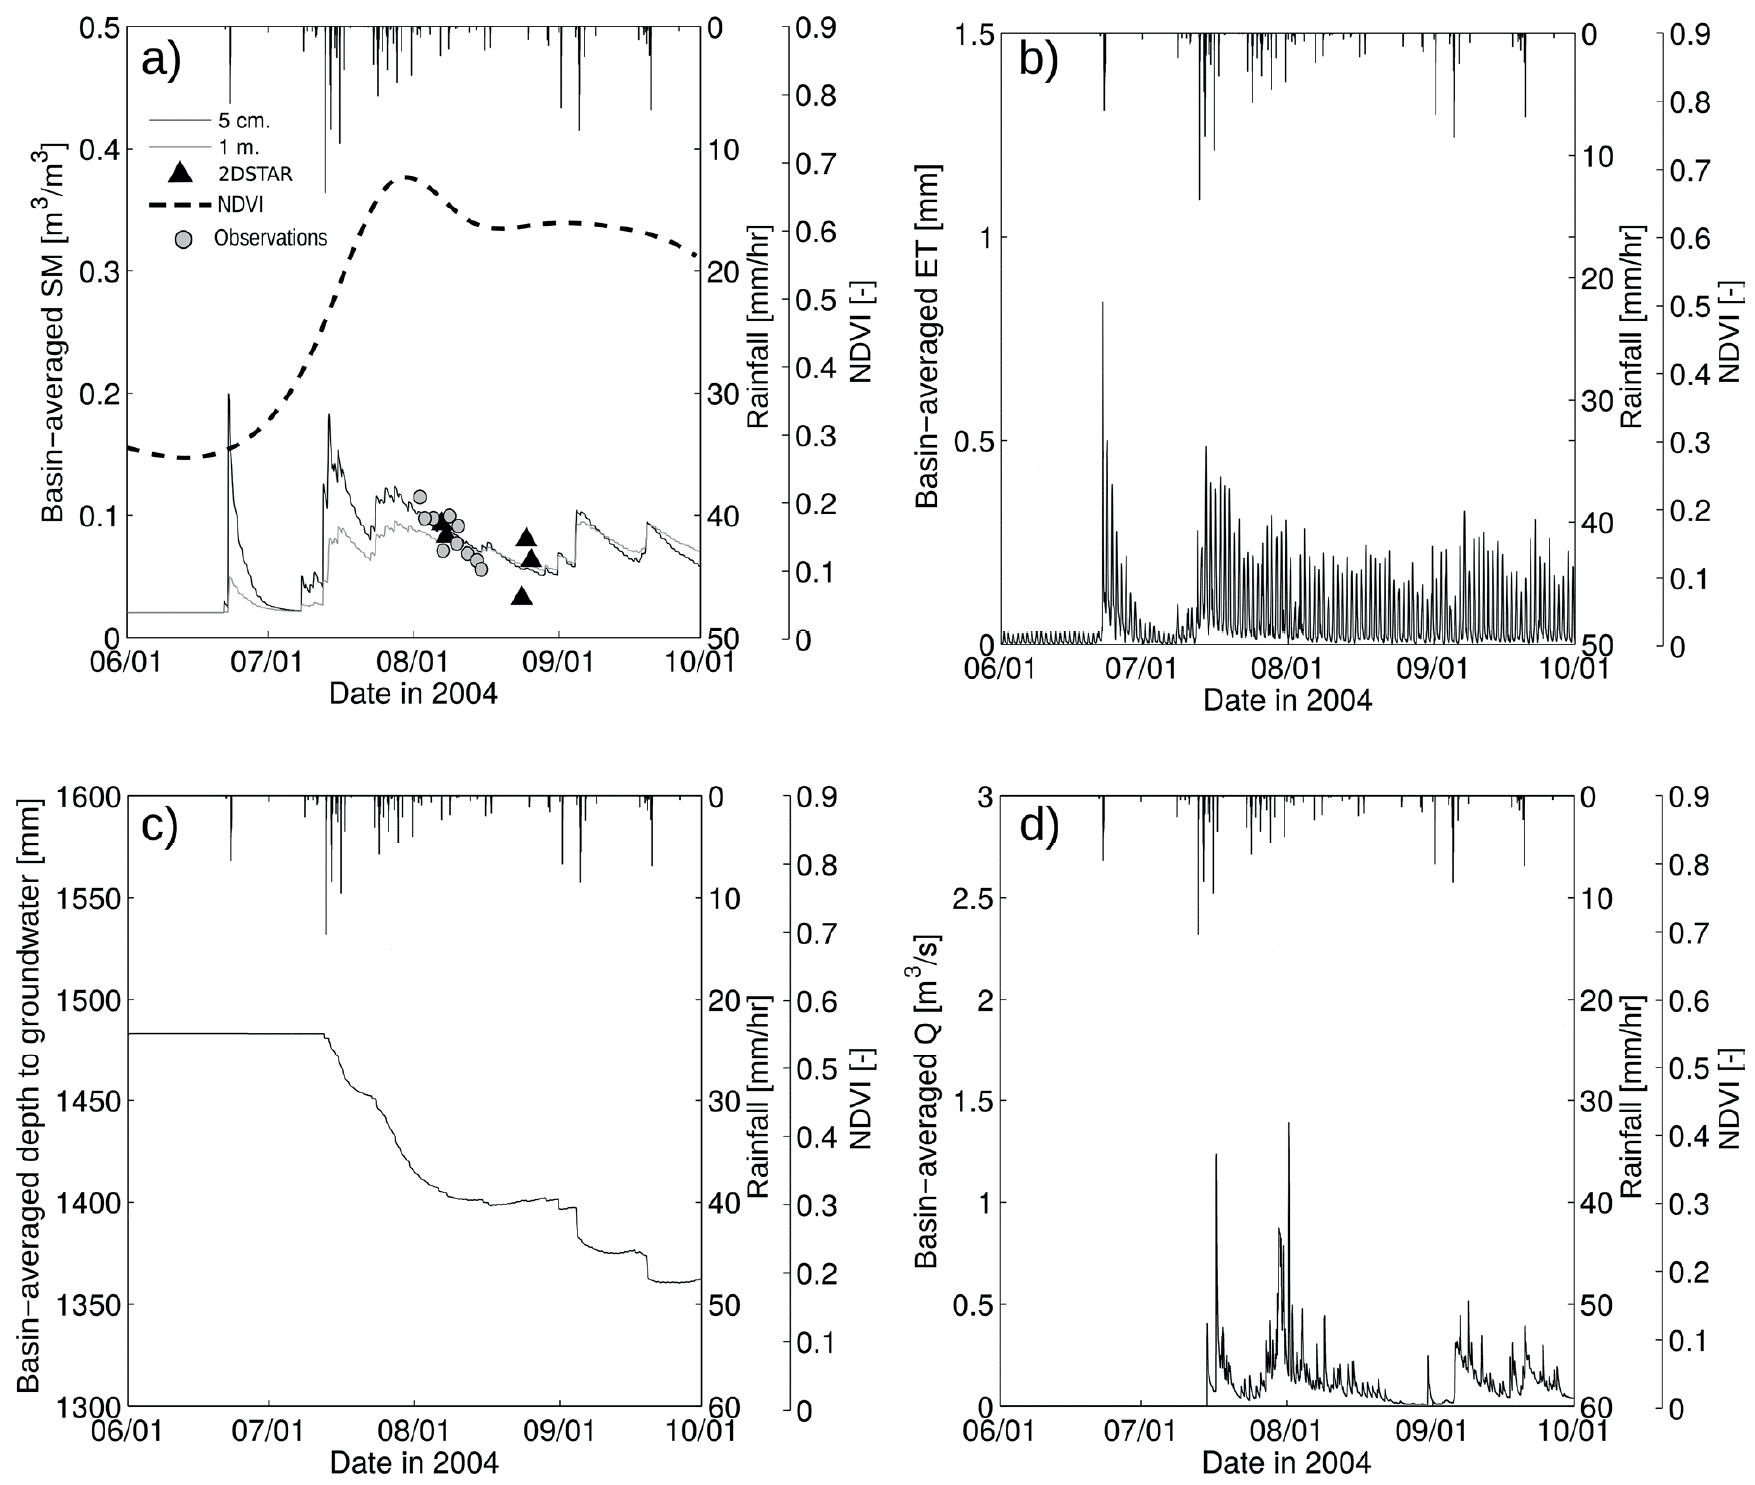
Figure 4 Basin-averaged water balance components during study period (after 1 month spin-up, June 1 to September 30, 2004). (a) Volumetric soil moisture (SM, m3/m3) for 5-cm and 1-m depth averages as compared to remotely-sensed 2D-STAR product and ground observations. (b) Evapotranspiration (ET, mm/hr). (c) Depth to the groundwater table (Nwt, mm). (d) Streamflow at the basin outlet (Q, m3/s). Basin-averaged NDVI and rainfall (mm/hr) are shown in all panels.
As the NAM season begins in late June, basin-averaged conditions moisten considerably, as shown by higher SM in the surface soil and root zones, a shallower Nwt, a higher ET and the production of runoff that is observed as Q at the basin outlet. Initially, the hydrologic response is of a pulsed nature due to the dry conditions prior to the NAM and the short duration of the first rainfall events. Nevertheless, the long sequence of consecutive storms in July lead to a system that is seasonally-wet with steady amounts of SM, ET and Q. This behavior is interrupted by a long dry period in August with a decrease in SM, a stabilization of Nwt, a sharp reduction of Q and a small decrease in ET. These dry-down conditions due to the absence of rainfall events were also reflected in the vegetation response within the basin where the basin-averaged NDVI slightly decreased and stabilized (Vivoni, 2012). Continuous water losses to evapotranspiration in the watershed eventually lead to drier conditions in the surface soils and root zone. As this hydrologic process is taking place, the lateral redistribution of water through hillslopes results in a downstream shift of soil moisture towards valley bottoms (Vivoni et al., 2007a). Overall, we would expect that the spatial distribution of hydrologic states and fluxes during the wetting and drying cycles should depend on the patterns of soil thickness and texture as these have a control on the ability of a soil to store and transmit water to evapotranspiration and lateral redistribution.
Sensitivity of basin-averaged ET and runoff to soil thickness and texture
We evaluated the twenty-two simulations representing different soil thickness and texture distributions (Table 1) with respect to the major water losses in the SLL watershed, specifically the basin-averaged ET and runoff. Figure 5 presents the cumulative water losses (mm) during the 2004 summer season (June 1 to September 30) for seventeen of the cases, selected to represent the full range of simulated conditions. Two cases with uniform soil texture (UB+Sa, UB+lSa) and three cases with shallow, uniform soil thickness (U+I, U+S, U+A) were excluded due to similarities to other results. Basin-averaged ET (Figure 5a) showed a range of ~100 mm among the cases when accumulated over the study period with the uniform soil texture simulations defining the upper (UB+Sacl, sandy clay loam) and lower bounds (UB+Sal, sandy loam). This indicates that soil texture exhibited a stronger control than soil thickness on the basin-averaged ET magnitudes, as expected from the effects of particle size on infiltration and water retention in soils (e.g., Noy-Meir, 1973; Sala et al., 1988; Rodriguez-Iturbe et al., 1999; English et al., 2005). Soils with finer fractions (sandy clay loam) have more water availability, which enhances ET as compared to coarser soils (sandy loam). In a similar fashion, the soil thickness distributions that promoted higher water availability associated with spatial gradients in terrain curvature (CU) and in topographic index (TI), such as H+S and G+S, also had greater ET accumulations over the season. Different combinations of soil thickness and texture maps could yield either seasonal ET amounts that exceeded or were less than the benchmark (B) case.
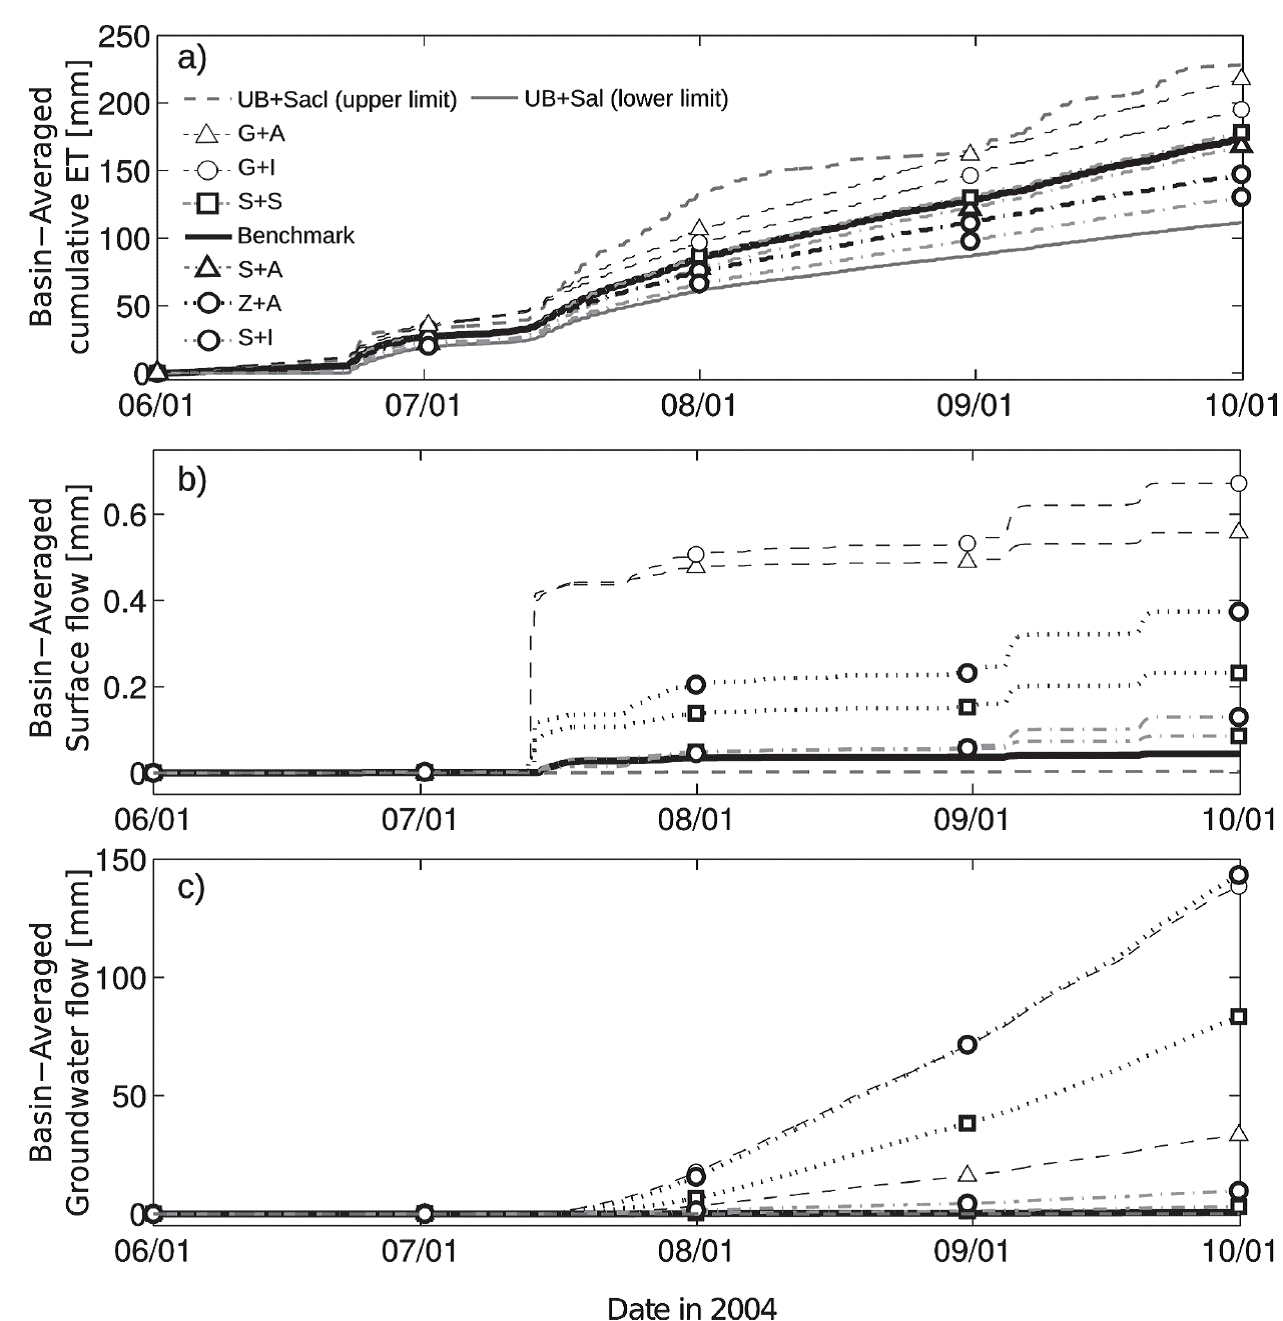
Figure 5 Basin-averaged cumulative water losses for a subset of the simulations which include: UB+Sal (1.5 m soil thickness + uniform sandy loam soil), UB+Sacl (1.5 m soil thickness + uniform sandy clay loam), G+A (variable soil thickness G-95 + ASTER-based texture), G+I (variable soil thickness G-95 + INEGI-based texture), S+S (variable soil thickness SS-97 + slope-based texture), model benchmark (Xiang et al., 2014), S+A (variable soil thickness SS-97 + ASTER-based texture), Z+A (variable soil thickness SZ-97 + ASTER-based texture), and S+I (variable soil thickness SS-97 + INEGI-based texture). (a) Evapotranspiration (ET, mm). (b) Surface runoff (mm). (c) Groundwater runoff (mm).
Figure 6 shows this through a subset of simulations where either the soil thickness (Z+S, S+S, H+S, G+S) or the soil texture was varied (UB+Sal, UB+Sacl, UB+Sa, UB+lSa, UB+I, UB+A), while the other factor was kept constant. The bias (or percent difference) of the basin-averaged ET between each simulation and the benchmark is shown. Basin-averaged ET was consistently larger in the soil thickness simulations as compared to the benchmark case with a uniform 1.5 m soil depth, indicating that spatially variable soil depths lead to higher wetness. We also found that the differences between the soil thickness cases and the benchmark were statistically significant (t-test analysis) for the basin-averaged ET for three of the four cases (Table 5). In contrast, the soil texture simulations might have higher or lower ET than the benchmark case, depending on the dominance of coarse (sand) or fine (sandy clay loam) texture.
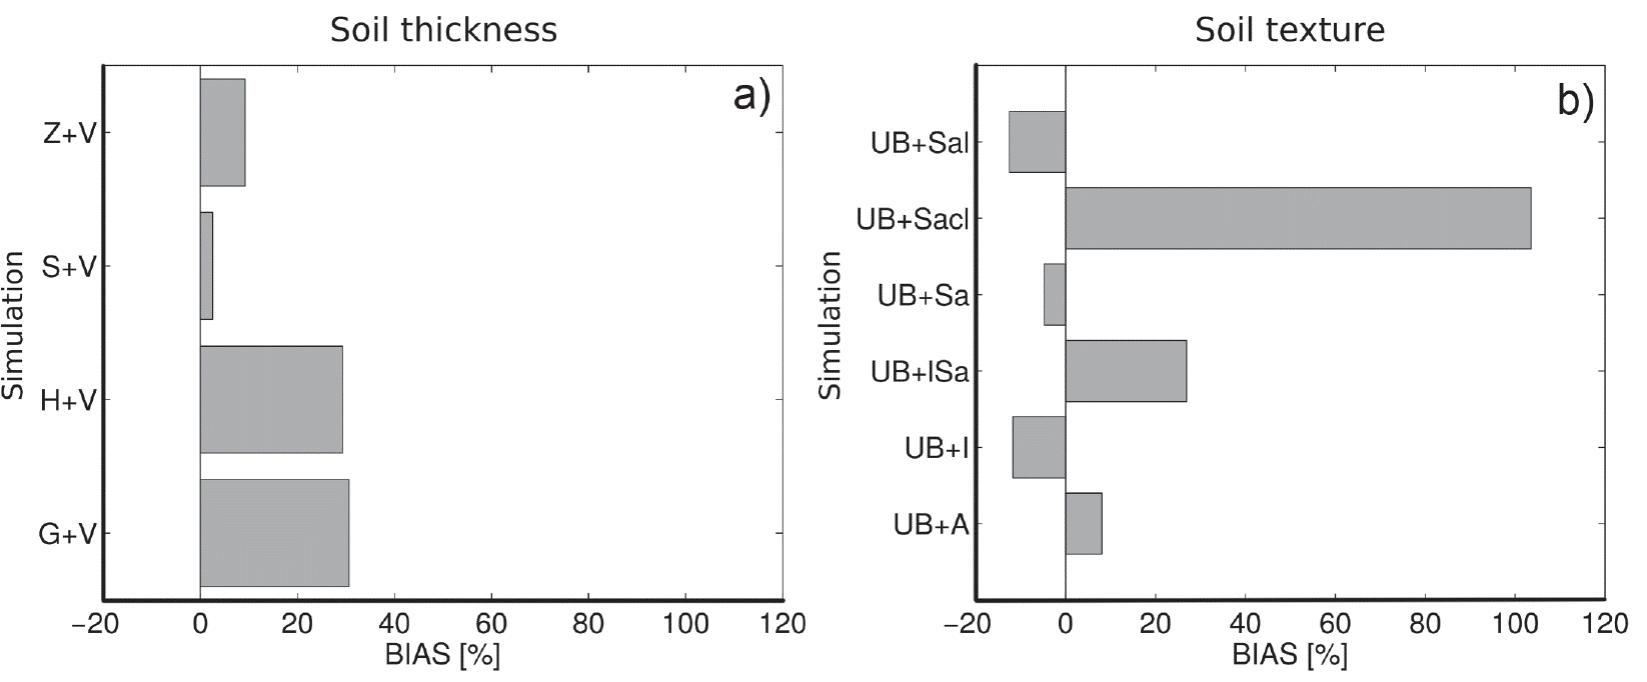
Figure 6 Bias (%) between each simulation and benchmark for basin-averaged evapotranspiration. (a) Simulations with different soil thickness and same soil texture. (b) Simulations with different soil texture and same soil thickness. Table 1 defines the simulation IDs.
Table 5 Results of t-test evaluating the statistical significance of the differences between evapotranspiration (ET) and streamflow (Q) simulated by varying the soil thickness and the ET and Q simulated by the benchmark case. p-values are reported along with the statistical significance indicated as highly significant (****), significant (**) and not significant (-).
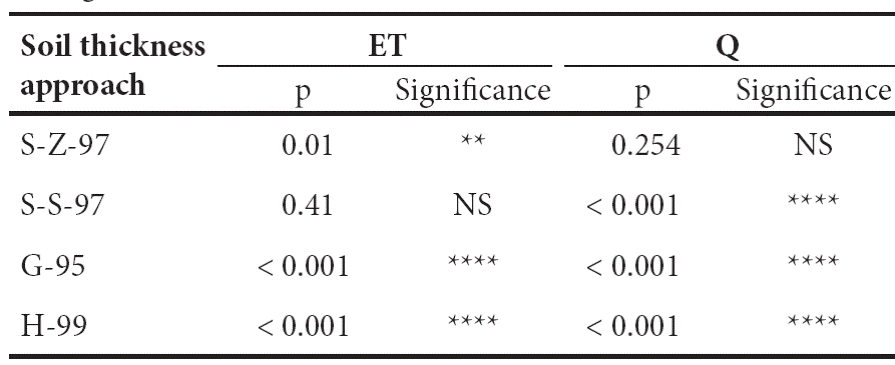
Runoff losses shown in Figure 5 are separated into surface runoff (infiltration-excess and saturation-excess runoff, Figure 5b) and groundwater runoff (perched return flow and groundwater exfiltration, Figure 5c) mechanisms (Ivanov et al., 2004; Vivoni et al., 2007b). The specification of soil texture and thickness distributions has a marked impact on cumulative runoff, in particular for the groundwater component. In most simulations, the benchmark case exhibited lower cumulative surface and groundwater runoff, indicating that both soil texture and thickness play an important role. For the soil thickness distributions that involved spatial gradients in CU and TI (e.g., G+I, H+I), the sharp changes in the soil depth caused significant increases in groundwater runoff. This is consistent with work on the role played by the soil-bedrock interface on lateral soil water redistribution and subsurface runoff production (e.g., Tromp-Van Meerveld and McDonnell, 2006; Weiler and McDonnell, 2006; Lanni et al., 2013). In particular, depressions in the soil-bedrock interface, observed here as thicker soils, can sustain wetter soil conditions through a temporarily perched groundwater table and act as impedance for downslope drainage (Lanni et al., 2013). This was corroborated by differences between the soil thickness distributions and the benchmark case (Table 5), where the three approaches with large spatial variability (S-S-97, G-95, H-99) resulted in highly statistically significant differences of streamflow at the basin outlet, whereas the smoothly-varying case (S-Z-97) was indistinguishable from a uniform soil depth.
Spatial patterns of surface soil moisture and evapotranspiration
Next, we evaluated the role of spatially-variable soil thickness and soil texture on the spatial patterns of surface soil moisture (top 5 cm, SM) and evapotranspiration. Three soil thickness and two soil texture distributions were selected for comparison to the benchmark simulation: (1) the soil thickness cases had contrasting spatial distributions (G-95, S-Z-97, uniform at 1.5 m) and (2) the soil texture maps represented the more realistic cases (Slope-based, ASTER-based). Figure 7 presents spatial maps of surface SM, expressed in dimensionless units as degree of saturation (volumetric SM divided by soil porosity), for the benchmark, G+S, Z+S and UB+A cases. Simulations that shared the same soil texture map (Slope-based in benchmark, G+S, Z+S) exhibited similar patterns of time-averaged surface SM. Wetter conditions were found in sandy clay loam soils in floodplain areas, moderately wet conditions matched sandy loam locations, and sand and loamy sand soils were drier sites in the watershed. Nevertheless, the range of soil moisture varied considerably among these cases due to the effect of the soil thickness distributions. For example, the G+S simulation exhibited high relative SM values due to the effect of the varying soil depth on soil water accumulation within depressions at the soil-bedrock interface. In contrast, the simulation with a different soil texture map based on ASTER (UB+A) exhibited surface SM patterns that varied widely from the other cases. Here, the low amounts of areas with sandy clay loam limit the occurrence of wet soils and the spatial differences closely follow the soil texture map. For a uniform soil depth, comparison of the benchmark and UB+A cases demonstrates the strong overriding control of surface soil texture on the relative SM within shallow soil layers.
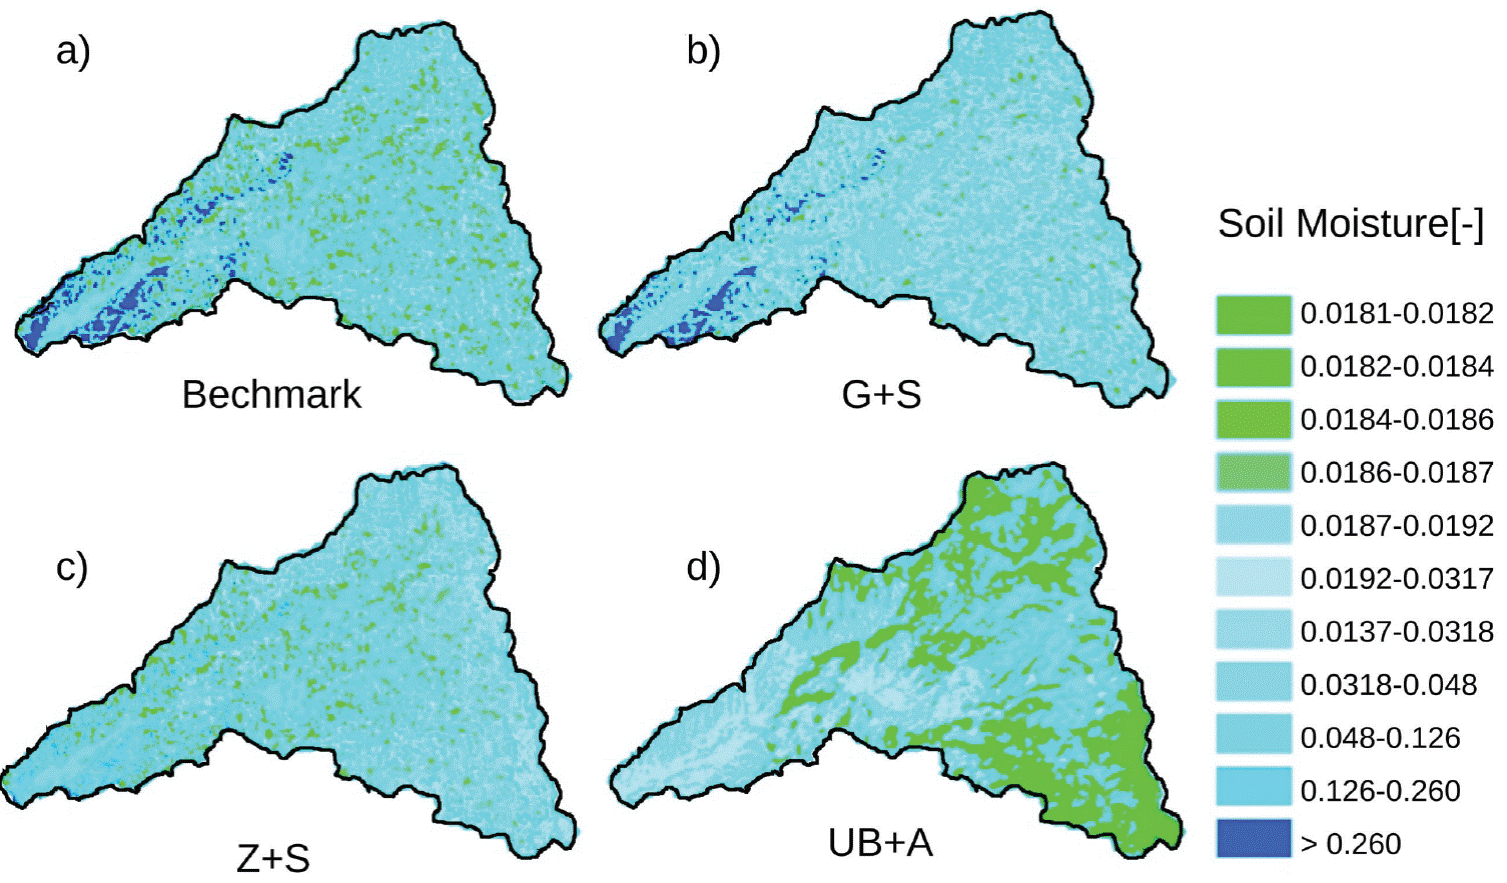
Figure 7 Comparison of selected simulations of relative surface soil moisture (SM, dimensionless, top 5-cm) for the benchmark (a), G+S (b), Z+S (c) and UB+A (d) cases. The maps represent the time-averaged soil moisture during the study period (June 1 to September 30, 2004).
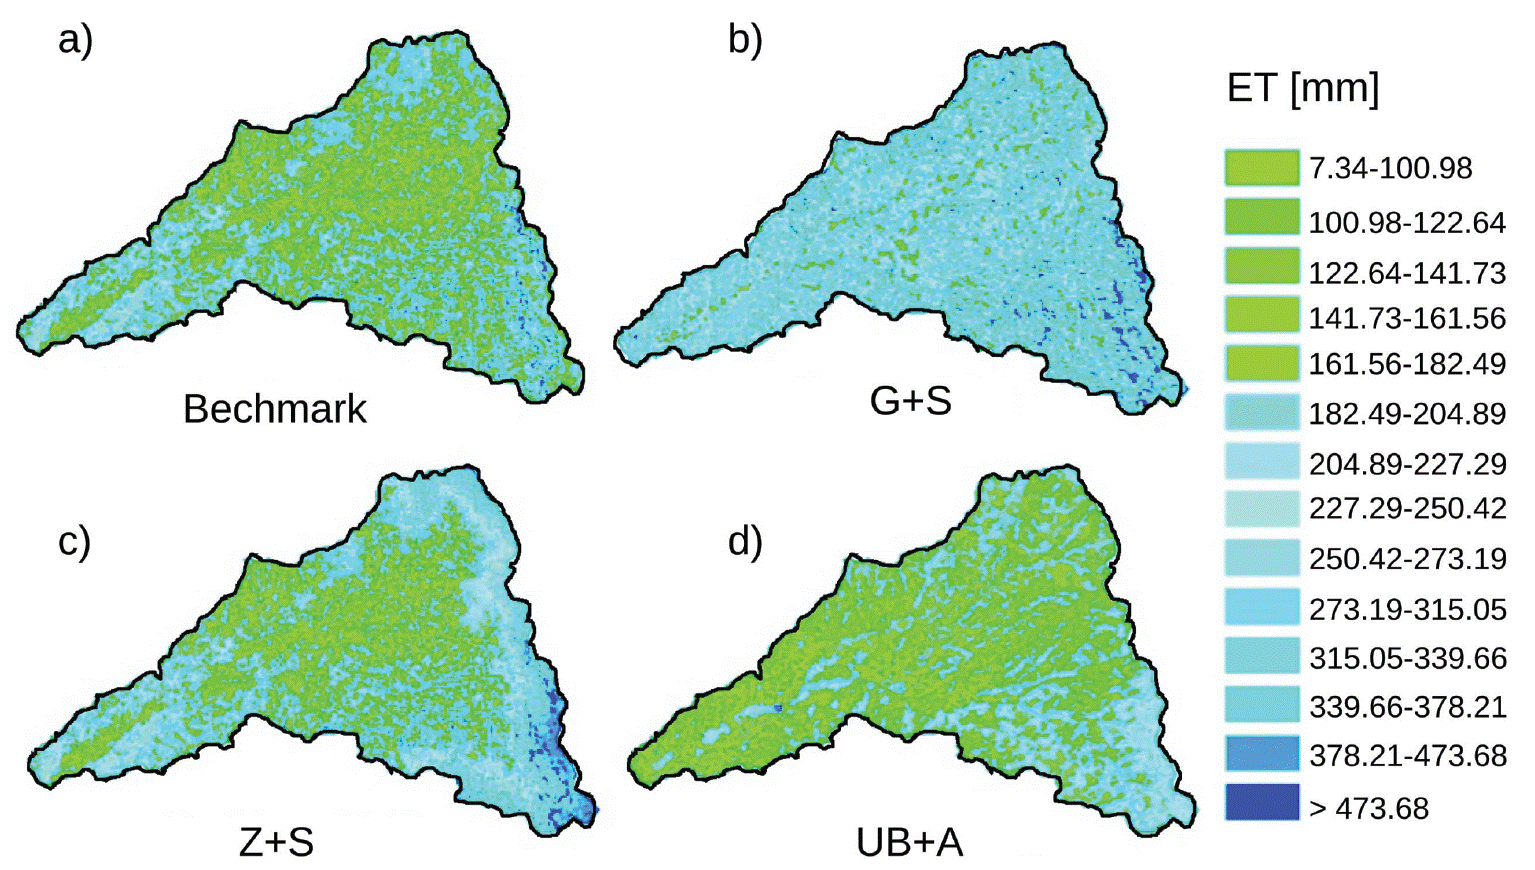
Figure 8 compares the spatial patterns of seasonal ET (mm) accumulated during the study period for the benchmark, G+S, Z+S and UB+A cases. A detailed comparison between the benchmark, G+S and Z+S cases (similar Slope-based method for soil texture, different soil thickness distributions) reveals that soil thickness has a very distinct impact on ET. High seasonal ET values are observed in locations with thinner soils which coincide with high elevations for the Z+S approach and with ridges for the G+S approach. Soil texture distributions also matter as there is a substantial difference in seasonal ET between the two uniform soil thickness cases (benchmark, UB+A), with a lower amount of ET for the case with coarser soils (UB+A). Clearly, there is a complex interplay at work between the soil thickness and soil texture distributions that lead to a wide range of spatial patterns within the SLL basin on seasonal surface soil moisture and evapotranspiration.
SUMMARY AND CONCLUSIONS
Assessing the spatial controls on the hydrologic response of semiarid watersheds is important for determining the level of detail required in the representations of terrain, vegetation and soil conditions used in process-based hydrologic models. While it is well known that specifying accurate soil depth and texture maps in distributed hydrologic models are important, these are some of the highest sources of uncertainty currently present in the hydrologic modeling process. Thus, advances in digital soil mapping through either terrain analyses or remotely-sensed indices are an important avenue of research activities. In this study, we derived a range of soil thickness and texture distributions using local terrain attributes, remotely-sensed radiance values and ground-based observations to obtain a set of plausible modeling scenarios for evaluating the sensitivity of the watershed response. We selected the Sierra Los Locos (SLL) watershed in northwest Mexico due to our prior efforts with the tRIBS distributed hydrologic model in this basin and the field observations that suggested a strong spatial variability in soil thickness and soil texture associated with terrain conditions.
The sensitivity analysis conducted with the various combinations of soil thickness and texture patterns revealed a strong sensitivity of the surface soil moisture, evapotranspiration and runoff in terms of their seasonal magnitudes and spatial distributions. Based on the evaluations with respect to the field samples (e.g., soil pits and surface soil samples), we determined that the remotely-sensed soil texture map (ASTER-based) and the soil depth patterns using curvature and/or topographic index (G-95, H-99) were superior to other methods. Thus, a focus was placed on comparing different combinations that accounted for these improved products in light of the demonstrated model performance for the benchmark case. We found that the role played by soil thickness was related to the creation of spatial gradients (e.g., depressions at the soil-bedrock interface) that affected the accumulation of soil water, its consumption by evapotranspiration and the generation of subsurface runoff. The filling and spilling of soil depressions was particularly important when the downstream locations had shallow soils. The role of soil texture was to set the baseline conditions for soil moisture patterns which impacted the generation of surface and groundwater runoff and the evapotranspiration process. In this seasonally wet system, we also identified that the influence of soil texture decreases in time, while the spatial control of soil thickness becomes more important in determining the spatial variations of soil moisture and evapotranspiration. Other semiarid watersheds in northwest Mexico are thus expected to be more sensitive to the spatial distribution of soil texture prior to the NAM and to the terrain-mediated patterns of soil depth during the progression of the monsoon season.

