


 nova página do texto(beta)
 Inglês (pdf)
 Artigo em XML
 Referências do artigo
 Enviar este artigo por email
 Citado por SciELO
  Similares em
SciELO
Similares em
SciELO 
 Permalink
INTRODUCTION
Remote sensing has been successfully used over the last 40 years to estimate water quality worldwide (Dekker and Peters, 1993; Baban, 1993; Cheng and Lei, 2001; Tyler et al., 2006; Chang et al., 2014;). Multispectral image processing applications are based on the modification of the water optical properties associated with turbidity related to the presence of suspended particles as well as Chl-a enrichment (Jensen, 2000; Ritchie et al., 2003). Monitoring water quality in a large lake by direct sampling is costly and does not cover the entire area at the same time. In contrast, remote sensing provides continuous spatial coverage of multispectral data over the complete geographic area of the water body. This areal determination of relevant parameters generates synoptic and significant information on water quality to facilitate decision-making for basin management and proper regulation of the water entering the lakes from the tributaries (Brezonik et al., 2005; Fuller and Minnerick, 2007; Pavelsky and Smith, 2009; Usali and Ismail, 2010).
The main pollutants from agricultural activities including nitrogen and phosphorous are nutrients that promote primary productivity and cause eutrophication in the long term. Eutrophic lakes exhibit poor water quality unsuitable for freshwater supply, human health, fisheries and recreation (Hammer and Mackichan, 1981); therefore, it is necessary to perform a continuous evaluation of the trophic state of a lake that is used as a water supplier.
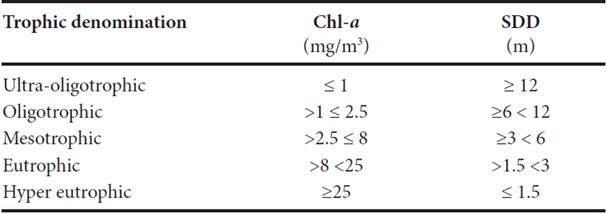
The scale used to define eutrophication has been adapted to diverse local conditions. Table 1 shows the trophic state denominations based on values of chlorophyl-a concentration (Chi-a) and Secchi disk depth (SDD) as suggested by Harper (1992). Carlson (1977) proposed the calculation of an index to give a numerical scale to evaluate the trophic state of a water body (Carlson's Trophic State Index - CTSI) by measuring tubidity and Chl-a concentration. CTSI is calculated based on empirical relationships between SDD, Chl-a and TP. These empirical relationships are local properties defined for environments similar to Carlson's study area; therefore, CTSI should be modified according to the specific local environmental parameters (Cheng and Lei, 2001; Sheela et al, 2011a). In this study, we performed a model callibration to calculate the local Chapala parameters to be used in the CTSI.
Table 1 The Organisation for Economic Cooperation and Development (OECD) boundary values for denomination of the trophic state in a water body (after Harper, 1992).
Lake Chapala supplies freshwater to Guadalajara, which is the second most populated city in Mexico. However, diverse human activities in the drainage basin (urban development, agriculture and industry) have deteriorated the water quality. The increasing freshwater demand from Guadalajara has raised awareness of freshwater protection; therefore, the Mexican government has implemented a monitoring program to preserve, restore, protect, and sustainably use the water resources in the Lerma-Chapala Basin (SEMARNAT, 2005). As a result, the government launched a program in 2005 to regulate the water use and the disposal of potentially polluting pro ducts (mainly from agricultural activities). However, regulations have to be enforced to be successful (Cotler et al, 2006). In addition to the new regulations of waste water disposal, the authorities tried to control the growth of the dense роpulаtion of aquatic weeds that covered large areas of the lake through the intense use of defoliants-mainly glyphosate (SEMARNAT, 2006).
Lake Chapala has shown eutrophication problems since 1989 as a result of the Lerma-Chap ala watershed drainage, which hosts intense industrial, agricultural and domestic activities (Fernex et al, 2001). These activities generate waste with high nutrient concentrations to pollute surface waters (Waite, 1984). Since 1983, reports have indicated that Lake Chapala presents increasing chlorophyll concentration going from upper-mesotrophic to eutrophic (Limón and Lind, 1990, De Anda and Shear, 2001, Dávalos-Lind and Lind, 2001, Lind et al, 1997). Since 2005, diverse eutrophication control programs have been implemented with unclear results. There is an urgent need to develop low-cost evaluation strategies that can be easily executed to monitor the trophic state of Lake Chapala.
In this study, we propose to prove the effectiveness of applying remote sensing techniques as a fast, low-cost, and accurate method to estimate Lake Chapala’s trophic state. Image processing includes mosaic construction, spatial enhancement, reflectance calculation and band ratio. Calculation of turbidity and Chl-a concentrations for all pixels within the lake was done by linear regression of satellite multi-spectral image data with field truth measurements.
STUDY AREA
Lake Chapala is located in the western part of central Mexico (20°06’36’’-20°18’00’’ North, 102°42’00’’-103°25’30’’ West, 1520 m above sea level) in the Lerma-Chapala Basin (Figure 1), which drains an area of 53,591 km2. Lake Chapala has an area of about 1100 km2. Its larger axis has an East-West orientation with a maximun length of 77 km, and its smaller axis has a length of 22 km. The average depth varies between 4-7 m. (Trujillo-Cardenas et al., 2010). The annual inflow of Lake Chapala is 1162 Mm3yr-1 (precipitation: Mm3yr-1; inflow of watershed: 178 Mm3yr-1 and rivers input 273 Mm3yr-1). The annual output is 1666 Mm3yr-1 (evaporation: 1394 Mm3yr-1; pumping and Santiago River: 272 Mm3yr-1). Therefore, the Lake Chapala is overexploited (Aparicio, 2001). Its main tributary is the Lerma River with a longitude of 705 km. Two large cities, Guadalajara and Mexico City, have a strong influence on the basin hydrology due to their intense economic activities and large freshwater requirements (Cotler et al., 2006).
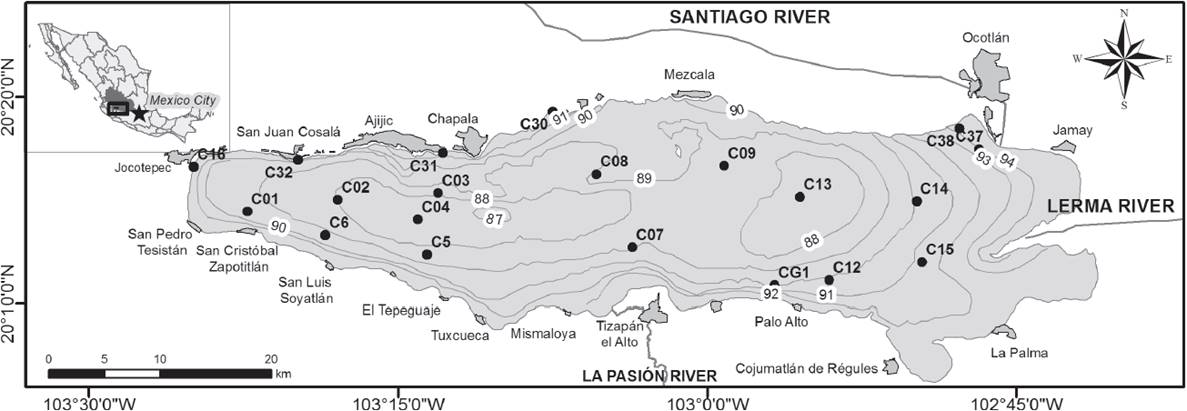
Figure 1 Location of the study area and sampling sites for the ground truthing. The light gray lines show bathymetry (Filonov et al., 2001) where 97.8 is the maximum storage capacity. The dark grey area in the inset map indicates the Lerma-Chapala Basin.
Lake Chapala lost part of its original surface area in 1905 when the shallow littoral area of the eastern section of the lake ("Ciénega de Chapala") was converted into agricultural land. The lake shrank 500 km2 and lost 856 x 106 m3 of water (Sandoval, 1994). The lake has experienced additional water level reductions (up to 42% of the total volume) due to intense water extraction and long dry periods. The volume reduction has worsened the effect of the wastewater and nutrient input by the tributaries (Lind and Dávalos-Lind, 2002). Previous reports on nutrient content, Chl-a concentration turbidity of the lake and total phosphorus indicate diverse CTSI values: (CTSI(TP)) = 94 based onTP, Trophic State Index from Chl-a (CTSI(Chl-a)) = 56 and Trophic State Index from SDD (CTSI(SDD)) = 71. These values show that at least for the last 25 years, Lake Chapala has been eutrophic (Limón and Lind, 1990, Lind and Dávalos-Lind, 1991, Lind et al., 1997, De Anda et al., 1998, Dávalos-Lind and Lind, 2001, De Anda and Shear, 2001).
METHODOLOGY
Image processing
Four SPOT-5 multispectral images (579/309, 579/310, 580/309, 580/310, column and row of SPOT grid reference system) collected in January 19th and 24th 2013 were merged in a mosaic to cover the entire lake area. The sky was clear on January 19th to 24th. The SPOT images have good spectral and spatial resolution for chlorophyll studies (Chacon-Torres, et al., 1992). The images were processed with ArcGIS® and ENVI Software®. The images were georeferenced and corrected using ENVI FLAASH atmospheric correction module.
Spatial enhancement using kernels (Lillesand et al., 2008) was applied to the mosaic to create a mask to suppress the land outside the lake and limit the analysis to the water body. Turbidity (inverse of SDD) was estimated with reflectance values in SPOT band S2, and spectral enhancement was performed using band ratio (SPOT bands S3/S2) to identify Chl-a based on its spectral signature (Ritchie et al., 1990; Kloiber et al. 2002; Duan et al., 2008; Gitelson et al., 2008; Chen et al y 2009; Pottes et al., 2011). Estimation of turbidity for the whole turbidity for the whole in SPOT band S2 with SDD field measurements. The concentration of Chl-a in the lake was calculated using the linear regression of the ratio water samples. This empirical method has been applied regularly to quantify water quality parameters in lakes using reflectance from satellite multispectral images (Chang et al., 2014). Nonlinearity has been generally observed between Chl-a concentration, turbidity and sensor reflectance; however, linearity can be achieved by applying the natural logarithmic transformation to the measured parameters (Moore, 1980; Collins and Pattiaratchi, 1984; Lathrop et al., 1991; Harrington et al., 1992, Xia, 1993).
The linear regression model used in this study is (1):
 1
1
In this equation, Y is In (Chl-a) in [mg/m3] and Xis the SPOTS3/S2 ratio. In a similar way to chlorophyll determination, turbidity (defined by SDD) can be used in a linear regression model with reflectance values measured in SPOT S2 in an inverse relationship (Choubey, 1998). Here, the variables in equation (1) are defined as Y= In (SDD) in meters, and X is reflectance in S2.
Ground truth
A sampling campaign was carried out on January 24th to 26th 2013, to relate reflectance with water quality parameters: turbidity and Chl-a concentration. The campaign was done within four days of the image acquisition. This is the time span considered adequate to obtain statistically significant models (Li and Li, 2004). The 20 sampling sites were located throughout the lake (Figure 1). The number and location of the sampling sites were selected based on the results of the previously obtained seasonal changes in the spectral response of turbidity and Chl-a concentration in the lake (Membrillo-Abad et al., 2013). Sampling sites were selected using a stratified random method to confirm that all water classes identified in Membrillo-Abad et al, (2013) were sampled (clear, turbid and Chl-a-rich water). The water sampling depth at each site was established by measuring SDD because this depth defines the information that will be detected by the satellite sensor. A Niskin bottle was used for water sampling when SDD was greater than 30 cm. The pH and temperature were measured with a multiparameter OAKTON® as the standard procedure for water sampling.
In addition, GPS information was collected regarding the presence of macrophytes in the lake (mainly water hyacinth and cattails). This allowed extraction of those areas from the linear regression model.
Chlorophyll analysis
Water samples were transported to the laboratory in cold and dark conditions and then filtered through GF/F Whatman filters (13 mm diameter, 0.7 μm pore aperture) to determine Chl-a. The pigment was extracted over 18 h in 90% acetone while being kept in a cold and dark place. The Chl-a was measured in a Turner Designs 10-AU fluorometer (EPA method 445.0, Arar and Collins, 1997) that was calibrated annually with pure Chl-a as well as during each field trip with a commercial secondary standard.
CARLSON S TROPHIC STATE INDEX
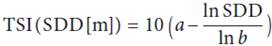
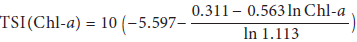
The conventional classification of the trophic state (Sheela et al., 2011b; Harper, 1992) indicates that a lake is oligotrophic, mesotrophic or eutrophic if any of the relevant parameters is above the established limits (turbidity defined by SDD, chlorophyll concentration and total phosphorus). Carlson (1977) suggested the index as a numerical scale to assess the trophic state and proposed three equations based on those parameters. We used Carlson's equations (1977) to calculate the trophic state of Lake Chapala with the values of SDD (Equation 2) and Chl-a concentration (Equation 3): Trophic State Index based on turbidity (TSI(SDD)) and Trophic State Index based on Chl-a concentration (TSI(Chl-a)):
 2
2
 3
3
To calculate the TSI for the entire lake, we used input values obtained by the linear regression between SDD and Chl-a data obtained from the ground truth work and the reflectance measured in band S2 and the ratio S3/S2 of the SPOT images, respectively. TSI determination for the whole lake using the reflectance of satellite images allowed computation of the area that corresponds to each trophic state by determin ing the number of pixels classified within any particular range.
MODIFIED TROPHIC STATE INDEX FOR LAKE CHAPALA
The CTSI model was developed for temperate lakes, and Cheng and Lei (2001) suggested that the index should be adapted to the studied aquatic system; Cunha et al., (2013) applied the same idea for tropical lakes. These results as well as Sheela et al. (2011a) show that linear regression can analyze the relationship between SDD and Chl-a in Lake Chapala (Equation 4) similar to what was done for tropical water bodies by Sheela et al. (2011b):
 4
4
The obtained generalized expression of CTSI is:
 5
5
 6
6
where a and b are a scale factor, and ba is a range factor
SDD: Secchi Disc Depth in m,
SDDmax: specified maximum value for SDD
TSI (SDD): Trophic State Index based on Secchi Disk Depth.
Combining Equation 4 and TSI developed by Carlson (1977) we find:
 7
7
In our study, Chapala Lake presents a maximum Chl-a concentration of 33.5 mg/m3; therefore
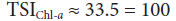 8
8
In Chapala Lake, the average SDD is 0.55 m. Solving Equations 5 and 7:

The modified CTSI model for the Chapala Lake is:
 9
9
 10
10
RESULTS
Field and laboratory data
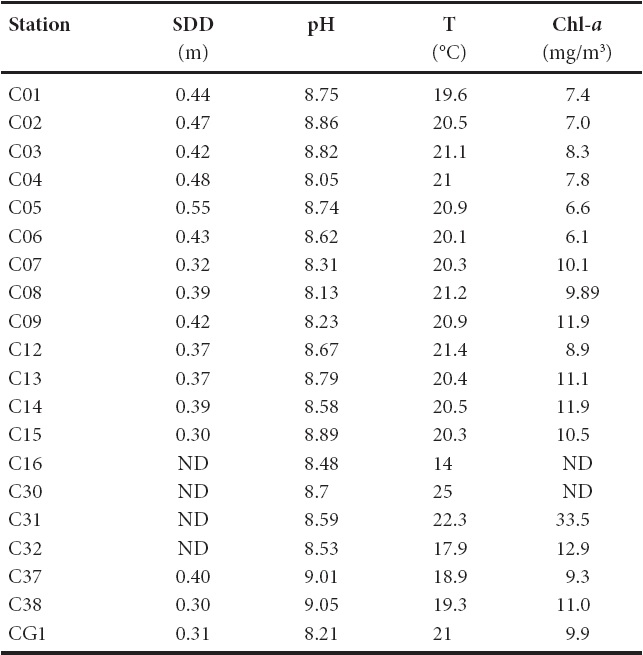
The results of the SDD field measurements and Chl-a concentration analyzed in the laboratory are presented in Table 2. Temperature and pH are fairly homogeneous with mean values of 20.3 ± 2.0 °c and 8.6 ±0.2, respectively. Sites from the littoral zone were so muddy that it was not possible to concentrate chlorophyll to reach detectable concentrations (i.e., the filters clogged with only a few mililiters of sample). The mean chlorophyll concentration is moderate (11. 7 mg/ m3) with a maximum of 33.5 mg/ Zm3. The SDD values vary within a narrow range throughout the lake-from 0.30 to 0.55 m-with most values between 0.37 and 0.44 m. The mean pH value is 8.6 ± 0.3, which indicates an alkaline lake with a mean temperature of 20.3 ± 2 °c.
Table 2 Parameters measured in the field and in the laboratory for 20 water samples, whose location is shown in Figure 1. SDD = Secchi disc depth, T = temperature, Chl-a = chlorophyll a concentration. *ND - No Data. (Shoreline sites were too muddy to sample water for Chl-a determination and the wind action prevented to measure SDD).
Linear regression
The Chl-a concentration and SDD for the whole lake were obtained by linear regression of the SPOT band ratio S3/S2 and reflectance in SPOT band S2 with the natural logarithm of the measured values for Chl-a [mg/ m3] and SDD [m], respectively. In Chl-a, the obtained constants for the best model are β 1 =4.287 and β 0=-0.079, and equation (11) was used to compute the Chl-a concentration in the whole lake based on the SPOT S3/S2 band ratio results:
 11
11
We used antilogarithm data calculated via equation (11) to create Figure 2 as the Chl-a concentration map of Chapala Lake. The Chl-a concentrations were determined for phytoplankton biomass because the field data produce only the concentration in the water column; therefore, this equation was applied only to areas where macrophytes (water hyacinth and cattails) were not present. These areas were 10-cated by GPS data collected during the ground truth campaign and are included in Figure 2 as the separate class "macrophytes".
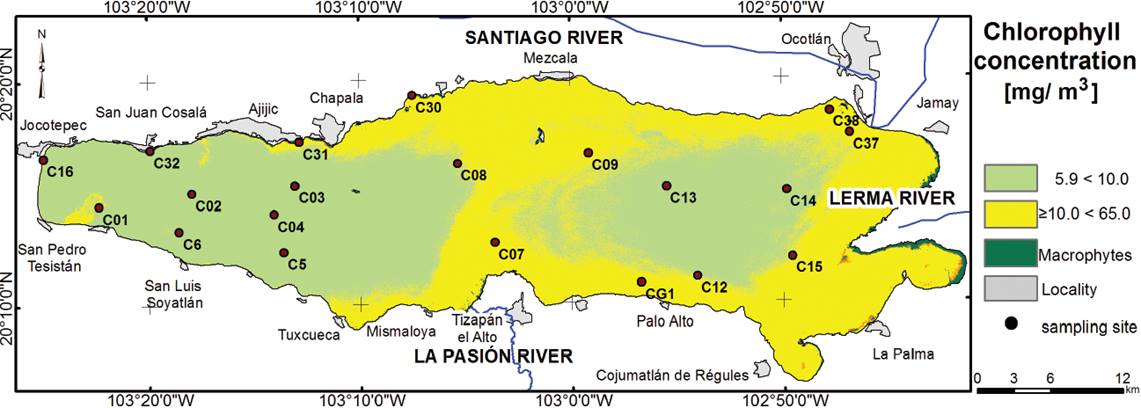
Figure 2 The Chl-a concentration (mg/m3), calculated from the SPOT B3/B2 ratio to enhance the spectral response of Chl-a, was only determined in areas where macrophytes (water hyacinth and cattails) were not present, as recorded from the ground truthing work. Those areas are labeled as class-macrophytes.
The calculated constants for equation (1) were applied to ln(SDD) and are β 1 =-2.678 and β 0 =0.99. They are utilized in equation (5):
 12
12
This equation was used to generate the SDD map for Lake Chapala that is shown in Figure 3.

Figure 3 Secchi disk depth (SDD) map for lake Chapala calculated using reflectance of SPOT B2 in a linear regression model. SPOT B2 information is the most suitable reflectance data to detect turbidity.
After equations (4) and (5) were applied to all pixels in Lake Chapala, the mean value obtained for Chl-a concentration is 11.7 ± 7 mg/m3 (r=0.7) and for SDD is 0.38 ± 0.04 m (r=0.8. In both cases p<0.05 which validates the results of the linear regression with a confidence level of 95%.
The calculated values for Chl-a and SDD for the whole lake allowed estimation of TSI using the modified equations (9) and (10) (Cheng and Lei, 2001 ;Sheela et al 2011a, Carlson, 1977). The TSI(Chl-a) and TSI(SDD) maps produced with Carlson's equations are shown in Figures 4 and 5. The mean value of TSI (Chl-a) is 42 with minimum and maximum values of 0 and 157. The mean value of TSI (SDD) is 34 with minimum and maximum values of 0 and 101.
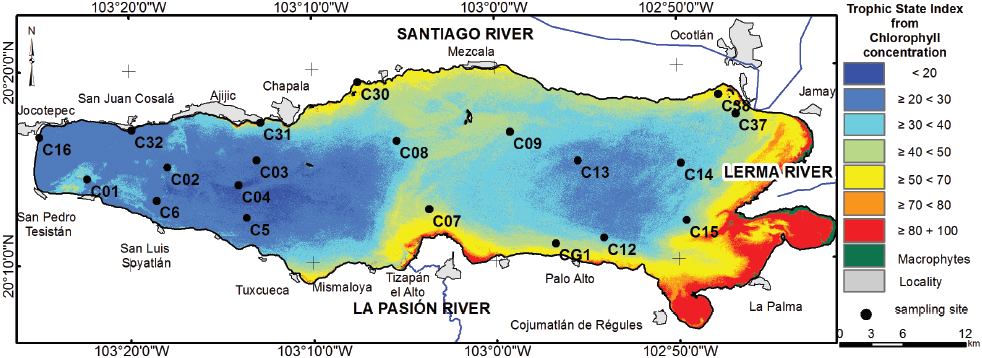
Figure 4 Trophic State Index (TSI) of lake Chapala calculated, using In Chl-a concentration values and modified equation (Equation 9).

DISCUSSION
The trophic state calculation for Lake Chapala in this work is based on the determination of two interrelated parameters of water quality: Chl-a concentration and SDD. The values of Chl-a and SDD were calculated for Lake Chapala using linear regression models with reflectance data from multispectral images. The results were input in the modified equations proposed by Chen et al. (2009) to calculate TSI. These regression models show a direct correlation between the SPOT bands S3/S2 ratio and the logarithm of Chl-a concentration and an inverse correlation for the logarithm of SDD values and reflectance in the SPOT band S2-lower SDD values imply higher reflectance and turbidity. In both cases, residual analysis shows that they comply with the linear regression and non-zero slope assumptions. The best regression models produced values for SDD and Chl-a concentrations with estimated errors of 11% and 27% respectively, and the confidence level obtained from the correlation equation is 95% for both cases. This supports the validity of the results.
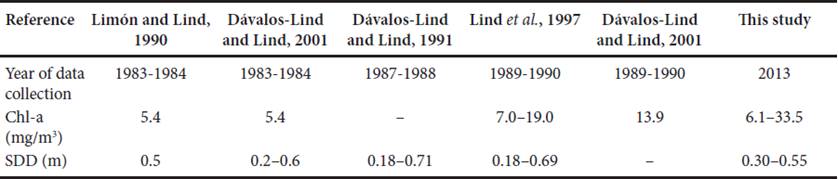
The calculated Chl-a content has a mean value of 11.7 mg/ m3 and SDD mean value of 0.38 m, and these values indicate that Lake Chapala has moderate concentrations of Chl-a. The water is turbid which confirms the previous information about the accelerated eutrophication (Limón and Lind, 1990, Lind and Dávalos-Lind, 1991, Lind et al., 1997, Dávalos-Lind and Lind, 2001) as shown in Table 3. Using the published data and denominations of trophic state from Table 1, it is clear that Lake Chapala has increased Chl-a content that has changed its trophic state from upper-mesotrophic (1983-1984) to eutrophic (1989-this study).
Table 3 Previous reports on nutrient content, Chl-a concentration and turbidity of the lake Chapala. The Chl-a values are evidence of eutrophication since 1989 while SDD shows eutrophication of the lake since 1983.
On the other hand, the modified model for TSI shows that the lake is mostly oligotrophic. The trophic indices calculated with both parameters generally yield similar values (±10 units TSI scale) (Baban, 1996, Duan et al., 2008); however, in the case of Lake Chapala the difference between TSI(Chl-a) and TSI(SDD) is 8 units on the TSI scale. Carlson (1980, 1983) suggests that the turbidity and chlorphyll indices can be used as evidence of the processes that are involved in eutrophication of a lake. In the case where both indices are similar, it maybe inferred that algae regulate light attenuation.
Phytoplankton production in Lake Chapala is governed by light attenuation from inorganic turbidity (Dávalos Lind and Lind, 2001), which explains the high inverse correlation between Chl-a and SDD. The common nutrients are present in high concentrations (N and p). In lakes with large nutrient loads such as Lake Chapala, the Chl-a concentration is strongly related to the amount of suspended sediments and turbidity. Lake Chapala is a shallow lake with a large input of suspended sediments; therefore, the results indicate that the specific TSI model for Lake Capala must be elaborated due to the shallow phytoplankton production and its interrelation with suspended sediments. (Lind et al., 1992; Schalles, 2006). These prior results indicate that Chl-a concentration is high in the shallow turbid areas in the lake, while the deeper and less turbid areas have much lower primary productmty. Statistical evaluation of the relationship between ln(SDD) and ln(Chl-a) concentration for measured points yields a high correlation between these two variables (r=-0.67; p<0.05). This reveals that a large part of the suspended particles are related to Chl-a concentration (Carlson, 1983).
Sheela et al., (2011b) suggested criteria for classification of trophic status for tropical lakes (Table 4) based on Chl-a concentrations and SDD. This evaluation of eutrophication was applied to the Lake Chapala data. The TSI(Chl-a) varies from 15 to 157 with a mean value of 42, which indicates the limit between the oligotrophic and mesotrophic state in the lake. The TSI calculation based on SDD values is in the range from 11 to 63, and a mean value of 34 points towards a oligotrophic state.
Table 4 Relation of Secchi disc depth (SDD), chlorophyll a concentration (Chl-a), trophic state index values (TSI), and traditional denomination of trophic state (Sheela et al., 2011b).
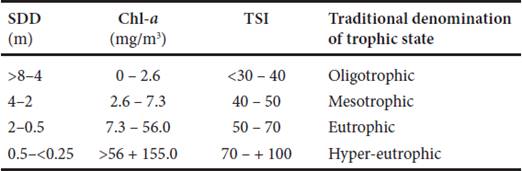
Figure 4 shows that TSI (Chl-a) is low in deeper areas of Lake Chapala. Higher TSI (Chl-a) values are present near Lerma River input. High TSI(Chl-a) is expected there due to high concentration of suspended sediments and its interaction with phytoplankton growth. The shoreline of Lake Chapala has high TSI (Chl-a) values as a result of cyclonic circulation in the northern part of the lake and anticyclone circulation in the southern side according to Filonov et al., (2001). The east part of Lake has higher values than the west part because these areas are affected by the input from the Lerma River (Figure 5)
Membrillo et al., (2013) calculated TSI using the Carlson model, and the results agree with the limits proposed by the OECD (1982) for an eutrophic lake and with the reported TSI values (Limón and Lind, 1990, Lind and Dávalos-Lind, 1991, Lind et al., 1997, Dávalos-Lind and Lind, 2001, De Anda and Shear, 2001). This is the expected result because the OECD has established the TS range based on data from water bodies with similar conditions to those studied by Carlson (1977).
The modified TSI results are different from that of Membrillo et al. (2013) and previous publications. The modified index indicates that Lake Chapala is oligotrophic to mesotrophic. This discrepancy demonstrates the need to develop specific methods to calculate the TSI depending on the particular conditions of the lake under study such as the one developed here.
CONCLUSIONS
TSI can be successfully monitored for the whole Lake Chapala using SPOT multispectral images and discrete field sampling to determine the actual values of relevant parameters including Chl-a content and turbidity by regression methods. The assumptions about the relation of reflectance (as measured via multispectral images) to turbidity and Chl-a content are valid as shown by the regression results. The calculated parameters can be used in the TSI equations to evaluate the trophic index of the whole lake for the dates when ground truth data were collected.
The modified trophic index calculated using the Chl-a concentration and SDD values for Lake Chapala shows that Lake Chapala TSI values range from oligotrophic to mesotrophic based on Chl-a concentration. Frequent monitoring of water quality can be done with remote sensing techniques and the model developed here.

