


Servicios Personalizados
Revista
Articulo
 Inglés (pdf)
 Artículo en XML
 Referencias del artículo
 Enviar artículo por email
Indicadores
-
 Citado por SciELO
 -
 Accesos
Links relacionados
-
 Similares en
SciELO
Similares en
SciELO
Compartir

 Permalink
Revista mexicana de ciencias geológicas
versión On-line ISSN 2007-2902versión impresa ISSN 1026-8774
Rev. mex. cienc. geol vol.30 no.3 Ciudad de México dic. 2013
Heat and mass fluxes monitoring of El Chichón crater lake
Monitoreo de los flujos de calor y masa del lago cratérico El Chichón
Loïc Peiffer1,2,*and Yuri Taran1
1 Instituto de Geofísica, Universidad Nacional Autónoma de México, Ciudad Universitaria, 04510 México D.F., México.
2 Present address: Instituto de Energías Renovables, Universidad Nacional Autónoma de México, Privada Xochicalco s/n, Centro, 62580 Temixco, Morelos, México. *loic.peiffer@gmail.com
Manuscript received: November 22, 2012
Corrected manuscript received: August 13, 2013
Manuscript accepted: September 23, 2013
ABSTRACT
El Chichón crater lake is characterized by important variations in volume (40,000 m3 to 230,000 m3) and in chemical composition alternating between acid-sulfate and acid-chloride-sulfate composition (Cl-/SO42- = 0-79 molar ratio). These variations in volume can occur very fast within less than a few weeks, and are not always directly correlated with the precipitation rate; the seepage rate of lake water is also an important parameter to consider in the lake mass balance. In this study, we present for the first time continuous physical data (temperature, depth, precipitation, wind velocity, solar radiation) of the crater lake registered by a meteorological station and two dataloggers. A heat and mass balance approach is proposed to estimate the heat and mass fluxes injected into the lake by the sublacustrine fumaroles and springs. Tracing the evolution of such fluxes can be helpful to understand this highly dynamic lake and offers an efficient way of monitoring the volcanic activity. During the observation period, the hydrothermal heat flux was estimated to be 17-22 MW, and the mass flux 10-12 kg/s (error on both values of ± 15%). These fluxes are mainly counterbalanced by the loss of heat and mass by evaporation, respectively of 20-24 MW and 8-10 kg/s. Furthermore, the seepage rate of the lake waters was estimated and shown to be a highly variable parameter (12-42 kg/s), depending on the lake surface. This new data set constitutes a baseline to monitor the future activity of El Chichón volcano. In case of volcanic activity renewal, one of the first precursor signals would probably be the full evaporation of the lake.
Key words: heat and mass balance, crater lake, geothermal energy, monitoring, exploration, El Chichón volcano, Mexico.
RESUMEN
El lago cratérico del volcán El Chichón se caracteriza por variaciones importantes en volumen (de 40,000 m3 hasta 230,000 m3), así como en su composición química, alternando composiciones de tipo ácido-sulfato y ácido-sulfato-cloruro (Cl-/SO42- molar = 0-79). Estas variaciones en volumen pueden ocurrir en un intervalo de tiempo corto, de menos de unas semanas, y no siempre se correlacionan con la cantidad de precipitación, debido al efecto de la tasa de infiltración de las aguas del lago. En este estudio, se presentan por primera vez datos físicos (temperatura, profundidad, precipitación, velocidad de viento, radiación solar) del lago registrados continuamente por una estación meteorológica y dos sondas. Además, con un modelo de balance de calor y masa se propone una estimación de los flujos de calor y masa inyectados en el lago por las fumarolas sublacustrinas y manantiales. El estudio de tales flujos permite entender mejor la dinámica del lago y podrá ofrecer una manera eficiente de monitorear la actividad del volcán. Durante el periodo de observación, los flujos de calor y de masa provenientes del sistema hidrotermal fueron estimados entre 17-22 MW y entre 10-12 kg/s (error para los dos valores de ± 15%), respectivamente. Estos flujos son balanceados por la pérdida de calor y masa debido a la evaporación, respectivamente de 20-24 MW y 8-10 kg/s. También se estimó la tasa de infiltración y se demostró que puede variar consideradamente (12-42 kg/s), y esto depende de la superficie del lago. Los datos presentados en este estudio constituyen una base importante para monitorear la actividad futura del volcán El Chichón. En caso de renovación de la actividad volcánica, una de las señales precursoras sería probablemente la evaporación completa del lago.
Key words: balance de calor y masa, lago cratérico, energía geotérmica, monitoreo, volcán El Chichón, México.
INTRODUCTION
El Chichón volcano (Chiapas, Mexico) is a 1100 m a.s.l. (above sea level) high volcanic complex composed of domes and pyroclastic deposits. It belongs to the Chiapanecan Volcanic Arc (CVA), which is located between the Trans-Mexican Volcanic Belt (TMVB) and the Central American Volcanic Arc (CAVA) (García-Palomo et al., 2004; Figure 1). Its last eruption in 1982 was one of the most powerful of the 20th century ejecting 1.1 km3 of anhydrite-bearing trachyandesite pyroclastic material and creating a 200 m deep and 1 km wide crater (Rose et al., 1984). Nowadays, thermal manifestations inside the crater consist of fumaroles with near-boiling temperatures, steaming ground, hot springs and an acidic (pH 2-3) and warm (~30°C) lake. Several groups of hot springs are also present on the SE to SW flank of the volcano (Figure 2; Taran et al., 2008).
The crater lake has been the focus of several geo-chemical studies (Rouwet et al., 2004; Rouwet et al., 2008; Taran and Rouwet, 2008; Mazot and Taran, 2009; Mazot et al. 2011). Due to its shallow depth (3—4 m in average), large surface area, small volume as well as the combination of several other parameters (precipitation, evaporation, seepage, hydrothermal input), El Chichón crater lake has shown a very dynamic behavior characterized by rapid changes in volume and chemistry.
Taran and Rouwet (2008) gave a rough estimation of the heat flux liberated through the crater lake of 7-12 MW (error of ± 50 %) using a chemical (Cl--SO42-), isotopic (δ18O, δD) and a heat-mass (H2O) approach. Their estimations are based on chemical analysis of the lake water sampled on an irregular basis (3 to 12 months). Furthermore, the climatic parameters considered in their study come from a meteorological station located at 20 km from the volcano, and may therefore not relect the climatic conditions at El Chichón. Mazot and Taran (2009), and posteriorly Mazot et al. (2011), estimated the heat flux through the lake to be between 15-43 MW by quantifying the CO2 degassing at the lake surface with a CO2 accumulation chamber. Finally, Taran and Peiffer (2009) gave a heat flux estimate for the whole hydrothermal system of 175-210 MW by measuring Cl- fluxes in rivers draining hot springs on the volcano slopes.
These estimations were either based on long-time observation or punctual measurements. Since the lake is a very dynamic system, heat fluxes could vary significantly from one day to another, which was not accounted for in the previous studies. Furthermore, for a better understanding of lake dynamics, it is important to consider more precise and accurate meteorological data. In this study, we present for the first time continuous physical data of the crater lake (temperature, depth) as well as meteorological parameters (precipitation, wind velocity, solar radiation) measured by a nearby meteorological station (Figure 2) and two dataloggers. Using a mass and heat budget model constrained with these data, a new estimation of heat and mass fluxes is proposed. This kind of continuous monitoring could help to understand the dynamics of this complex lake-springs-fumaroles system and could provide an efficient way of monitoring the volcanic activity.
CRATER LAKE AND THERMAL SPRINGS DYNAMICS
The Soap Pool springs are characterized by a peculiar type of activity alternating periods of water discharge to the lake at a flow rate varying between 10 to 40 L/s (flow rate measured by a Cl- balance approach), and periods of pure vapor exhalation (Rouwet et al., 2008). Rouwet et al. (2004) showed that the Soap Pool springs discharge to the lake is the only Cl- source of the lake. The Cl- content of these waters showed a steady decrease between 1995 and 2006 (from >13,000 mg/L to 2000-4500 mg/L). Afterwards, relatively stable concentrations of 3000 ± 1000 mg/L were observed (Peiffer, 2011). The decreasing Cl- concentration trend of the Soap Pool springs was interpreted as a dilution trend: the superficial aquifer feeding the Soap Pool springs has been being diluted by the water of an underlying boiling aquifer (Aquifer 1, Peiffer et al., in press). The steam generated by the boiling of this deeper aquifer condenses beneath the lake, and feeds the lake with chloride-free and sulfate-rich acid water, while the residual water, separated from the steam phase mixes with the Soap Pool springs through a complex hydrologic structure. Mixing is responsible for the Cl- content decrease in the Soap Pool springs until 2006. At that time, the original Cl- content of the Soap Pool has reached the Cl- content of the residual water originated from the boiling aquifer (~3000 mg/L). The Aquifer 1 also feeds the Agua Caliente (AC) and Agua Tibia (AT) springs located on the south-east to south-west flank of the volcano (Figure 3). These springs discharge hot (up to 78 °C) and near-neutral water with a chloride concentration between 1500 and 2200 mg/L.
One additional spring group is the Agua Salada (AS) springs. They discharge hot (up to 80 °C), acidic to near-neutral water with a Cl- concentration between 5000 and 11,500 mg/L. These springs probably originate from a different aquifer (Aquifer 2) located much deeper in a sedimentary horizon underlying the volcano (Peiffer et al., 2011).
DATA ACQUISITION
A Vaisala meteorological station was installed in the Colonia Volcán settlement (altitude of 590 m a.s.l.; Figure 2) in November 2010. The distance to the crater was approximately 5 km. The remoteness of the station from the lake might probably induce some errors in the estimation of the fluxes due to possible difference in meteorological conditions between the crater and Colonia Volcán settlement. Nevertheless, since the crater ake is a touristic attraction, we did not install the station inside the crater to avoid risk of vandalism and theft, and therefore the loss of data. The station is equipped with a multisensor WXT 520 that allows measuring wind speed and wind direction by ultrasonic technology, air temperature, relative air humidity, atmospheric pressure and amount of precipitation. The multisensor was installed at the top of a 2 m post (Figure 4). The station is also equipped with a solar radiation sensor. A datalogger 'QML201B' allows the acquisition and recording of data with a time interval of 10 minutes to an internal memory. The data stored in the internal memory are then transferred at the beginning of the day to an external 256 MB memory, and can be stored for 6 months. The station is supplied with a 12 V battery connected to a 10 W solar panel for automatic recharge. The datalogger and the battery are protected by a stainless steel box. The data are downloaded manually with a serial cable.

Inside the crater (altitude of 880 m a.s.l.), we installed two Schlumberger probes. The first one was placed inside the lake for measuring the water electrical conductivity, temperature and pressure (CTD). Nevertheless, the conductivity sensor failed in measuring correct data because of some deposits and algae that penetrated the sensor. So, no conductivity data are reported in this study. The other probe was installed outside the lake for measuring the air temperature and the atmospheric pressure (Baro; Figure 5) and allowed to realize barometric corrections for the lake depth calculation. The CTD datalogger was attached to two plastic boxes and was covered with a cotton fabric to avoid the introduction of sediments and algae inside the sensor. The two boxes were then attached with ropes to several buoys to keep track of the position of the datalogger. Using a small rubber boat, the whole installation was brought to a central spot of the lake characterized by the absence of bubbles. Bubbling gases are generally liberated from hot sublacustrine fumaroles that could burn the sensor. The two sensors were set up to record data every 4 hours. The data were manually downloaded to a laptop using an optic reading unit.

ENERGY-MASS BUDGET APPROACH
Several authors like Gorshkov et al. (1975), Brantley et al. (1987), Brown et al. (1989), Rowe et al. (1992), Hurst et al. (1991), Ohba et al. (1994) and Pasternack and Varekamp (1997) applied the energy budget method to estimate heat fluxes liberated through volcanic lakes. The energy budget can be calculated by the following equation:

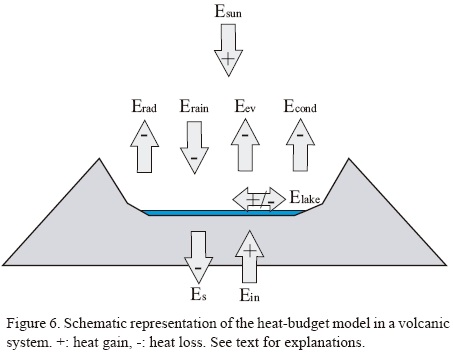
The variation in energy content of the lake (Elake) depends on the balance between the energy input into the lake by the sublacustrine fumaroles and springs (Ein), the energy lost by the lake to heat up the incoming rain water to the lake temperature (Erain), the energy lost by seepage of lake water through the lake floor (Es), the energy lost by evaporation Eev, the energy lost by heat conduction and advection to the air (Econd), the heat lost by radiation of the lake (Erad), and the energy gained from solar radiation (Esun) (Figure 6). The parameter Ein is the parameter of interest to monitor the heat flux liberated by the volcano into the lake (Brown et al., 1989; Ohba et al., 1994). Each parameter is calculated from the meteorological station data (air temperature, precipitation, solar radiation, wind intensity) and the dataloggers CTD (depth and temperature of the lake) and Baro (atmospheric pressure) as described as follow. Since energy parameters E (J) are calculated for a time interval of one day, they were converted into heat fluxes (W). The error propagation theory was used to estimate the equation uncertainties.
The variation in energetic content of the lake Elake between two observations corresponds to the lake variation in volume and temperature (Ohba et al., 1994):

where Cp is the specific heat capacity of the water (4.19 kJ·kg-1·K-1), V the lake volume (m3), Tlake the water temperature (°C), p the water density (kg/m3). For the p parameter, we assume a value of 1000 kg/m3 since the density variation with temperature is too low to cause any significant error. Salinity effect was not considered because of the lack of available continuous salinity data during the studied period.
The Erain parameter is calculated similarly (Ohba et al., 1994):

Where Vp stands for precipitation volume (m3), Tair and Take for the ambient air and lake temperature (°C), respectively. Cp and p are the same as in Equation 2.
Various formulas are available for the energy lost by evaporation Eev. In this study, we consider the equation proposed by Lee and Swancar (1997) in a study of a lake in Florida (USA) experiencing physical and climatic characteristics similar to El Chichón lake:

where Δθ is the difference in temperature between the lake water and the ambient temperature (°C) and u refers to the wind speed (m/s). Parameters eo and ea (mbar) refer to the vapor saturation pressure at the lake temperature and the vapor saturation pressure at the air temperature, respectively. eo and ea are calculated by the following equation (Tetens, 1930):

where T (°C) refers to the lake or air temperature.
The energy lost by conduction and advection Econd is related to the energy lost by evaporation Eev expressed by the Bowen (1926) equation:

where P is the barometric pressure (Pa).
The lake also loses some energy by emitting radiation in the infrared (Erad), which is estimated by the Stefan-Boltzmann law:

where ε is the water emissivity whose value was estimated to 0.972 (Davies et al., 1971), σ refers to the Stefan-Boltzmann constant (5.67·10-8 W·m-2·K-4), Tl is the lake temperature and Ta refers to the ambient temperature (K).
The solar energy term Esun is directly obtained from the solar radiation sensor installed on the meteorological station. Nevertheless, to account for the albedo, an average correction of 10% was applied to the sensor data as recommended by Stevenson (1992).
The energy lost by seepage of lake water Es is the most difficult parameter to estimate. Rouwet et al. (2004) give a seepage flux estimate of 20 kg·m-2·day-1 using a chlorine budget approach. We use this value for the heat budget calculation and consider an enthalpy of 113 kJ/kg for the infiltrating lake water (average lake temperature of 27 °C). Although this seepage rate can be erroneous, the heat flux lost by seepage is relatively low compared to other fluxes and does not affect the total balance.
A mass balance approach was also applied to the lake to calculate its water fluxes (Brown et al., 1989; Ohba et al., 1994):

where Mlake is the mass variation of the lake between two observations, Min is the mass input brought by the fumaroles and springs into the lake, Mrain is the rain amount, Minf the amount of water infiltrated, and Mev the quantity of water lost by evaporation. Those parameters were also calculated for a one day time interval.
RESULTS AND DISCUSSION
Intensive data
We present two set of continuous data collected between 20/11/2010 and 06/03/2011 (3.5 months, Period 1), and between 26/05/2011 and 12/08/2011 (2.5 months, period 2). The lack of data between the two periods is due to technical problems with the meteorological station (broken axis in Figures 7, 8, 10).
The evolution of the lake level and the amount of precipitation (mm) are shown in Figure 7. During the first period, the water level variations generally correspond to rain accumulation. On the contrary, during the second period the lake depth profile evolution is more complex and does not match clearly the rain accumulation profile. Instead, it decreases until the 25th of June 2011, and then shows some important oscillations related to changes in precipitation rate. After the 19th of July it starts to decrease again, and shows a last lake level increase on the 2nd of August.
In general, the lake temperature profile shows the same behavior than the air temperature profile of the crater (black and blue squares on Figure 8a).The average difference in temperature between the lake and the air is ~7-8°C for both periods. However, after important rain events, the lake temperature drops suddenly and needs a couple of days to recover to its background value. During the 2nd period, the lake and air temperature, as well as the average solar radiation are higher compared with the first one (200 W/m2 vs. 141 W/m2), which corresponds to expected higher radiation during summer (Figure 7b). On the contrary, the wind speed average values are relatively similar for both periods (0.78 m/s vs. 0.91 m/s; Figure 7c). The temperature profile measured by the meteorological station, also shown on Figure 8a (empty squares), are relatively similar to the ones measured inside the crater by the Baro datalogger (average difference in temperature of 5%). This observation allows to state that the meteorological conditions inside the crater do not differ significantly from the meteorological station conditions.
Parameter estimations
The lake surface on the 20/11/2012 was measured directly by GPS tracking and also indirectly from a picture of the lake following the photographic method developed by Rouwet et al. (2004) (Figure 9). This method consists in estimating the surface from pictures of the lake taken from the crater rim using a reference lake surface measured by GPS, and a triangle surface drawn on the picture between three known points to avoid perspective issue. The GPS data revealed a surface of 90,741 m2 at the beginning of the study (20/11/2012), and the photographic estimation was within 10% of error of the GPS value. Initial depth of the lake recorded by the CTD datalogger was 4.39 m. The lake surface during the following field trips to the lake, on the 18/01/2011 and 26/05/2011, was estimated only by the photographic method resulting in areas of 12 x 104 m2 and 16 × 104 m2. No picture of the lake was taken at the end of the second period.
We derived a new empirical relationship to relate the depth d (m) of the lake and the surface of the lake S (104 m2) estimated by GPS and the photographic method:

This equation was modified from the relationship presented in Rouwet et al. (2004) to obtain a better match between the lake depth and surface data. The lake depth was obtained by subtracting the pressure values measured by the Baro sensor (atmospheric pressure) from the pressure values measured by the CTD sensor (atmospheric pressure + water column pressure).
The volume V (104 m3) of the lake was then estimated using the following equation based on a bathymetric survey of the lake (S units = 104 m2, Rouwet et al., 2004):

Knowing the lake surface at the beginning of the measurements (20/11/2010), the surface and volume of the lake can be estimated for any period by combining Equations 9 and 10.
The volume of precipitation received by the lake does not only correspond to the rain amount that falls above its surface, but also incorporates the runoff waters. However, the total catchment area (the full crater) cannot be considered since an unknown fraction of the runoff water may infiltrate or evaporate before reaching the lake. Therefore, a correction factor, also called catchment coefficient must be applied to the total volume falling directly on the lake surface. Lake depth and precipitation data from Figure 7 are considered to estimate this parameter. The events 'a' and 'b' were selected to be important rain events (72 and 189 mm, respectively; Figure 7), because they occurred on a short time interval (less than a day) and the lake depth showed a simultaneous increase. Furthermore, these events occurred after a few days without rain, unlike other rain events from Figure 7, allowing a clear relationship between the amount of rain and the water level increase. Therefore, it is reasonable to believe that the lake depth variation is mainly due to the rain event and that the impact of lake evaporation and infiltration is limited. Considering the lake depth and surface increase after those two events, a catchment coefficient of 1.2 was calculated. Taran and Rouwet (2008) estimated a higher factor of 1.9 by the heat-isotopic-mass balance method. However, their value is an average value calculated with data collected over a period of more than 10 years, and this correction factor probably varies with the lake surface, being less important when the lake surface is higher than when the surface is smaller. Furthemore, the Taran and Rouwet (2008) estimation corresponds to a lake with an average surface that is smaller than the average surface area of the lake during this study.
Heat fluxes
The evolution of the fluxes Ein, Erain, Eev, Elake, Esun and Erad is presented in Figure 10. Ein values were calculated by solving all the parameters from the Equation 1. The average values for the two periods are listed in Table 1, together with the range of error affecting each estimate. The error ranges were estimated by the root mean square method, taking into the account the precision of each sensor and/or the error associated to each formula used in the model.

The Ein curve was softened using the moving average method:

This method consists in calculating the average of N values over a variable point and extrapolating the surrounding values taking into account the following values. This technique has the advantage to soften the accidental variations that can appear in the time series, like the sudden variation of lake temperature caused by important rain events. For example, during the whole 1st period it rained 1315 mm, which corresponds to an energy loss of 0.7 MW. However, there were some exceptional rain events during which it rained more than 200 mm during only two days, corresponding to an energy loss of 7 MW. Therefore, averaging the Ein data over a 3 days period allows smoothing those transient effects.
During the 1st period, the average hydrothermal heat flux entering the lake (Ein) was estimated to 22 MW (154 W/m2). However, the Ein curve shows dramatic variations between 0 and 54 MW, with periods between 7 and 27 days. The most pronounced oscillations are almost always related to the oscillations in Eev, the energy lost by evaporation. The evaporation constitutes the major loss of energy with an average value of 20 MW during the 1 st period, which almost balances the Ein flux. This observation suggests that all the heat released by the hydrothermal system into the lake is lost by evaporation of the lake. The other heat parameters Elake, Erain, Econd, Erad and Es (average total 17 MW) are balanced by the solar energy input Esun (15 MW).
However, the reason why the Ein curve is characterized by such oscillations is unclear. None of the heat parameters in the budget equation, except for the evaporation term Eev, is characterized by such oscillations (Figure 10). The Eev term appears to oscillate in response to the variation of the heat injected by the volcano-hydrothermal activity into the lake. Therefore, it seems that the Ein heat input is directly lost by evaporation. One of the reasons to explain the oscillation in the Ein curve could be the variations of the fumaroles-springs discharge into the lake, alternating high discharge and low discharge periods. The Soap Pool springs show this kind of behavior alternating periods of vapor and water discharge. Those cycles of activity are not regular: sometimes lasting for years, sometimes for a few months (Rouwet et al., 2004, 2008). Another hypothesis to explain the oscillations in Ein would be that the Esun parameter, estimated directly by the solar radiation sensor installed on the meteorological station, would not reflect the real solar radiation conditions at the lake (5 km west of the station). However, comparing the temperature profile registered by the Baro datalogger with the temperatures registered at the station (Figure 8a), it seems that meteorological conditions inside the crater do not differ significantly and therefore this hypothesis can be excluded.
Despite the large oscillations in the Ein curve, a general increase trend can be observed during the 1 st period and is related to the increase in surface of the lake (Figure 10d). A possible explanation for this trend is that when the lake surface becomes higher, the ground fumaroles surrounding the lake are flooded and thus discharge their heat content into the lake. On the opposite, when the lake surface is smaller, the fumaroles liberate their energy directly into the atmosphere.
For the 2nd period, the Ein average value of 17 MW (105 W/m2) is slightly smaller than the value for the 1 st period, while the heat flux loss by evaporation is a bit higher (24 MW). All the others heat fluxes are similar to the 1st period ones, with the exception of Esun which is higher (25 MW). The En parameter fluctuations are still correlated to Eev term, but not anymore to the lake surface variations.
Our estimation of the energy released by the volcano corresponds relatively well to the previous estimations by Mazot and Taran (2009) and Mazot et al. (2011) based on CO2 fluxes measurements, which were of 15-43 MW. The estimation by Taran and Rouwet (2008) of 11-16 MW using the energy-budget, chemical and isotope balance approaches is also similar.
El Chichón lake has a similar heat output than Copahue crater lake (7-45 MW; Varekamp et al., 2001), Yugama (3-22 MW; Ohba et al. 1994), Keli Mutu (54 MW; Varekamp et al., 2001), but much lower than the majority of other crater lakes (e.g., Kawah Ijen: 271-378 MW, Ruapehu: 385 MW; Table 2). There is no clear correlation between the volume of the lakes and the heat fluxes, nor with the type of lake. For example, the lake Poas has a much higher heat output (100-400 MW) than the lake Copahue although they both have similar volume and ultra-acidic water (pH <1; Rowe etal., 1995; Varekamp et al., 2009).

Mass fluxes
The average results for both periods of each parameter in Equation 8 are now compared (Table 1). For the 1st period, the average lake mass variation Mlake was 10 kg/s. The parameter Mrain was calculated to be 18 kg/s considering a catchment coefficient of 1.2. The flux of evaporated water Mev was 8 kg/s considering the average Eev value and a vapor enthalpy of ~2550 kJ/kg (average lake temperature of 27 °C). This approximation is valid because the vapor enthalpy does not vary much with the temperature. Taran et al. (2008) found a similar value of 5 kg/s.
The mass flux released by the hydrothermal system into the lake can be estimated by the following method. First, we assume that the Cl- concentration in the lake is entirely controlled by the discharge of the Soap Pool springs (Taran et al., 1998; Rouwet et al., 2004, 2008). During the 1st period, the lake Cl- concentration increased from 175 mg/L to 499 mg/L, while the Soap Pool waters showed similar concentration of Cl- between 2500 and 2668 mg/L (Peiffer, 2011). Knowing the volume variation of the lake during the first period, we estimate a discharge of the Soap Pool springs of 4.7 L/s. The water discharged by these springs cools down to a temperature of 70°C (field observation) before reaching the lake. Taking into account a corresponding enthalpy of 293 kJ/kg, the heat input by the Soap Pool springs to the lake is 1.4 MW. If the Soap Pool springs are the only group of springs to feed the lake with water, the fumarolic heat flux is then estimated to 20 MW, and the mass flux to 7.5 kg/s (assuming a vapor enthalpy at 100°C of 2675 kJ/kg). Although some of the fluid supplied by the subaqueous fumaroles might include a liquid phase, it is not possible to quantify the percentage of liquid and steam phase discharged; for this reason all the liquid phase discharged into the lake was assumed to come from the Soap Pool springs.
Therefore, the average total Min value is 12 kg/s. This value is almost counterbalanced by the evaporation rate (8 kg/s), like the Ein is counterbalanced by the Eev. This suggests that all the heat and mass injected to the lake by the underlying hydrothermal system is lost by evaporation. In case of volcanic activity renewal, one of the precursor sign could be the complete evaporation of lake. This situation was observed at the Kelut volcano (Indonesia), where the extrusion of a new lava dome evaporated the 2·106 m3 crater lake within a four months time interval (Caudron et al. 2012). Since the El Chichón lake volume is smaller, a faster evaporation of the entire lake can be expected.
Resolving Equation 8, a value of 12 kg/s or 9 kg/day. m2 was obtained for the seepage rate Ms during the 1st period. This value is twice as low as the 20 kg·day-1·m-2 estimation by Taran and Rouwet (2008).
Applying the same method to the second period, the M in parameter was estimated to be 10 kg/s, which is close to the Min estimation of the first period. Evaporation rate was similar to the 1st period (10 kg/s vs. 8 kg/s), but the precipitation rate was much higher (32 kg/s vs. 18 kg/s). The mass flux associated to the lake mass variation was -10 kg/s. Deducing the seepage rate from the equation gives a much higher flux of 42 kg/s or 32 kgday-1 m-2. This change in seepage rate between the first and second period probably reflect the fact that the floor permeability is not homogenous. As stated by Rouwet et al. (2009), the sediments located beneath a 'normal-sized' lake consist of low permeability clays. When the lake surface becomes higher, it covers more permeable pumiceous sands and therefore the seepage rate becomes higher. After the 25th of June 2011, the lake level and surface returned to a similar level than at the end of the 1st period one (Figure 7). This lake surface probably represents a maximum limit (~140,000 m2) which cannot be exceeded over a long period of time because of the high permeability of the pumiceous sands. In fact, no higher lake levels have been reported in previous work (Taran and Rouwet, 2008; Rouwet et al., 2008).
CONCLUSIONS
The presence of a lake in an active volcanic crater offers the opportunity to study the dynamics of the underlying volcano-hydrothermal system because the lake integrates the heat and mass released by the underlying system. In this study, we present for the first time continuous data (temperature, depth) of the El Chichón lake together with meteorological data for two distinct periods. The first period is characterized by a lake depth increase correlated with the precipitation amount, while the second period show a global decreasing depth trend with a few oscillations related to some rain events. As to the lake temperature, its evolution matches relatively well the ambient air temperature profile. In order to better understand the lake dynamics, we applied an energy-mass budget model that takes into account meteorological conditions.
The energy flux liberated by the sub-lacustrine fumaroles and springs into the lake (Ein) was estimated to be 17 MW for the 1st period and 22 MW for the 2nd period, and the correspondent mass fluxes to be 10 to 12 kg/s. These heat and mass fluxes are counterbalanced by the energy and mass flux lost by evaporation in both periods (20-24 MW, 8-10 kg/s). This means that all the energy and mass liberated into the lake by the volcano is directly released into the atmosphere by evaporation. The other energy losses are smaller (Erain: 0.7-1.3 MW, Econd: 6-7 MW, Erad: 6 MW, Es: 3.1-3.6 MW) and are almost counterbalanced by the solar radiation (15-25 MW). Important oscillations of the Ein flux have been observed and could be interpreted as 'pulses' of the hydrothermal discharge. However, analysis and interpretation of data on larger time interval is needed to verify this hypothesis.
The difference in the mass balance between the first and second period is controlled by the seepage rate. The seepage rate for the second period was much higher than during the first period (42 vs. 12 kg/s) and, although the precipitation rate for the second period was significantly higher than for the first period (32 vs. 18 kg/s), it causes the lake depth to decrease significantly. This reflects the heterogeneities in permeability of the crater floor. The area covered by the lake with a 'normal' size is constituted of impermeable clays, while the area occasionally flooded by a high surface lake is more permeable (pumiceous sands).
This set of data constitutes a baseline to monitor the future activity of El Chichón volcano. In case of volcanic activity renewal, one of the first visible sign would probably be the full evaporation of the lake.
ACKNOWLEDGEMENTS
This work was supported by the Federal Mexican Commission of Electricity (CFE) as part of a project on geothermal exploration of El Chichón volcano (contract no. 9400047770), and by the DGAPA-UNAM grant # 101913. We thank Felix Sánchez Sánchez and his family, as well as Matthias Fickel for the field support. We express our sincere thanks to the reviewers A. Mazot, S. Inguaggiatto and A. Terada for the valuable comments which helped improving an earlier version of the manuscript.
REFERENCES
Bowen, I.S., 1926, The ratio of heat losses by conduction and by evaporation from any water surface: Physical Review, 27, 779-787. [ Links ]
Brantley, S.L., Borgia, A., Rowe, G., Fernandez, J.F., Reynolds, J.R., 1987, Poás volcano crater lake acts as a condenser for acid metal-rich brine: Nature, 330, 470-472. [ Links ]
Brown, G., Rymer, H., Dowden, J., Kapadia, P., Stevenson, D., Barquero, J., Morales, L.D., 1989, Energy budget analysis for Poás crater lake: implications for predicting volcanic activity: Nature, 339, 370-373. [ Links ]
Caudron, C., Mazot, A., Bernard, B., 2012, Carbon dioxide dynamics in Kelud volcanic lake: Journal of Geophysical Research, 117, B05102, doi:10.1029/2011JB008806. [ Links ]
Davies, J. A., Robinson, P. J., Nunez, M., 1971, Field determinations of surface emissivity and temperature for Lake Ontario: Journal of Applied Meteorology, 10, 811-819. [ Links ]
Delmelle, P., 1995, Geochemical, isotopic and heat budget study of two volcano hosted hydrothermal systems: the acid crater lakes of Kawah Ijen, Indonesia, and Taal, Philippines, volcanoes: Brussels, Université Libre de Bruxelles, Ph. D. Thesis, 247 pp. [ Links ]
García-Palomo, A., Macias, J.L., Espindola, J.M., 2004, Strike-slip faults and K-alkaline volcanism at El Chichón volcano, southeastern Mexico: Journal of Volcanology and Geothermal Research, 136, 247-268. [ Links ]
Gorshkov, A.P., Grebzdy, E.I., Samoilenko, B.I., Slezin, Y.B., 1975, Calculations of the heat-mass balance for the Malyi Semyachik crater lake: Bulletin Vulkanologicheskikh Stantsii, 51, 50-60. [ Links ]
Hurst, A.W., Bibby, H.M., Scott, B.J., McGuinness, M.J., 1991, The heat source of Ruapehu Crater Lake; deductions from the energy and mass balances: Journal of Volcanology and Geothermal Research, 46, 1-20. [ Links ]
Lee, T.M., Swancar, A., 1997, Influence of evaporation, ground water, and uncertainty in the hydrologic budget of lake Lucerne, a seepage lake in Polk County, Florida: United States Geological Survey, Water-Supply Paper 2439, 61 pp. [ Links ]
Mazot, A., 2005, CO2 degassing and fluid geochemistry at Papandayan and Kelud volcanoes, Java Island, Indonesia: Brussels, Université Libre de Bruxelles, Ph. D. Thesis, 294 pp. [ Links ]
Mazot, A., Taran, Y.A., 2009, CO2 flux from the crater lake of El Chichón volcano (México): Geofísica Internacional, 48, 73-83. [ Links ]
Mazot, A., Rouwet, D. Taran, Y., Inguaggiato, S., Varley, N., 2011, CO2 and He degassing at El Chichón volcano, Chiapas, Mexico: gas flux, origin and relationship with local and regional tectonics, in Inguaggiato S, Shinohara H, and Fischer T (eds.), Geochemistry of Volcanic Fluids: a special issue in honor of Yuri A. Taran: Bulletin of Volcanology, 73, 423-442. [ Links ]
Ohba, T., Hirabayashi, J.-I., Nogami, K., 1994, Water, heat and chloride budgets of the crater lake, Yugama at Kusatsu-Shirane volcano, Japan: Geochemical Journal, 28, 217-231. [ Links ]
Pasternack, G. B., Varekamp, J.L., 1997, Volcanic lake systematics, I., Physical constraints: Bulletin of Volcanology, 58, 528-538. [ Links ]
Peiffer, L., 2011, Caracterización geoquímica y potencial geotérmico de los acuíferos del volcán El Chichón, Chiapas, México: Universidad Nacional Autónoma de México, PhD Thesis, 182 pp. [ Links ]
Peiffer, L., Taran, Y., Lounejeva, E., Solís-Pichardo, G., Rouwet, D., Bernard-Romero, R., 2011.Tracing thermal aquifers of El Chichón volcano-hydrothermal system (México) with 87Sr/86Sr, Ca/Sr and REE: Journal of Volcanology and Geothermal Research, 205, 55-66. [ Links ]
Peiffer, L., Rouwet, D., Taran, Y., in press, Hydrothermal manifestations of El Chichón volcano, in Scolamacchia, T., Macías, J.L., (eds.), Volcanoes of the World, Active volcanoes of Chiapas (Mexico): El Chichón and Tacaná: Berlin Heidelberg, Springer-Verlag. [ Links ]
Poussielgue, N., 1998, Signal acoustique et activité thermique dans les lacs de cratère de volcans actifs. Réalisation d'une station de mesure hydroacoustique au Taal (Philippines): France, Université de Savoie, PhD Thesis, 246 pp. [ Links ]
Rose, W. I., Bornhorst, T. J., Halsor, S. P., Capaul, W. A., Plumley, P. S., De La Cruz, S. R., Mena, M., Mota, R. 1984, Volcán El Chichón, Mexico: Pre-1982 S-rich eruptive activity: Journal of Volcanology and Geothermal Research, 23, 147-167. [ Links ]
Rouwet, D., Taran, Y., Varley, N.R., 2004, Dynamics and mass balance of El Chichón crater lake, Mexico: Geofisica Internacional, 43, 427-434. [ Links ]
Rouwet, D., Taran, Y., Inguaggiato, S., Varley, N., Santiago Santiago, J.A., 2008, Hydrochemical dynamics of the "lake-spring" system in the crater of El Chichón volcano (Chiapas, Mexico): Journal of Volcanology and Geothermal Research, 178, 237-248. [ Links ]
Rouwet, D., Bellomo, S., Brusca, L., Inguaggiato, S., Jutzeler, M., Mora, R., Mazot A., Bernard R., Cassidy M., Taran Y., 2009, Major and trace element geochemistry of El Chichón volcano-hydrothermal system (Chiapas, Mexico) in 2006-2007: implications for future geochemical monitoring: Geofisica Internacional, 48, 55-72. [ Links ]
Rowe, G.L., Brantley, S.L., Fernández, M., Fernández, J.F., Barquero, J., Borgia, A., 1992, Fluid-volcano interaction in an active stratovolcano: the crater lake system of Poás volcano, Costa Rica: Journal of Volcanology and Geothermal Research, 49, 23-51. [ Links ]
Rowe, G.L., Brantley, S.L., Fernández, J.F., Borgia, A., 1995, The chemical and hydrologic structure of Poás volcano, Costa Rica: Journal of Volcanology and Geothermal Research, 64, 233-267. [ Links ]
Stevenson, D.S., 1992, Heat transfer in active volcanoes: models of crater lake systems: United Kingdom, The Open University, PhD Thesis, 235pp. [ Links ]
Taran, Y., Fischer, T.P., Pokrovsky, B., Sano, Y., Annienta, M.A., Macías, J.L., 1998, Geochemistry of the volcano-hydrothermal system of El Chichón Volcano, Chiapas, Mexico: Bulletin of Volcanology, 59, 436-449. [ Links ]
Taran, Y., Rouwet, D., 2008, Estimating thermal inflow to El Chichón crater lake using the energy-budget, chemical and isotope balance approaches: Journal of Volcanology and Geothermal Research, 175 , 472-481. [ Links ]
Taran, Y., Rouwet, D., Inguaggiato, S., Aiuppa, A., 2008, Major and trace element geochemistry of neutral and acidic thermal springs at El Chichón volcano, Mexico. Implications for monitoring of the volcanic activity: Journal of Volcanology and Geothermal Research, 178, 224-236. [ Links ]
Taran, Y.A., Peiffer, L., 2009, Hydrology, hydrochemistry and geothermal potential of El Chichón volcano-hydrothermal system, Mexico: Geothermics, 38, 370-378. [ Links ]
Terada, A., Hashimoto, T., Kagiyama, T., 2012, A water flow model of the active crater lake at Aso volcano, Japan: fluctuations of magmatic gas and groundwater fluxes from the underlying hydrothermal system: Bulletin of Volcanology, 74, 641-655. [ Links ]
Tetens, O., 1930, Uber Einige meteorologische Begriffe: Zeitschrift für Geophysik, 6, 297-309. [ Links ]
Varekamp, J.C., Ouimette, A.P., Herman, S.W., Bermudez, A., Delpino, D., 2001, Hydrothermal element fluxes from Copahue, Argentina: a "beehive" volcano in turmoil: Geology, 29: 1059-1062. [ Links ]
Varekamp, J.C., Ouimette, A.P., Herman, S.W., Flynn, K.S., Bermudez, A., Delpino, D., 2009, Naturally acid waters from Copahue volcano, Argentina: Applied Geochemistry, 24, 208-220. [ Links ]

