


Servicios Personalizados
Revista
Articulo
 Inglés (pdf)
 Artículo en XML
 Referencias del artículo
 Enviar artículo por email
Indicadores
-
 Citado por SciELO
 -
 Accesos
Links relacionados
-
 Similares en
SciELO
Similares en
SciELO
Compartir

 Permalink
Revista mexicana de ciencias geológicas
versión On-line ISSN 2007-2902versión impresa ISSN 1026-8774
Rev. mex. cienc. geol vol.30 no.1 Ciudad de México abr. 2013
GIS based Spatial Groundwater Recharge estimation in the Jafr basin, Jordan-Application of WetSpass models for arid regions
Estimación espacial de recarga de agua subterránea basada en SIG en la cuenca de Jafr, Jordania–Aplicación de modelos WetSpass a regiones áridas
Mustafa Al Kuisi1 and Ali El-Naqa2
1 Department of Applied Geology and Environment, The University of Jordan, Amman-11942, Jordan.*mkuisi@ju.edu.jo
2 Department of Water Management and Environment, Hashemite University, Zarqa-13115, Jordan. **elnaqa@hu.edu.jo
Manuscript received: April 3, 2012
Corrected manuscript received: September 11, 2012
Manuscript accepted: September 12, 2012
ABSTRACT
The spatial variation of groundwater recharge depends on distributed land-use, soil type or texture, slope, groundwater level, and meteorological conditions. This study was initiated to estimate groundwater recharge using the WetSpass spatially distributed water balance model. The groundwater recharge in Jafr basin takes place primarily in the outcrop area of the western highlands by direct and indirect infiltration of rainfall. Due to sparseness ofvegetation and steep topography, most of the recharge occurs by infiltration of runoff accumulating in the wadi beds during rainstorms. The long-term temporal and spatial average annual rainfall of 53.5 mm was distributed as 2.61 mm (4.9%) of surface runoff, 50.6 mm (94.6%) of evapotranspiration, and 0.27mm (0.5%) of recharge. This recharge corresponds to 3.67 Mm3 for the Jafr basin. Analysis of the simulated results reveals that WetSpass works well to simulate the components of the hydrological balance for the Jafr basin.
Key words: Jafr basin, geographic information systems, groundwater recharge, water budget, water balance, WetSpass model.
RESUMEN
La variación espacial de la recarga de aguas subterráneas depende del uso del suelo distribuido, del tipo o textura del suelo, de la pendiente, del nivel freático y de las condiciones meteorológicas. Este estudio se inició para estimar la recarga de agua subterránea mediante el modelo de balance de agua distribuido espacialmente WetSpass. La recarga de las aguas subterráneas en la cuenca Jafr se lleva a cabo principalmente en el área de afloramiento de las tierras altas occidentales por infiltración directa e indirecta de agua de lluvia. Debido a la baja densidad de vegetación y a la escarpada topografía, la mayor parte de la recarga se produce por infiltración de escorrentías que se acumula en "wadi beds" durante las tormentas. La precipitación anual promedio de largo plazo, tanto temporal como espacial de 53.5 mm se distribuyó entre 2.61 mm (4.9%) de la escorrentía superficial, 50.6 mm (94.6%) de la evapotranspiración, y 0.27mm (0.5%) de recarga. Esta recarga corresponde a 3.67 Mm3 en la cuenca Jafr. El análisis de los resultados simulados revela que WetSpass funciona bien para simular los componentes del balance hídrico en la cuenca Jafr.
Palabras clave: cuenca Jafr, sistemas de información geográfica, recarga de aguas subterráneas, balance hídrico, modelo WetSpass.
INTRODUCTION
Jordan is considered as one of the ten most water-scarce countries in the world (El-Naqa et al. 2009). The country, dominated by arid and semi-arid climate, suffers from scarcity of natural water resources and increasing population growth. This has caused an increased demand on water resources and resulted in a wide disparity between water supply and demand. On the other hand, large volumes of water are required for the phosphate mining industry in Jordan, where water resources are extremely limited. The Eshidiya mine uses large amounts of water with an abstraction above 20 MCM per year, while the estimated safe yield of this ground basin is about 6 MCM per year (MWI, 2004). Consequently, a drop in the water table was identified where groundwater wells have been installed.
For an effective and sustainable management of water resources in the Jafr basin, an understanding of the spatial and temporal variability of various water balance components and groundwater recharge is required. In this study, we applied the WetSpass model to simulate the water balance and estimate average annual and seasonal water balance components, such as surface runoff, evapotranspiration and groundwater recharge.
Results from the WetSpass model can be analyzed in various ways including summer and winter output differences, analysis of spatial variations of recharge and runoff, as a function of land use and soil type and evapotranspiration and recharge as a function of elevation. In this study, the output results are represented as spatial variation over the basin, and temporal variations are taken into consideration for the climatic data (summer, winter and annual).
SITE LOCATION
The Jafr basin is located in the southern part of the central Jordan plain and to the east of the western highlands (Figure 1). The basin has an area of 13500 km2, most of which is classified as an arid desert with mean annual rainfall of about 50 mm (Howard Humphreys Ltd., 1984). The basin displays a classic centripetal drainage pattern with all wadis draining from the encircling highlands to the central El-Jafr playa with an area of ~240 km2 (Abu-Aj amieh, 1967; JICA, 1990). The catchment area is located at elevations between 850 m in Al-Jafr playa and 1750 m in the western highlands. The Jafr basin is about 150 km long (NW-SE) and about 100 km wide.
WetSpass MODEL
WetSpass stands for water and energy transfer between soil, plants and atmosphere under quasi-steady state conditions (Batelaan and De Smedt, 2001). WetSpass is especially suited for studying long-term effects of landuse changes on the water regime in a watershed and was founded on the time-dependent spatially distributed water balance model, called "WetSpa" (Batelaan et al., 1996; Wang et al., 1997; De Smedt et al., 2000).
The model is completely integrated with GIS ArcView (3.x) as a raster model coded in Avenue, the programming language of ArcView. Parameters such as land use and soil types are connected to the model as attribute tables of land use and soil raster maps, which allow new definitions of climatic as well as land use and soil types (Batelaan et al., 2003).
WetSpass was originally developed for conditions in temperate regions for Europe in particular. Land use and soil types and the number of harvesting weeks in a year that fall in the summer and winter seasons are all fixed based on cases in Europe
However, the land use classes and the soils textural composition and classification for semi-arid countries like Jordan are apparently different than the case in temperate regions (Abu-Saleem et al., 2010).
Therefore, a modified WetSpass model called WetSpass-Jor, an ArcView 3.2 Avenue script for running WetSpass, was developed for watersheds in Jordan (Abu-Saleem, 2010).The land use parameter table are modified and land use parameter tables for Jordanian summer and winter seasons are developed and used in the modeling processes.
WetSpass gives various hydrologic outputs on a yearly and seasonal (summer and winter) basis (De Smedt and Batelaan, 2001). Even though the model was originally developed to compute the long-term spatially distributed recharge of a basin, it also simulates runoff, evapotranspiration, interception, transpiration, soil evaporation and errors in water balance. Calculations are performed for each time scale and on each grid or cell of land of the catchment. The grid size (or cell length) for this particular study is 90 m, therefore every grid cell on the GIS map represents an area of 8100 m2.
The results from the model can be analyzed in various ways. The spatial variations of recharge and runoff can be obtained as a function of land use and soil type, and the analysis of evapotranspiration and recharge as a function of elevation.
Since all output from the model are grid maps and not tabular values, it would be helpful to combine two or more grid maps. In this case, the ArcView script called 'combine ave' is used to combine three different grids to produce a data base file (.dbf). The data base file from ArcView can be exported to spread sheet for further analysis and graphical presentations. The grid maps for topography, recharge and evapotranspiration were then combined to analyze the relationship between elevation, evapotranspiration and recharge. The land use and soil maps were joined with recharge and surface runoff output maps to visualize the impact of different land covers and soil texture on the groundwater recharge and surface runoff.
WATER BALANCE ESTIMATION
The water balance components of vegetated, bare-soil, open-water, and impervious surfaces are used to calculate the total water balance of a raster cell using following equations (De Smedt and Batelaan, 2001):
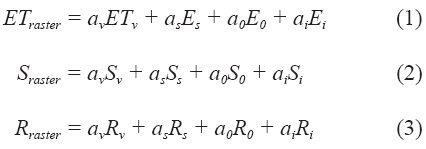
Where ETraster,Sraster,Rraster are the total evapotranspira-tion, surface runoff, and groundwater recharge of a raster cell, respectively, each having a vegetated, bare-soil, open-water and impervious area component denoted by av, as, ao, and ai, respectively, E is evapotranspiration.
Precipitation is taken as starting point for the computation of the water balance for each of the above mentioned components of a raster cell. Other processes (interception, runoff, evapotranspiration and recharge) follow in an orderly manner; which becomes a prerequisite for the seasonal time scale to quantify the processes. The water balance for the different components is treated hereafter.
ESTIMATION OF GROUNDWATER RECHARGE
Recharge is an important factor in evaluating groundwater resources but it is often difficult to quantify (Batelaan and De Smedt, 2007). The WetSpass model determines the long-term average spatially distributed recharge as a spatial variable dependent on the soil texture, land-use, slope, and meteorological conditions, taking into account the influence of the spatial variability of the land surface on the groundwater system (Batelaan and De Smedt, 2004).
In WetSpass, groundwater recharge is calculated as a residual term of the water balance (Equation 4).

where P is the average seasonal precipitation, ETv is the actual evapotranspiration [Lt-1], given as the sum of transpiration, Sv is the surface runoff over the land surface beneath the vegetation, Tv is the evaporation from bare soil between vegetation, I is the interception by vegetation, i.e. the part of the precipitation that evaporates from the wet surface of the vegetation, and Rv is the groundwater recharge, all variables have the unit of LT-1.
The methodology described above can be employed for the estimation of the spatially distributed groundwater recharge as a function of vegetation, soil texture, slope, precipitation, groundwater depth, and other climatic variables (Batelaan et al., 2003).
MODEL INPUT AND OUTPUT
The WetSpass model requires five categories of input data: Climatic, catchment configuration, vegetation, soil properties and boundary conditions. Climatic data includes precipitation, potential evapotranspiration, wind speed and Penman coefficient, while catchment configuration considers land use types, slope and groundwater depth. The soil parameters data consists of hydraulic properties and empirical coefficients for modeling evapotranspiration and surface runoff. Boundary conditions take into consideration the extension of the area to be modeled. Similarly, the output from the WetSpass model includes the actual evapotranspiration, surface runoff and groundwater recharge distribution over a region. The results from different scenarios of land management practices can then be used by decision-makers to prepare land management plans.
INPUT DATA TO WetSpass MODEL
The interaction of climate, geology, morphology, soil condition, and vegetation determines the recharge process (de Vriers and Simmers 2002). These input data were prepared in the form of maps of selected meteorological, hydrological, and geographical elements in the basin. Theclimate data for the Jafr basin was obtained from the Jordan Meteorological Department (JMD, 2005) for different stations and data was prepared for the WetSpass model.
Climatic conditions in the area are characterized by low rainfall between October and May. During these months, the area is influenced by the Mediterranean low pressure system, which results in cool moist air moving eastwards over the region.
There are 11 climatological stations in the Jafr basin (Figure 2). Climatological data such as temperature, relative humidity, evaporation, hours of sunshine, wind velocity and direction, and rainfall are available for the period 1977 through 2005.
Temperature
Temperature data are available for all the five weather stations, temperature data for two meteorological stations are given in Table 1. The average annual minimum temperature is recorded in January, which varies from 3.9 °C at Al-Hasa to -2.6 °C at Udruh, while the average annual maximum temperature is recorded in July or August with 35.5 °C at Jafr and 27.4 °C at Shoubak. Relative humidity is as low as 30-50% from May to October and 60 to 80% from December to January. The average annual total evaporation measured by U.S. Class A pan evaporation varies from 1800 mm at Shoubak to 4200 mm at Jafr, whereby 70% of the annual evaporation at all stations occurs between April and September.
Precipitation
Rainfall records are available from 1976 to 2005 for all stations. In Jordan, the hydrological year is divided into two distinct seasons, a rainy season from October to May and a dry season that runs for the rest of the year. The average annual rainfall is represented in the isohyetal map in Figure 2, showing a general decrease from 150-250 mm in the western and north-western highlands to less than 40 mm in the east. Rainfall decreases dramatically from 250 mm in the western areas northwest of Udruh to 40 mm at Ma'an, which illustrates the rain shadow effect of the Western Highlands. From the isohyetal map and using the area-rainfall method, the mean annual rainfall for the El Jafr basin was estimated to be 53.6 mm between 1976 and 2005.
Rainfall over the basin occurs only during the period October to May, with the heaviest falls between December and March. Examples of the distribution of monthly rainfall within different localities in the basin (Ma'an and El Jafr) are shown in Figure 3. In the west, the wettest months are December and January, whilst towards the centre and east of the basin most rainfall occurs in February. Rainfall magnitude varies widely from one year to another, as depicted in Figure 3.
Actual evapotranspiration
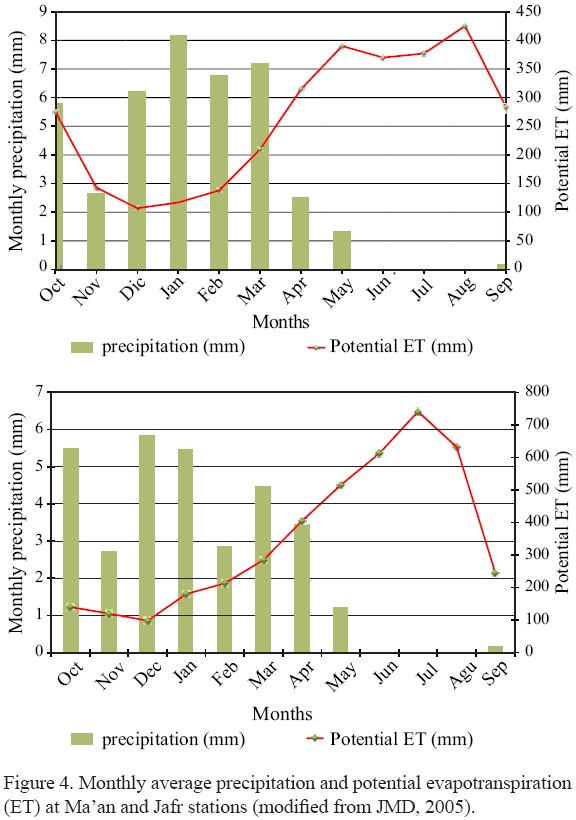
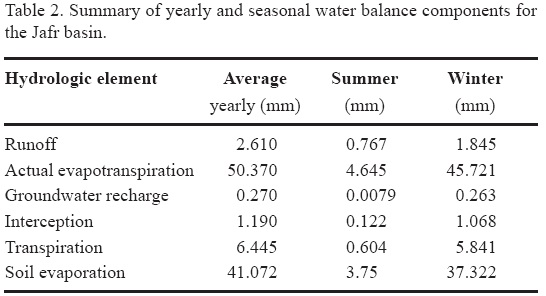
During the months from May to September, pan evaporation is approximately two to three times higher than in winter (Figure 4). Evaporation increases from west to east, reflecting the variation in temperature in this direction and during the rainfall period; the average pan evaporation is 7.6 mm/day. Assuming a pan coefficient of 0.65 (Serrano, 2010), free water surface evaporation is approximately 5 mm/day. The potential evapotranspiration data obtained from pan evaporation is listed in Table 2.
Wind speed
Wind speed data are available for few meteorological stations (Table 1). These data were used uniformly over the catchment: Average summer (3.55 m/s), winter (2.79 m/s), and annual (2.82 m/s).
Land use
Landsat satellite images for the years 1987 and 2000 of the study area under investigation were downloaded from www.landsat.org. The landuse in the study area is for agriculture land (7%), excavations (17%), bare land (sand) (62%), mudflat (10%) and urban and built-up area (3%) (Figure 5). Most of the escarpment area is bare land and is highly degraded due to the steep topography and deforestation. The highland area is covered by thin soil and is now considered a cultivated land. There is no land-cover change from summer to winter and thus it was not taken into account in the respective parameter tables for WetSpass modelling. Bare land means exposed rock outcrops and exposed soil surface with scrubs and grass vegetation. Cultivation is mainly in the highlands where the rainfall is higher with an average of 250 mm, while the average rainfall in the lowland area is less than 50 mm.
Topography and slope
Digital Elevation Model (DEM) of the study area is used with a cell size of 90 m. The DEM is processed to prepare topographic, slope and stream network of the study area (Figure 6). The topography map of the Jafr basin was obtained from the Shuttle Radar Topography Mission (SRTM) dataset of the National Aeronautics and Space Administration (NASA) (Jarvis et al., 2008). The SRTM data is a major breakthrough in digital mapping as it provides digital elevation model (DEM) data in 5º × 5º tiles for over 80% of the globe with a resolution of 90 m at the equator.
The lowest point in the basin is 823 m in the central part and the highest is 1730 m in the western part, while the mean elevation of the basin is 1004 m. The slope map of the basin is directly derived from the topography map using the 'derive slope' module in ArcView GIS 9.3. The slope ranges from 0 to 30.6 % with a mean of 1.4% (Figure 7).
Soil
The soil map of the Jafr basin was obtained from the soil map data base at the National Center for Agriculture Research and Technology Transfer (NCART). The percentage of the topsoil textures (coarse, medium and fine) was used to look for the type of soil from the universal soil texture triangle, resulting in 2.8 % of silty clay, 13.4% of sand and 82.8.2% of silty loam (Figure 8).
Hydrogeology
Aquifers in the Jafr basin have been recognized in argillaceous, arenaceous and/or carbonate rocks of the Ordovician to Palaeogene age such as the Disi sandstone, Kurnub Sandstone, Amman-Wadi-Sir (B2/A7) Silicified Limestone, and Rijam (B4) Silicified Limestone. In this study, attention was focused on the B2/A7 Aquifer. In the southern part of the Jafr basin, to the south of the Shidiya phosphate mines, B2/A7 is thin and unsaturated while it is confined by overlying thick impervious argillaceous unit of the Muwaqqar (B3) formation in the central part of the study area. The surrounding areas, however, are unconfined. Figure 9 represents a N-S cross-section within the area (see Figure 1 for location) showing the influence of the faulting and jointing systems on aquifer thickness and dimension. The transmissivities and hydraulic conductivities of the B2/ A7 aquifer are extremely variable. The transmissivities vary between less than 1 (impermeable) to more than 10,000 m2/day. To construct the water level and the groundwater flow pattern, a simulation 3D model is constructed using VISUAL MODFLOW (Waterloo Hydrogeologic Inc., 2006) as a mathematical code and the pre- processing Modflow as interface software. The geo-database in ArcGIS format facilitates the model construction. The simulation model of the B2/A7 aquifer for groundwater flow pattern of the B2/ A7 aquifer is shown in Figure 10. The groundwater head in the study area ranges from more than 1500 m (above sea level) asl in the west to 725 m asl in the eastern part of the Jafr basin. The groundwater flows from the western part into the eastern part.
WetSpass was integrated in the GIS ArcView as a raster model, coded in Avenue. Parameters pertaining to landuse and soil texture are connected to the model as attribute tables of the landuse and soil raster maps. This facilitates the definition of new landuse or soil types, as well as changes to parameter values (Batelaan and De Smedt, 2007). The soil texture classification used for the WetSpass model is obtained from soil maps (Hunting Technical Services and Soil Survey And Land Research Centre, 1993) in addition to measurements, which were performed on 50 soil samples collected from the basin.
WetSpass RESULTS
The results of the modeling are constituted by digital images of the spatial distribution of annual average values of actual evapotranspiration, surface runoff and groundwater recharge in the 30-year period from 1976 to 2005. These maps are raster-shaped, in which every pixel represents the magnitude of the respective component of the water balance, expressed as layer thickness (in mm).
Actual evapotranspiration
The model calculates the total actual evapotranspiration ETv as a sum of water intercepted by vegetation, the transpiration of the vegetative cover and the evaporation from the bare soil between the vegetation. WetSpass simulates the average annual evapotranspiration of the basin to be 13.14 mm and 275.3 mm as minimum and maximum values, respectively. The mean and standard deviation of this distribution are 50.37 mm and 49.1 mm, respectively. While the mean ETv of the basin in summer season is 4.65 mm, the mean value in winter is approximately 45 mm. About 79% of the total annual evapotranspiration is lost during summer season and the remaining 21% is released in the winter season. This variation occurs due to differences in precipitation within the two seasons.
The average evapotranspiration accounts for more than 90% of the total annual rainfall. This shows that ET is the main process of water loss in the basin. This is attributed to the high rates of radiation and the persistence of strong dry winds. ET is largely determined by solar radiation, which is fairly constant throughout the year. As a result, ET varies little from year to year, especially in the dry season.
The annual evapotranspiration map (Figure 11) shows that a low annual rate with less than 50 mm/year is observed in areas with lowest annual rainfall. However, the northwestern part of the basin has a high evapotranspiration due to high precipitation even though it has similar land-use and soil types.
Surface runoff
The WetSpass model uses the runoff coefficient method for the estimation of surface runoff Sv. The surface runoff coefficient is a function of vegetation type, soil texture and slope. Hence, Sv in the Jafr basin varies spatially with topography and other catchment characteristics.
The amount of Sv shows variation during summer and winter seasons. The simulated Sv varies from 0.052 mm/yr to a maximum of 97.08 mm/yr with a mean of 2.16 mm/ yr. The mean Sv of the basin in summer season is 0.77 mm, while the mean Sv in winter is approximately 1.85 mm. The mean value represents 4.9% of the total annual precipitation of the Jafr basin. About 93% of Sv occurs during the wet months (September to April), while the remaining 7% is related to dry months (May to August). This variation comes from rainfall differences in the two seasons. The rainfall exceeds the infiltration capacity of soil during the wet season which leads to high surface runoff.
According to the annually simulated surface runoff of the catchment (Figure 12), the north-western part of the catchment has highest rates due to the presence of silt loam and/or silt clay soil, whose low permeability enhances surface runoff. On the other hand, the southeastern part of the catchment near the outlet presents less surface runoff, caused by sandy soil types. This shows that soil types have a great impact on the annual surface runoff of Jafr catchment.
Most of the rainfall in Jafr basin comes in the form of thunder storms, whereby a thin impermeable layer at the ground surface increases the probability of surface runoff.
Groundwater recharge
In general, the amount of infiltration into groundwater depends on factors such as vegetation cover, slope, soil composition, depth to the water table, and the presence or absence of confining beds. Recharge is promoted by natural vegetation cover, flat topography, permeable soils, a deep water table and the absence of confining beds.
The resulting groundwater recharge from WetSpass for the present land use ranges from zero to 34.3 mm/yr, with an average value of 0.27 mm/yr and a standard deviation of 1.99 mm/yr. The mean groundwater recharge of the basin in summer season is 0.008 mm, while the mean recharge in winter is approximately 0.26 mm.
About 95% of the annual groundwater recharge of the catchment occurs during the wet season (winter), and the remaining 5% in dry season (summer). The western highlands of the Jafr basin have a generally high annual groundwater recharge due to the presence of permeable soils, high precipitation and high vegetation cover. The annual groundwater recharge rate in the western highlands reaches up to 34 mm/yr (Figure 13). On the contrary, the southeastern corner of the catchment area has less amount of recharge due to low precipitation and impermeable soils (Figure 13).
In general, high values of groundwater recharge are observed in the bare-and cultivated land with permeable, sandy and loam soils and with highly fractured limestone in the western highland. From the simulated results, the groundwater recharge of the basin can be assumed to be 40% of the safe yield, which corresponds to 1.38 mm/year.
EARLIER ATTEMPTS TO ESTIMATE RECHARGE FOR THE JAFR BASIN
Some reports are available about earlier efforts made to estimate groundwater recharge in the Jafr basin such as the ones published by Howard and Humphreys (1984), BGR (1989), JICA (1990) and National Water Master Plan for Jordan (NWMP) (2004).
According to the reports from Howard and Humphreys (1984), a runoff coefficient of 3.9% was assumed for the catchment area. In addition, a recharge of 0.9% from precipitation was estimated. On the other hand, JICA (1990) estimated a runoff coefficient of 4.5% and a recharge of less than 1%.
According to NWMP (2004), the mean annual rainfall over the basin ranges from the highs of about 200 mm/year in the western highlands to less than 25 mm/year in its eastern parts, averaging over the whole basin to about 40 mm/ year. Runoff volumes have been calculated on a daily basis and are stored as monthly and annual values for the basin.
Flood flow for dry, normal and wet year is 1.3, 3.9 and 14.7 MCM, respectively; the base flow is 0.6 MCM. On the other hand, the recharge modeled for the basin was 8 MCM. The comparison of average annual recharge volumes obtained from the WetSpass data set shows variations for volumes. The calculated recharge is relatively high because of the actual evapotranspiration and runoff estimation in the water balance (i.e., low evapotranspiration and runoff coefficient with 88% of 3%, respectively).
CONCLUSIONS
The WetSpass model was employed for estimating spatially distributed, long-term average recharge for the Jafr basin. Results from the WetSpass model are in good agreement with those of previous studies and indicates the validity of the simulated recharge. Additionally, results obtained from the WetSpass model shows that the mean annual recharge in the basin is about 0.27 mm/year, which accounts for 3.67 MCM/year. The simulated mean annual surface runoff in the basin is 2.61 mm, which corresponds to approximately 34 MCM. 50.6 mm/year for actual evapotranspiration accounts for 94.6% of the annual precipitation in the basin due to arid climatic conditions.
Moreover, results obtained from the WetSpass model were compared with the estimated recharge to groundwater carried out by Howard and Humphreys (1984) and JICA (1990). Those investigators concluded that the aquifers receive recharge from the western highlands by direct and indirect infiltration of rainfall. They also estimated the recharge to Amman-Wadi Sir Aquifer in the Jafr basin to be 1.3 MCM of indirect recharge and 2.31 MCM of lateral through flow from the western highland. Their calculated total of 3.44 MCM for the total recharge is very similar to the obtained value of 3.67 MCM as part of the present study. The present investigation has demonstrated that the estimation of groundwater recharge using WetSpass is in good agreement with those obtained by other studies.
ACKNOWLEDGMENTS
We are grateful to the Scientific Editor Dr. Peter Birkle for his extensive comments on style and technical content as well as for editing the manuscript, and to Dr. Ireneusz Kajewski and one anonymous reviewer for reviewing the manuscript. The authors extends thank to the University of Jordan, the Ministry of Water and Irrigation and Jordan Meteorological Department for providing climatological data. Thanks are also extended to Dr. Jason Rech from Miami University for their valuable comments and suggestions to improve the article. Finally, the authors would like to express their gratitude to the European Commission for funding the Elmaa project (INCO-CT-2005"-015410).
REFERENCES
Abu-Ajamieh, M., 1967, Quantitative assessment of the groundwater potential of the Rijam formation in the Jafr basin: Amman-Jordan, Technical report, Natural Resources Authority, 75 pp. [ Links ]
Abu-Saleem, A., 2010, Estimation of Water Balance Components in the Hasa Basin with GIS Based-WetSpass Model: Jordan, Al Balqa Applied University, MSc. thesis, 61 pp. [ Links ]
Abu-Saleem, A., Al-Zu'bi, Y., Rimawi, O., Al-Zu'bi, J., Alouran, N., 2010, Estimation of Water Balance Components in the Hasa Basin with GIS based WetSpass Model: Journal of Agronomy 9 (3),119-125. [ Links ]
Batelaan, O., De Smedt, F., 2001, WetSpass: A flexible, GIS based, distributed recharge methodology for regional groundwater modelling, in Gehrels, H., Peters, J., Hoehn, E., Jensen, K., Leibundgut, C., Griffioen, J., Webb, B., Zaadnoordijk, W-J. (eds.), Impact of Human Activity on Groundwater Dynamics: International Association of Hydrological Sciences, PublicationNo. 269, 11-17. [ Links ]
Batelaan, O., De Smedt, F., 2004, SEEPAGE, a new MODFLOW DRAIN Package: Ground Water, 42(4), 576-588. [ Links ]
Batelaan, O., De Smedt., F, 2007, GIS-based recharge estimation by coupling surface-subsurface water balances: Journal of Hydrology, 337, 337-355. [ Links ]
Batelaan, O., Wang, Z.M., de Smedt, F., 1996, an adaptive GIS toolbox for hydrological modeling, in Kovar, K., Nachtnebel, H.P. (eds.), Application of Geographic Information Systems in Hydrology and Water Resources Management: International Association of Hydrological Sciences, Publication No. 235, 3-9. [ Links ]
Batelaan, O., De Smedt, F., Triest, L., 2003, Regional groundwater discharge: Phreatophyte mapping, groundwater modeling and impact analysis of landuse change: Journal of Hydrology, 275, 86-108. [ Links ]
BGR 1989, The North Jordan resources Investigation Project. Amman Zarqa Basin Water Resources Study. Water Authority of Jordan (WAJ) , Inst. for Geosc. and Nat. (BGR), Amman, Jordan, 240 p. [ Links ]
De Smedt, F., Batelaan, O., 2001, The impact of landuse changes on the groundwater in the Grote Nete river basin, Belgium, in Ribeiro, L. (ed.), Future Groundwater Resources at Risk: Lisbon, Portugal, 151-158. [ Links ]
De Smedt, F., Yongbo, L., Gebremeskel, S., 2000, Hydrologic modelling on a catchment scale using GIS and remote sensed land use information, in Brebbia, C. (ed.), Risk Analyses II: WIT Press, Southampton, Boston, USA, 295-304. [ Links ]
De Vries, J. J., Simmers, I., 2002. Groundwater recharge: an overview of processes and challenges. Hydrogeology J., 10, 5-17. [ Links ]
El-Naqa, A., Hammouri, N., Khader, K., Al Taj, M., 2009, Integrated approach for groundwater exploration in Wadi Araba using remote sensing and GIS: Jordan Journal of Civil Engineering 1(2), 229-243. [ Links ]
Howard, Humphreys Ltd., 1984, Groundwater resources study in the Eshidyia area. Technical report submitted to the Hashemite Kingdom of Jordan, Natural Resources Authority, Amman, Jordan, 166 Pp. [ Links ]
Hunting Technical Services, Soil Survey and Land Research Centre, 1993, The Soils of Jordan. Ministry of Agriculture, National Soil Map and Land Use Project, Level 1: Reconnaissance Soil Survey (scale 1:250,000), 3, Amman, Jordan, 1 map. [ Links ]
Hunting Technical Services, Soil Survey and Land Research Centre, 1994, The Soils of Jordan. Ministry of Agriculture, National Soil Map and Land Use Project, Level 2: Semi Detailed Studies (scale 1:50,000), 3 volumes; Amman, Jordan, 1 map. [ Links ]
Japanese International Cooperation Agency (JICA), 1990, Water resources study of the Jafr basin: Final Report, Amman, Jordan, 522 pp. [ Links ]
Jarvis, A., H.I. Reuter, A. Nelson, E. Guevara, 2008, Hole-filled SRTM for the globe Version 4, available from the CGIAR-CSI SRTM 90m Database (http://srtm.csi.cgiar.org). Accessed March 2012. [ Links ]
Jordanian Meteorological Department (JMD), 2005, Meteorological data, Amman, Jordan, <http://met.jometeo.gov.jo/jometeo/e_main> [ Links ]
Ministry of Water and Irrigation Water (MWI), 2004, Groundwater Management Policy: Amman, Jordan, Government of Jordan, 3-12. [ Links ]
National Water Master Plan (NWMP), 2004, Groundwater Resources: Volume VI, Ministry of Water and Irrigation, Amman, Jordan 350 pp. [ Links ]
Serrano, S., 2010, Hydrology for Engineers, Geologists, and Environmental Professionals: An Integrated Treatment of Surface, Subsurface, and Contaminant. HydroScience, Incorporated, 590 pp. [ Links ]
Wang, Z., M, Batelaan, O., De Smedt, F., 1997, A distributed model for water and energy transfer between soil, plants and atmosphere (WetSpa): Phys. Chem. Earth, 21(3), 189-193. [ Links ]
Waterloo Hydrogeologic Inc., 2006, Visual MODFLOW v.4.2. A Schlumberger Company, Waterloo, Ontario, Canada, <www.waterloohydrogeologic.com> [ Links ]

