


Services on Demand
Journal
Article
 English (pdf)
 Article in xml format
 Article references
 Send this article by e-mail
Indicators
-
 Cited by SciELO
 -
 Access statistics
Related links
-
 Similars in
SciELO
Similars in
SciELO
Share

 Permalink
Revista mexicana de ciencias geológicas
On-line version ISSN 2007-2902Print version ISSN 1026-8774
Rev. mex. cienc. geol vol.29 n.3 Ciudad de México Dec. 2012
Numerical reconstruction of the "Pómez Ezequiel Montes" Plinian fallout deposit: advantages in the use of numerical models for the reconstruction of fallout deposits from past eruptions
Reconstrucción numérica del depósito de caída pliniano "Pómez Ezequiel Montes": ventajas del uso de modelos numéricos en la reconstrucción de depósitos de caída de erupciones pasadas
Rosanna Bonasia*, Gerardo Carrasco-Núñez, and Pablo Dávila-Harris
Centro de Geociencias, Universidad Nacional Autónoma de México, Campus Juriquilla, 76230 Querétaro, México. *rbonasia@geociencias.unam.mx
Manuscript received: March 29, 2012
Corrected manuscript received: July 4, 2012
Manuscript accepted: July 6, 2012
ABSTRACT
A simple semi-analytical model (HAZMAP) for ash-fall deposit was applied to reconstruct the distribution of tephra deposits of the unit A of the SW lobe of the Pómez Ezequiel Montes Plinian eruption. This eruption, from the Amazcala caldera, represents one of the most important explosive events in the northern central sector of the Mexican Volcanic Belt where unit A is the thickest, more widely dispersed and well stratigraphically constrained fallout layer of this eruption. For this reason it represents a good candidate for the application of a semi-analytical model for the reconstruction of the isopach map and the eruptive parameters. The simulation results are in good agreement with estimations provided by other independent methods and were able to capture the actual deposit thickness and the effective total erupted mass, providing a closer approximation to more real eruptive parameters.
Key words: fallout deposit, Plinian eruption, HAZMAP, Pómez Ezequiel Montes, Amazcala caldera, Mexico.
RESUMEN
Mediante la aplicación de un modelo simple semi-analítico (HAZMAP) para un depósito de cenizas de caída fue posible reconstruir la distribución de los depósitos de tefra de la unidad A del lóbulo SO correspondiente a la erupción Pliniana de la Pómez Ezequiel Montes. Esta erupción, que ocurrió en la caldera de Amazcala, representa uno de los eventos explosivos más importantes en el sector norte de la Faja Volcánica Mexicana en donde la unidad A de esta erupción, es el depósito más grueso, de mayor dispersión y mejor delimitado estratigráficamente. Por esta razón se presenta como un buen candidato para la aplicación de un modelo semi-analítico que permita reconstruir el mapa de isopacas y los parámetros eruptivos. Los resultados de la simulación están en concordancia con las estimaciones proporcionadas por otros métodos independientes y permiten una mejor estimación del espesor del depósito, la masa total efectiva de la erupción y los parámetros eruptivos.
Palabras clave: depósito de caída, erupción Pliniana, HAZMAP, Pómez Ezequiel Montes, caldera de Amazcala, México.
INTRODUCTION
The Amazcala caldera is one of the several calderas that have been recognized in the central sector of the Mexican Volcanic Belt (MVB). The geological evolution of this caldera, which involves the formation and deposition of ignimbrites, domes associated with the caldera's ring, a central dome and widespread pumice ash-fall deposits, was first described by Aguirre-Díaz and López-Martínez (2001). These fall deposits were named the Pómez Ezequiel Montes (PEM, Aguirre-Díaz and López-Martínez, 2001). This is a widespread stratigraphic marker that correlate to the unit named Querétaro Volcaniclastics in the stratigraphy defined by Alaniz-Álvarez et al. (2001). A detailed strati-graphic framework and, eruptive guide lines of the eruption that produced the PEM deposits, were reconstructed by Hernández et al. (2009).
The PEM is a late Miocene sequence, which is considered the product of one of the most important explosive events in the northern sector of the MVB with thick, well-preserved deposits that allow a precise stratigraphic and chronological study. For this reason we selected this Plinian fall layer as a good case for the application of a numerical model for the reconstruction of the isopach maps and the eruptive parameters.
In the last ten years the use of numerical models in volcanology has gained an outstanding importance. Semi-analytical and numerical models are useful to quantify the most important parameters of past eruptions by solving an inverse problem, if combined with the field study of eruptive products and deposits. Alternatively, they can be applied as a forward method in order to forecast the charecteristics of a future event.
Models that predict particle transport and deposition of fallout deposits can be grouped within two main categories: particle tracking models (PTM) and advection-diffusion models (ADM). PTM are Eulerian or Lagrangian models able to track the position of volcanic particles. On the other hand, ADM are Eulerian models based on the advection-diffusion-sedimentation (ADS) equation. Simples ADM, such as HAZMAP (Macedonio et al., 2005), the model used in this work, can only forecast ash accumulation on the ground and are mainly used for civil protection purposes.
In this study, we present the reconstruction of the unit A of the SW lobe of the PEM fallout deposit, by using the HAZMAP model.
Section 2 describes the stratigraphy and textural characteristics of the PEM fallout deposit. Section 3 briefly describes the advection-diffusion-sedimentation model for volcanic ash dispersal (HAZMAP). In the first part of Section 4 we describe the inversion method used to reconstruct some physical parameters of the eruption; in the second part of Section 4, we reconstruct the fallout deposit. Finally, in Section 5, we discuss the results we obtained by using the HAZMAP model and compare them with the values calculated by Hernández et al. (2009) by using independent methods, based on the analysis of the field data.
In general, the simulation can be considered a good reliability test for the Hernández et al. (2009) total mass and column height reconstruction.
STRATIGRAPHICAL AND TEXTURAL CHARACTERISTICS OF THE PEM FALLOUT DEPOSIT
The Pómez Ezequiel Montes (PEM, Aguirre-Díaz and López-Martínez, 2001) is a late Miocene sequence of fallout deposits associated with the formation of the Amazcala caldera, 30 km NE of Querétaro city, central Mexico (Figure 1).
The PEM is a stratified sequence of fallout deposits intercalated with sporadic thin pyroclastic surge layers, a paleosol and reworked layers. The whole sequence is very thick (32 m in the SE type locality) and widely distributed along two main dispersal axes, oriented to SW and SE.
Hernández et al. (2009) found that the sequence of the SW lobe consists of four pyroclastic units (units A, C, E and G, in Figure 2) intercalated with reworked horizons (units B, D and F, in Figure 2). Unit C consists exclusively of fallout material, while units E and G present an alternated succession of surge and cross-stratified deposits. Units B, D and F consist of sub-rounded fragments supported by a fine ash matrix. According to Hernández et al. (2009), unit A, has a maximum thickness of 7.7 m, and it is divided into three parts. The lower part consists of a cross-stratified coarse-ash layer. A massive layer of pumice-lapilli clasts consitutes the middle part. Finally, the top of unit A consists of stratified layers of clast-supported lapilli.
The SE oriented lobe is formed by 14 depositional units, nine of which are fallout deposits intercalated by surge layers, and five consisting of re-worked layers.
In this work we will focus only on reconstructing unit A of the SW lobe using a tephra sedimentation model, described in the next section. In fact, unit A is the only one that, according to Hernández et al. (2009), can be stratigraphically correlated. Moreover, unit A can be easily recognized in 11 stratigraphic sections, which are located at a distance of at least 5 km from the eruptive vent (Figure 1).
THE ADVECTION-DIFFUSION-SEDIMENTATION MODEL FOR VOLCANIC TEPHRA FALLOUT (HAZMAP)
For the reconstruction of the unit A of the SW lobe of the PEM fallout deposit we used the HAZMAP code (Macedonio et al., 2005). This model considers only the transport and deposition of lapilli and coarse ash, i.e., tephra particles from few millimeters up to 64 microns.
The HAZMAP model assumes that at a definite distance from the eruptive column, the dispersion and sedimentation of volcanic ash, are principally controlled by wind transport, turbulent diffusion and their terminal velocity (Armienti et al., 1988; Costa et al., 2006; Folch et al., 2009). The model considers also that wind field is horizontally uniform, turbulent diffusion is constant, and the vertical wind component, as well as the vertical turbulent diffusion are negligible (Armienti et al., 1988; Macedonio et al., 2005; Costa et al., 2006; Folch et al., 2009).
Under these hypothesis the concentration of particles of class j is described through the mass conservation equation (Armienti et al., 1988; Pfeiffer et al., 2005; Macedonio et al., 2005):

where Cj stands for concentration of particles class j, Ux, Uy are the components of the wind velocity vector, Kx, Ky are the turbulent diffusion coefficients (K=Kx=Ky, i.e. isotro-pic horizontal diffusion is assumed) and Vsj and Sj denote the terminal settling velocity and source term respectively. Equation (1) is solved by using a semi-analytical solution as described in Macedonio et al. (2005) and Pfeiffer et al. (2005). The source term, S, is described using a modified parameterization proposed by Suzuki (1983):

where S0 is the normalization constant, x0, y0 are the coordinates of the vent, t is time, δ is the Dirac's distribution (i.e. filiform and instantaneous release), H is the column height and A and λ are two empirical parameters introduced by Pfeiffer et al. (2005), which determine the position of the maximum concentration (located at H(A-1)/A) and how closely the mass is concentrated around the maximum (λ).
The HAZMAP model assumes that the eruption column is described as a vertical line. This parametrization constitute a simplification, which is only valid far from the vent, where the wind field is not perturbed by the ascending column (i.e., at a distance of few kilometers from the vent).
NUMERICAL RECONSTRUCTION OF THE PEM FALLOUT DEPOSIT
Physical parameters of the eruption and input data for the HAZMAP code
Input parameters required by HAZMAP were obtained by best-fit with field deposit data from Hernández et al. (2009). Fitting is performed using a least-squares method comparing measured and calculated deposit thicknesses (e.g., Pfeiffer et al., 2005; Costa et al., 2009; Bonasia et al., 2010).
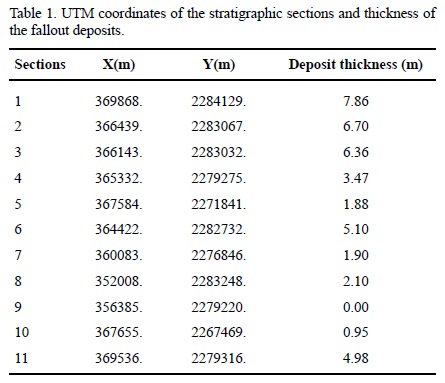
We selected all the 11 stratigraphic sections measured in Hernández et al. (2009), shown in Figure 1. UTM coordinates of the stratigraphic sections, as well as measured deposit thickness, are shown in Table 1. It is important to mention that the HAZMAP model can not be applied neither in the distal, nor in the proximal regions (i.e., in the order of aproximately half the height of the eruptive column). Since the mean column height value estimated by Hernández et al. (2009) is 23 km, selected proximal stratigraphic sections could be located at a distance of at least 11.5 km from the vent. Despite this, we selected also stratigraphic sections at < 10 km from the eruptive center because of the limited number of logged sections available. It is worth noting that this can represent a limitation in our best-fit calculations.
Selected grain-size distributions used in this work are shown in Figure 3.
The model parameters were defined by finding the minimum X2 in the following ecuation, wich defines the least squares:

where wi are weighting factors, N is the number of observed data, p is the number of free parameters, Yobs,i denote the observed ground load (kg/m2) and Ymod,i the values predicted by the model. The choice of the weighting factors, wi, in this equation, depends upon the distribution of the errors (see Costa et al., 2009). Generally the best weighting factor is the one that yields a random residual plot.
Parameters such as layer thicknesses, density, clast composition and grain-size distribution were taken from Hernández et al. (2009). The authors recognized four independent components: pumice, rhyolitic, andesitic, and oxidized lithics. For this work, we calculated a weighted average density of the finer grain-size classes of 2500 kg/ m2 using the percentage of each component measured by Hernández et al. (2009). For the larger grain-size classes (-4 and -3 φ) the density value was fixed to the density of the juvenile fragments (1100 kg/m2), which are the most abundant components among the coarser fragments.
Regarding the shape of the eruptive column, it is assumed, for this study, the empirical formula of Suzuki (1983) as modified by Pfeiffer et al. (2005), reported in Equation (2).
We fixed the column shape parameters A and λ in Equation (2) to the values 4 and 1 respectively, in order to take into account theoretical and empirical obeservations on buoyant plumes that prove that the ratio between the height of the neutral buoyancy level HB, and the maximum height, HT, is usually around 3/4.
Results of the best-fit method and reconstruction of the fallout deposit.
Best-fit between measured and calculated data is obtained by minimizing the x2 function reported in Equation (3).
To reconstruct the SW oriented unit A fallout deposit a unidirectional wind profile (Cornell et al., 1983; Carey and Sparks, 1986) was applied.
Maximum velocity at the tropopause (14 km) was found by best-fit with field data. The direction, also obtained through best-fit, was considered to be around the dispersal axis. Best results of the fitting procedure were obtained using the uniform weighting factor in the minimization of the least-squares equation (Equation (3)), which, as seen in Figure 4, satisfactory reproduce the proximal points within a distance shorter than the height of the eruption column. Results of the best-fit procedure are shown in Table 2 where, for comparison reasons, we show also Hernández et al. (2009) values obtained with classical methods.


The total mass of the eruption was estimated to be 1.7x 10¹² kg, with a column height of about 23 km. A diffusion coefficient value of 5000 m2/s was obtained.
The total grain-size distribution is a crucial eruptive parameter, and is essential in tephra dispersal modeling. The reconstructed total grain-size distribution of the unit A of the SW lobe is shown in Figure 5. It is worth noting that this grain-size distribution is depleted in coarse and fine particles. We neglect coarse particles because of the limitations of the model to the very proximal parts of the deposit, and we do not account for very fine ash because it is only deposited at distances >100 km, where the model is no longer valid.
All these values are the best-input parameters required by HAZMAP to reproduce the unit A of the SW lobe of the PEM deposit (see Figure 6).
DISCUSSION AND CONCLUSIONS
We used a methodology that solves an inverse problem, using a semi-analytical ash fallout model (HAZMAP), to reconstruct the unit A of the SW lobe of the PEM fallout deposit. The model we used describes the dispersion of tephra from a volcanic cloud due to transport by wind, diffusion by air turbulence, and sedimentation by gravity.
Reconstruction of the unit A of the SW lobe of the PEM fallout deposit using the uniform weighting factor in Equation (3), produced results in agreement with those of Hernández et al. (2009) using classical methods.
A maximum eruption column height of 23 km was predicted by the model, which is the same value calculated by Hernández et al. (2009), using the method of Carey and Sparks (1986). Concerning the wind direction, the main distribution axis is directed towards the southwest. A reasonable diffusion coefficient value of 5000 m2/s is obtained.
The total mass value that we calculate is 1.7x10¹² kg, very close to the value that Hernández et al. (2009) calculated with the method of Pyle (1989) and Fierstein and Nathenson (1992).
In summary, our simulations satisfactory reproduce the actual A fallout unit of the SW lobe of the PEM eruption, and are in good agreement with the isopachs mapped by Hernández et al. (2009) (see Figure 6).
It is worth noting that our value of total mass is slightly overestimated in comparison with the Hernández et al. (2009) value. According to these authors, calculation of the total volume was obtained using results from a single line, relative to the proximal slope only, in the method of Pyle (1989) and Fierstein and Nathenson (1992), because, although underestimated, is the one that best fit with the other parameters of the eruption column. On the other hand, in our best-fit calculations, we also took into accout distal deposits measured by Hernández et al. (2009). For this reason, it could be stressed that the difference between our result for total mass and the value obtained by Hernández et al. (2009), depends on the fact that the authors did not take into account the fine material deposited in the distal portions of the deposit, thus underestimating the total erupted volume.
The good reproduction of unit A of the PEM fallout deposit, shows the importance that a numerical model could play for the compilation of the characteristics of past eruptions.
Moreover, it is important to point out the role that the numerical models play in the construction of volcanic hazard maps. To estimate hazard from a volcano, if some parameters, such as wind velocity, source position, emission rate and initial cloud shape, can be estimated, the model can give a reliable final distribution and configuration of the deposit expected. This should be useful for hazard estimation as well as helpful in decision making around regions likely to be affected by volcanic activity.
ACKNOWLEDGMENTS
The authors would like to thank Arnau Folch and Juan Manuel Espindola Castro for constructive reviews of this manuscript.
REFERENCES
Aguirre-Diaz, G.J., Lopez-Martinez, M., 2001, The Amazcala caldera, Queretaro, Mexico, Geology and geocronology: Journal of Volcanology and Geothermal Research, 111, 203-218. [ Links ]
Alaniz-Álvarez, S.A., Nieto-Samniego, A.F., Reyes-Zaragoza, M.A., Orozco-Esquivel, M.T., Ojeda-García, A.C., Vassallo, L.F., 2001, Estratigrafía y deformación extencional en la región San Miguel de Allende-Queretaro, Mexico: Revista Mexicana de Ciencias Geológicas, 18(2), 129-148. [ Links ]
Armienti, P., Macedonio, G., Pareschi, M., 1988, A numerical model for simulation of tephra transport and deposition: application to May 18, 1980 Mount St. Helens eruption: Journal of Geophysical Research, 93(B6), 6463-6476. [ Links ]
Bonasia, R., Macedonio, G., Costa, A., Mele, D., Sulpizio, R., 2010, Numerical inversion analysis of tephra fallout deposits from the 472 AD sub-Plinian eruption at Vesuvius (Italy) through a new best-fit procedure: Journal of Volcanology and Geothermal Research, 189, 238-246. [ Links ]
Carey, S., Sparks, R., 1986, Quantitative models of the fallout and dispersal of tephra from volcanic eruption columns: Bulletin of Volcanology, 48, 109-125. [ Links ]
Cornell, W., Carey, S., Sigurdsson, H., 1983, Computer simulation and transport of the Campanian Y-5 ash: Journal of Volcanology and Geothermal Research, 17, 89-109. [ Links ]
Costa, A., Macedonio, G., Folch., 2006, A three-dimensional Eulerian model for transport and deposition of volcanic ashes: Earth and Planetary Science Letters, 241, 634-647. [ Links ]
Costa, A., Dell'Erba, F., Di Vito, M.A., Isaia, R., Macedonio, G., Orsi, G., Pfeiffer, T., 2009, Tephra fallout hazard assessment at Campi Flegrei caldera (Italy): Bulletin of Volcanology, 71(3), 259-273. [ Links ]
Fierstein, J., Nathenson, M., 1992, Another look at the calculation of tephra fallout volumes: Bulletin of Volcanology, 54, 156-167. [ Links ]
Folch, A., Costa, A., Durant, A., Macedonio, G., 2009, FALL3D: a computational model for transport and deposition of volcanic ash: Computer and Geoscience, 35(6), 1334-1342. [ Links ]
Hernández, J., Carrasco-Núñez, G., Aguirre-Díaz, G., 2009, Dinámica eruptiva de la "Pómez Ezequiel Montes" en la caldera Amazcala, centro de México: Revista Mexicana de Ciencias Geológicas, 26(2), 482-500. [ Links ]
Macedonio, G., Costa, A., Longo, A., 2005, A computer model for volcanic ash fallout and assessment of subsequent hazard: Computer and Geoscience, 31, 837-845. [ Links ]
Pfeiffer, T., Costa, A., Macedonio, G., 2005, A model for the numerical simulation of tephra fall deposits: Journal of Volcanology and Geothermal Research, 140, 237-294. [ Links ]
Suzuki, T., 1983, A theoretical model for dispersion of tephra, in Shimozuru, D., Yokoyama, I. (eds.), Volcanism: Physics and Tectonics: Terrapublication, Tokyo, 95-113. [ Links ]
Pyle, D., 1989, The thickness, volume and grainsize of tephra fall deposit: Bulletin of Volcanology, 51, 1-5. [ Links ]

