


Serviços Personalizados
Journal

Artigo
 Inglês (pdf)
 Artigo em XML
 Referências do artigo
 Enviar este artigo por email
Indicadores
 Citado por SciELO
 Links relacionados
-
 Similares em
SciELO
Similares em
SciELO
Compartilhar

 Permalink
Revista mexicana de ciencias geológicas
versão On-line ISSN 2007-2902versão impressa ISSN 1026-8774
Rev. mex. cienc. geol vol.28 no.1 Ciudad de México Abr. 2011
New tectonic discrimination diagrams for basic and ultrabasic volcanic rocks through log–transformed ratios of high field strength elements and implications for petrogenetic processes
Nuevos diagramas de discriminación tectónica para rocas volcánicas básicas y ultrabásicas por medio de relaciones log–transformadas de elementos de alto potencial iónico e implicaciones para procesos tectónicos
Surendra P. Verma1,* and Salil Agrawal2
1 Departamento de Sistemas Energéticos, Centro de Investigación en Energía, Universidad Nacional Autónoma de México, 62580, Temixco, Mor., México.
2 Department of Geology, University of Rajasthan, Jaipur 3002 004, India. *spv@cie.unam.mx
Manuscript received: March 1, 2010
Corrected manuscript received: August 25, 2010
Manuscript accepted: August 26, 2010
ABSTRACT
The statistically correct handling of compositional data requires log–ratio transformation whereas the multivariate technique of linear discriminant analysis (LDA) assumes a normal distribution of the transformed variables. In addition to other requirements, both these aspects were considered for proposing five new discriminant function diagrams based on log–ratios of five high–field strength elements – (TiO2)adj, Nb, V, Y, and Zr. A representative world database of 1877 analyses of basic and ultrabasic magmas from four tectonic settings of island arc, continental rift, ocean–island, and mid–ocean ridge, was used. After identifying discordant outliers in log–transformed ratios using single outlier tests, 1793 analyses proved to be normally distributed in terms of the following four variables: ln(Nb/(TiO2)adj), ln(V/(TiO2)adj), ln(Y/(TiO2)adj), and ln(Zr/(TiO2)adj). Use of LDA of the complete dataset of 1877 analyses divided into 1477 analyses for training set and 400 for testing set provided high success rates of 78.5–92.2% and 81.7–93.0% for the discrimination of the four tectonic settings based on the training and testing sets, respectively. However, using LDA of the normally distributed 1793 analyses divided into 1393 for training set and 400 for testing set, we obtained new diagrams that showed still higher success rates of 80.2–93.5% and 84.0–94.0%, respectively. The advantage of fulfilling the requirement of normal distributions of log–ratio variables resides in the observation that an overall net gain in success rates of 0.5–3.3% was achieved when the LDA was correctly applied to discordant–outlier–free log–transformed ratios (1793 analyses) than to the complete data set (1877 analyses). The application of these discrimination diagrams to ophiolites from Taitao Peninsula (southern Chile), Gabal Gerf complex (northeastern Africa), Jormua (northeastern Finland) and Macquarie Island (southwest Pacific) indicated tectonic setting of mid–ocean ridge, transitional between island arc and mid–ocean ridge, mid–ocean ridge and continental rift, respectively. Although only a few rock samples from a study of south–central Sweden could be identified as mafic, the present diagrams indicated an arc setting for this area. The application to three case studies from Turkey, being a country with highly complex geological history, suggested continental rift setting for Kula Quaternary basic volcanic rocks, inconclusive evidence for Jurassic volcanic rocks from eastern Pontides, arc setting for Tauride belt ophiolite, and continental rift setting for East Anatolian and Dead Sea fault zones, the latter application being based on probability calculations for each sample without any need to plot the samples in the discrimination diagrams. The use of normal discordant outlier–free samples of log–transformed ratios from each area in our new discrimination diagrams reinforced these conclusions for all areas, providing somewhat better discrimination in those cases in which such discordant observations were observed. We suggest that the new diagrams be used for tectonic discrimination of basic and ultrabasic rock samples that are confirmed to have discordant outlier–free normally distributed log–transformed variables. Basic and ultrabasic character of the rock samples could be determined from computer program SINCLAS and the discordant outliers of log–transformed variables from DODESYS, whereas the use of new diagrams proposed during 2004–2010 would be facilitated from program TecD.
Key words: discordant outliers, normal sample, tectonic setting, log–transformation, adjusted major–elements, ophiolites, Archaean, Turkey, Sweden.
RESUMEN
El manejo estadísticamente correcto de datos composicionales requiere transformaciones logarítmicas de relaciones de composiciones, mientras que la técnica multivariable de análisis discriminante lineal (LDA) supone una distribución normal de las variables transformadas. Adicionalmente a otros requerimientos, ambos aspectos fueron tomados en cuenta para proponer cinco nuevos diagramas de funciones discriminantes basados en relaciones–log de cinco elementos de alta fuerza de campo – (TiO2)adj, Nb, V, Y y Zr. Una base mundial representativa de datos de 1877 análisis de magmas básicos y ultrabásicos de cuatro ambientes tectónicos de arco de isla, rift continental, isla oceánica y cresta mid–oceánica, fue empleada. Después de identificar valores discordantes en las relaciones log–transformadas mediante pruebas de discordancia de tipo sencillo, 1793 análisis demostraron ser distribuidos en forma normal en términos de las cuatro variables siguientes: ln(Nb/(TiO2)adj), ln(V/(TiO2)adj), ln(Y/(TiO2)adj) y ln(Zr/(TiO2)adj). El uso de LDA con el conjunto de datos completos de 1877 análisis divididos entre 1477 análisis para el entrenamiento y 400 para la prueba proporcionó altos valores de éxito de 78.5–92.2% y 81.7–93.0% para la discriminación de los cuatro ambientes tectónicos basados en los conjuntos de entrenamiento y prueba, respectivamente. Sin embargo, usando LDA de los 1793 análisis distribuidos normalmente divididos entre 1393 análisis para el entrenamiento y 400 para el de prueba, obtuvimos diagramas nuevos que demostraron aún más altos valores de éxito de 80.2–93.5% y 84.0–94.0%, respectivamente. La ventaja de cumplir con el requerimiento de distribuciones normales de las variables log–transformadas reside en la observación de que se obtuvo una ganancia neta de 0.5–3.3% en los valores de éxito cuando el LDA fue aplicada correctamente a relaciones log–transformadas libres de valores discordantes (1793 análisis) en comparación con el conjunto completo de datos (1877 análisis). La aplicación de estos diagramas discriminantes a ofiolitas de la Península de Taitao (sur de Chile), complejo Gabal Gerf (noreste de África), Jormua (noreste de Finlandia) e Isla Macquarie (suroeste del Pacífico), indicó el ambiente tectónico de cresta mid–oceánica, transicional entre el arco de isla y cresta mid–oceánica, cresta mid–oceánica y rift continental, respectivamente. Aunque solamente pocas muestras de rocas de un estudio sobre Suecia sur–central pudieron ser identificadas como máficas, los diagramas propuestos indicaron un ambiente de arco para esta área. La aplicación a tres estudios de Turquía, siendo un país con un historial geológico sumamente complejo, sugirieron el ambiente de rift continental para las rocas volcánicas cuaternarias de Kula, evidencia inconclusa para rocas volcánicas jurásicas de Pontides oriental, ambiente de arco para ofiolitas de cinturón de Tauride y rift continental para zonas de este de Anatolia y las fallas del Mar Muerto, la última aplicación estuvo basada en los cálculos de las probabilidades para cada muestra sin la necesidad de graficar las muestras en los diagramas de discriminación. El uso de las muestras de relaciones log–transformadas libres de valores discordantes de cada área en nuestros nuevos diagramas discriminantes confirman estas conclusiones para todas las áreas, proporcionando una discriminación mejor en todos aquellos casos en donde se observaron estos valores discordantes. Sugerimos que los diagramas nuevos sean usados para la discriminación tectónica de muestras de rocas básicas y ultrabásicas con una distribución normal de las variables log–transformadas, libres de valores discordantes. La naturaleza básica y ultrabásica de las muestras a utilizar deberá ser determinada con el programa computacional SINCLAS y los valores discordantes de las variables log–transformadas con el programa DODESYS, mientras que el uso de los nuevos diagramas propuestos entre 2004 y 2010 podría ser facilitado por el programa TecD.
Palabras clave: valores desviados, muestra normal, ambiente tectónico, transformación–log, elementos mayores ajustados, Ofiolitas, Arqueano, Turquía, Suecia.
INTRODUCTION
Discrimination diagrams constitute a widely used complementary technique to other petrological methods for interpreting compositional data (Pearce and Cann, 1973 cited ~1750 times according to the Institute for Scientific Information database as confirmed on August 8, 2010, with ~275 cites during the last five years; Pearce and Gale, 1977 with ~150 cites, of which ~30 are recent cites; Pearce et al., 1977, 1984 with ~175 and ~2050 cites, respectively, of which ~20 and ~670 are recent cites; Wood, 1980 with ~540 cites, of which ~200 are recent cites; Shervais, 1982 with ~685 cites, of which ~200 are recent cites; Cabanis and Lecolle, 1989 with ~150 cites, of which ~70 are recent cites; Rollinson, 1993; Verma, 2000, 2010; Agrawal et al., 2004, 2008, with ~15 and ~20 recent cites, respectively; Verma et al., 2006 with ~10 recent cites). Such diagrams have been in use practically since the advent of plate tectonics. More importantly, they are still in wide use even today (see the recent cites mentioned above). J.A. Pearce and J.R. Cann, with their papers (Pearce and Cann, 1971, 1973), were the pioneers in this adventure. A large number of diagrams have been proposed that vary from binary and ternary to complex discriminant function types (Rollinson, 1993; Verma, 2010).
There are several inherent requirements for good discrimination diagrams (Agrawal and Verma, 2007); these are representative databases, objective probability based boundaries replacing those drawn by eye, correct statistical treatment of compositional data, and the immobile nature of chemical elements used. Major advancement has been achieved through extensive, carefully validated databases (Agrawal et al., 2004), objective boundaries (Agrawal, 1999), linear discriminant analysis of natural logarithm–ratio transformed compositional data (Verma et al., 2006), and use of relatively immobile elements (Agrawal et al., 2008).
Recently, Vermeesch (2007), Sheth (2008), and Verma (2010) have evaluated most existing discrimination diagrams. It appears that the newer discriminant function diagrams (Agrawal et al., 2004, 2008; Verma et al., 2006) obtained from linear discriminant analysis (LDA) work well (Sheth, 2008; Verma, 2010), whereas the older bivariate and ternary diagrams all plagued by erroneous treatment of compositional data (Aitchison, 1986; Agrawal and Verma, 2007; Verma, 2010) and generally show very low success rates. When success rates are higher, these diagrams then discriminate only two tectonic settings under the broad names of "within–plate" and "plate margin".
In spite of these recent advances achieved during 2004–2008 (see Verma, 2010), newer diagrams based on immobile elements that could be easily determined by conventional analytical techniques such as x–ray fluorescence spectrometry, are still required. Correct application of LDA is another requirement. LDA implicitly requires that the individual variables (log–transformed ratios used in the present study) be normally distributed. With these additional requirements in mind, we developed a set of five new discriminant function discrimination diagrams that use natural logarithm–ratios of five high–field strength elements (TiO2)adj, Nb, V, Y, and Zr for magmas from four tectonic settings of island arc, continental rift, ocean–island, and mid–ocean ridge. The subscript adj refers to adjusted data as explained in the following section. The elements Ti, Nb, Y, and Zr are generally classified as high–field strength elements (e.g., Rollinson, 1993). Nevertheless, although V is classified as a transition metal, it can also be considered as a high–field strength element because of its high charge (generally +5) and small ionic radius (e.g., Shannon and Prewitt, 1969).
DATABASE AND LINEAR DISCRIMINANT ANALYSIS (LDA)
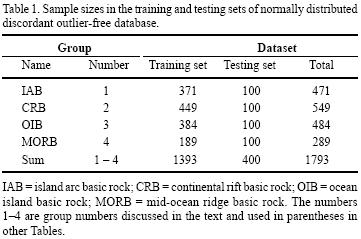
The database used for this work was a modified and completed version of those used by Verma et al. (2006), Agrawal et al. (2004, 2008), and Verma (2010). Because full description of the compiled locations and references can be obtained from these papers and to keep the present paper relatively short, we have restrained from giving more details in the present work. Nevertheless, we provide here a list of the complete dataset of basic and ultrabasic rocks as randomly divided into training and testing sets (see the electronic supplement to this paper). These are reproduced in Tables A1 (1477 analyses) and A2 (400 analyses), respectively.
The need to objectively divide the database into training and testing sets arises from the fact that in all statistical analyses leading to new development, it is desirable to have an independent unbiased estimate of their overall success or success rates. The statistical analysis of a part of the samples (called training set) provides such an estimate, but the randomly selected remaining samples (called testing set) give us an independent, unbiased estimate of the results. Of course, the future applications to statistical samples of the entire population will again be independent estimates of the quality of the new diagrams and the parameters used for constructing them.
We assigned a proper rock name and magma type (basic or ultrabasic) to each compiled rock sample following the IUGS volcanic rock classification scheme (Le Bas et al., 1986, Le Bas, 2000), using the computer program SINCLAS (Verma et al., 2002, 2003) under the Middlemost (1989) option for Fe–oxidation adjustment. This implicitly requires that complete chemical analysis involving all 10 major oxides be available for a rock sample to be qualified for inclusion in our database even if we are not using all major–elements in our diagrams. The major–element composition after SINCLAS processing is identified by the subscript adj added to each major–oxide name. The use of SINCLAS emphasizes the basic idea of initially complying with the closed space of 100% for all ten major–element variables (including both Fe–oxidation varieties as determined by SINCLAS), but without volatiles and trace–elements, and thus standardize the use of TiO2 as (TiO2)adj in the new diagrams. This also requires that for any given sample all ten major–element variables should be available for their use in the new discrimination diagrams irrespective of the fact that only (TiO2)adj is explicitly used.
Basic requirements for constructing the database were that the tectonic setting should be explicitly and unambiguously described by the author(s) and (SiO2)adj ≤ 52% after SINCLAS processing. Basic (and ultrabasic) rock samples were assigned to one of the four classes or tectonic settings of island arc (IAB; group no. 1), continental rift (CRB; group no. 2), ocean–island (OIB; group no. 3), and mid–ocean ridge (MORB; group no. 4). Samples from doubtful and complex settings were excluded from the database.
Only the so–called immobile elements were considered, and several combinations of these elements were evaluated through exploratory discriminant analysis. The combination of five high–field strength elements (TiO2)adj, Nb, V, Y, and Zr demonstrated the overall best performance.
Following the recommendation of Aitchison (1986) for correct statistical treatment of compositional data, the LDA was carried out on four natural logarithm–transformed ratios of these five elements using (TiO2)adj as the common denominator. LDA requires that complete information of these components for the analyses be available in this multivariate technique (e.g., Agrawal and Verma, 2007). Therefore, samples with complete major–element analysis (all ten oxides from (SiO2)adj to (P2O5)adj, including the two Fe–oxidation varieties) and the four trace–elements (Nb, V, Y, and Zr) were separated from the database for further analysis. Our database constituted a total of 1877 analyses (Tables A1 and A2 in the electronic supplement).
The other basic requirement of LDA is that the parameters used in the statistical analysis of the samples for a given tectonic setting represent a normal distribution (e.g., Morrison, 1990), which was attained by processing the four log–transformed ratios 1n(Nb/(TiO2)adj), 1n(V/(TiO2)adj), 1n(Y/TiO2)adj), and 1n(Zr/(TiO2)adj), for possible discordant outliers (Barnett and Lewis, 1994; Verma, 1997, 2005), using computer program DODESSYS (S.P. Verma and L. Díaz–González, manuscript in preparation) at 99% confidence level. This program is based on new, precise and accurate critical values for discordancy tests (Verma and Quiroz–Ruiz, 2006a, 2006b, 2008; Verma et al., 2008). A total of 84 analyses (< 4.5%) from the four tectonic settings were identified as discordant (see Table A3 in the electronic supplement); the remaining (1793 analyses) were considered in the final LDA and new discriminant function diagrams. The discordant nature of log–ratio variables in a few samples (< 4.5% of all complied samples) more likely implies the role of sampling (field sampling as well as representativity of very small sample mass fractions to be analyzed) and analytical (calibration as well as "unknown" sample measurement) errors. Unfortunately, this cannot be fully ascertained because most published papers do not report details on all these errors, at least not individually for each sample. Therefore, given the requirement of LDA regarding normality of log–ratio transformed variables, it would be best to use discordant outlier–free samples in this statistical analysis. Nevertheless, we stress that for LDA the log–transformed ratio variables, and not the crude compositional variables, must be discordant outlier–free normal samples.
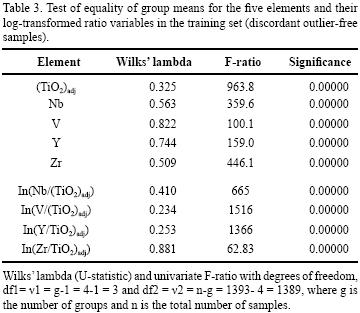
The available discordant outlier–free data, comprising these 1793 analyses, were randomly divided into training and testing sets (Table 1). A synthesis of these data pertinent to LDA is included in Table 2. All log–transformed ratios are negative because we have chosen the major–element (TiO2)adj as the denominator. Both negative and positive values could have been obtained had we chosen a trace element as the denominator. A qualitative comparison of log–transformed mean ratios reveals that CRB and OIB show rather similar mean values, but generally different from both IAB and MORB, the latter are characterized by some differences between their chemical compositions. Table 3 gives the results of the tests of equality for these elements and their ratios. Both tests (Wilks' lambda < < 1 and F–ratio > > 1) show that there are statistically significant differences among the four tectonic groups at an extremely low significance level (see the very small "Significance" values practically approaching zero for all variables in Table 3).
RESULTS OF THE DISCRIMINANT ANALYSIS
Success rates or correct discrimination of training and testing sets
The results of LDA performed on the training and testing sets (Table 2) are presented in Table 4 for both complete dataset (1877 analyses divided into 1477 training and 400 testing samples) as well as discordant outlier–free data (1793 analyses divided into 1393 training and 400 testing samples). The discriminant analysis was carried out five times, once for all four groups with CRB and OIB combined together and four times for all possible combinations of three groups at a time. Because we purposely wanted to better train the LDA than the testing operation, we maintained much greater number of samples in the training than the testing set (Table 4). In spite of this, for the complete dataset (1877 analyses) the overall success rates of 78.5–92.2% for the training set are comparable to (even slightly smaller than) 81.7–93.0% obtained for the testing set (see Overall % for B process in Table 4). Similarly, LDA of the normally distributed outlier–free dataset (1793 analyses) the overall success rates of 80.2–93.5% and 84.0–94.0% were obtained for the training and testing sets, respectively (see Overall % for C process in Table 4).
An alternative to the approach of subdividing the dataset into training and testing sets might be a method called "Leave one out", which consists of using all but one sample for the training set and checking the sole sample left out for its correct or incorrect discrimination. In this method, all samples –one at a time– are left out, and the success rates are estimated from all of them in this objective way. The final LDA results can then be reported for all samples from a database, without excluding any of them.
The advantage of log–ratio transformation (correct statistical treatment) in comparison with the use of crude compositional data (incorrect statistical treatment; Aitchison, 1986; Agrawal and Verma, 2007) has already been well documented by Verma et al. (2006) and Agrawal et al. (2008). The latter authors also commented on the advantage of combining CRB and OIB settings as a single group in the first discriminant analysis as compared to dealing them separately as done earlier by Agrawal et al. (2004) and Verma et al. (2006).
Here we document the advantage of fulfilling the basic requirement of normal distributions of log–transformed variables. In Table 4, the rows marked B are for original complete dataset whereas those marked C are for discordant–outlier–free dataset. There is an overall net gain in success rates of 0.5–3.3% when the LDA is correctly applied to discordant–outlier–free log–transformed ratios (see the last column in Table 4).
Good understanding of correct as well as incorrect discrimination by LDA can be achieved from Table 5, in which actual number and percentages are reported for all 1793 samples in our database. The testing set samples (400 analyses) are plotted in the five discriminant function discrimination diagrams (Figure 1a–1e); the training set samples (being too numerous, 1393 analyses) are not shown in Figures, but their results are summarized in Table 5. Four of the five diagrams apply for a given tectonic setting. The success rates for IAB vary from 85.2–98.6% for training set and 88–99% for testing set, with the incorrect discrimination mainly as MORB (13.5–14.0% and 11%, respectively, for training and testing sets). The highest rates of about 99% (correct discrimination) for both training and testing sets of IAB are obtained for Figure 1b, in which MORB setting is absent (see Table 5). When CRB and OIB settings are combined together (Figure 1a), these samples show very high success rates of 94–99.5%, with slightly greater mis–discrimination of CRB as MORB in comparison with CRB as IAB (Table 5). Such high correct discrimination (95.3–99.2%) was also obtained when these settings were not present together in a diagram (viz., Figure 1c, 1d; Table 5). However, when both settings were present as in Figure 1b, 1e, the correct discrimination was less (73–86%). Finally, MORB samples were very efficiently discriminated (93–96.3%), with the mis–discrimination mainly as CRB or IAB.
The equations for computing the DF1 and DF2 functions (x– and y–axes) of Figure 1a–1e are given in Table 6; note in these equations (TiO2)adj from SINCLAS should be used instead of actually measured, crude, unadjusted TiO2. In all diagrams (Figure 1a–1e), including Figure 1a, we are dealing with three groups at a time. Therefore, the two functions (DF1 and DF2) together account for 100% of between–groups variance in all the above three–groups at a time analyses. Finally, we note that these diagrams (Figure 1a–1e) are easy to reproduce, because the boundaries are clearly specified by their coordinates in each of them (see explanation of Figure 1).
Probability based boundaries and petrogenetic models
As ascertained by Agrawal (1999), the boundaries in diagrams created by LDA are based on probability calculations. These boundaries represent about 50% (0.50) probability (see boundaries shown by solid lines in Figures 1 and 2) when they separate two fields or tectonic settings, but as one approaches the triple point (intersection of three boundaries), the probability reaches to about 33.3% for any given field. We have calculated the probability for other areas of the diagrams and have drawn probability based boundaries for 70% and 90% (see green dashed and blue long–dashed boundaries in Figure 2a–2e). It is interesting to note that the probability to belong to a certain group increases very rapidly as we move away from the discrimination boundaries (solid blank lines) into a given field.
For illustration purposes, group–centroids for the four tectonic groups from our database as well as average compositions of high–MgO (MgO > 7%, an arbitrarily chosen value for this subdivision; the use of any other MgO for this subdivision will not change any of the conclusions) and low–MgO samples (up to 7%) were plotted in Figure 2a–2e. These compositions plot close to the discrimination boundaries. We also computed the effects of fractional crystallization (FC) of common minerals (olivine, orthopyroxene, clinopyroxene, plagioclases, garnet and amphiboles), along with the partition coefficient values from Torres–Alvarado et al. (2003). In all cases, the FC vectors remain within the designated tectonic field for degrees of fractional crystallization (f) of up to 0.15 – a reasonable maximum value of f to maintain the rock type to basic variety. With greater degrees of f, the rock types may change to intermediate magmas, for which these diagrams should be used with caution although our earlier discriminant function diagrams (Verma et al., 2006) have been successfully used for charnockites–magmas with intermediate SiO2 values (Rajesh 2007). On the other hand, the diagrams proposed by Verma et al. (2006) and Agrawal et al. (2004, 2008) were unsuccessful for intermediate magmas from central Mexico (Rodriguez–Ríos and Torres–Aguilera, 2009; S.P. Verma, unpublished results).
For modeling partial melting processes, we added in Figure 2a–2e average compositions of depleted MORB mantle (DM of Xu et al., 2005; see also, Salters and Stracke, 2004) and bulk silicate earth (BSE of McDonough and Sun, 1995). Both sources lie in the IAB field (Figure 2a–2e). This observation has important bearing on the use of these discrimination diagrams–they should, in principle, not be used for source rocks; they are meant for the discrimination of magmas resulting from partial melting of source rocks. After all, the discrimination boundaries result from LDA of magmatic rock samples compiled from all over the world, and not from cumulates or source rocks. It is possible that the diagrams work consistently for cumulates or source rocks, but the conclusions drawn from magmas should be given more weight when the two results do not fully agree.
Batch partial melting models were calculated for DM source corresponding to 0–15% of olivine, orthopyroxene, or clinopyroxene individually and for 0–5% of plagioclases, garnet and amphiboles, which is not a realistic process. For a realistic process of partial melting of DM and BSE sources with combined 0–30% melting of olivine, orthopyroxene and clinopyroxene (in the proportion of 50:25:25, respectively), the thick solid pink curves show that the partial melts of CRB, OIB and MORB tectonic types can be generated depending on the degree of melting. Low degrees of melting favor melts of CRB and OIB types, whereas higher degree melts are of MORB types.
Probability calculations for individual samples
We briefly present the procedure to estimate probability for each given sample from the initial training and testing sets or the application databases, to belong to any of the tectonic settings in a given DF1–DF2 discriminant function diagram. Let us assume that a sample is characterized by df1s, df2s coordinates or scores in this diagram. First, the centroid or mean values for each discriminant function and for each group are calculated from the training set; let us denominate them as mdf1g1 and mdf2g1 for group 1, mdf1g2 and mdf2g2 for group 2, and mdf1g3 and mdf2g3 for group 3. Note that in the discrimination scheme (e.g., Figure 1a–1e), only three groups are discriminated at a time, including Figure 1a where CRB and OIB are treated as a single group. It is mandatory that the training set be used for this purpose, because the discrimination diagrams and the field boundaries are based on these data. These values are reported in Table A4 for all five diagrams.
These mean values are then used to estimate the squared distances of the sample under evaluation from the centroid of each group as follows:

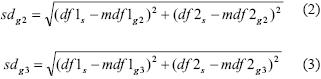
New functions sg1, sg2, and sg3 based on these squared distances for that particular sample, are then computed as follows:
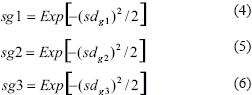
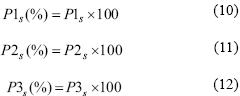
Finally, the probabilities for belonging to each of three groups, P1s, P2s and P3s, are then calculated from the above parameters as follows:
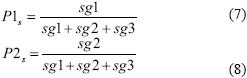
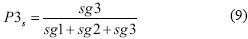
Although the probabilities are generally referred to as fractional numbers, we may also express them in percentage to establish analogy with the success rates (referring to individual samples) as follows:
These calculations must be repeated five times to obtain probabilities for all five discrimination diagrams. The probability estimates thus obtained can be directly used to assign any given sample to a tectonic setting without any need to plot the data in discrimination diagrams. Simply the sample is assigned to the tectonic setting showing the highest probability. Thus, a set of samples from any given area under study can be easily counted for their highest probabilities and the success rates can be calculated.
Before final counting of correctly discriminated samples and calculating success rates, we may also ascertain that all samples under study show normally distributed log–transformed ratios. Any discordant sample(s) can thus be excluded from the counting or success rate calculations.
APPLICATIONS TO DIFFERENT AREAS AND ROCKS AROUND THE WORLD
Although the IUGS classification is not ideal for older, probably altered rocks, the widely used alternative schemes (Floyd and Winchester, 1975, 1978; Winchester and Floyd, 1976, 1977) too do not provide a satisfactory classification scheme (Verma et al., 2010). Therefore, we used the IUGS classification scheme also for ascertaining the basic and ultrabasic nature of all samples used in our application examples. Furthermore, adjusted TiO2 values (Verma et al., 2002) were always used in all discrimination diagrams.
We clarify that for assigning rock names and ascertaining magma types to our application samples, we had to use the TAS classification (Le Bas et al., 1986; Le Bas, 2000; Verma et al., 2002, 2003), because no efficient diagrams exist in the literature to correctly classify altered volcanic rocks (Verma et al., 2010). Use of computer program SINCLAS (available on request to the first author SPV) is also recommended to ascertain the basic or ultrabasic nature of the samples and to estimate (TiO2)adj values that have to be involved in this work instead of crude estimates (measured TiO2 values).
Ophiolite discrimination
Recently, Pearce (2008) used Nb/Yb–Th/Yb and Nb/Yb–TiO2/Yb diagrams to classify ophiolites into four types: Contaminated MORB (C–MORB), Normal MORB (N–MORB), Enriched MORB (E–MORB), and Plume MORB (P–MORB). We compiled their C–MORB ophiolite example from Taitao Peninsula (Le Moigne et al., 1996), N–MORB from Gabal Gerf complex (Zimmer et al., 1995), and E–MORB from Jormua (Peltonen et al., 1996) and Macquarie Island (Kamenetsky et al., 2000). Then, we used our new discriminant function diagrams (Figure 3a – 3e) and summarized the results of discrimination in Table 7.
Taitao Peninsula of southern Chile is considered an example of a subducted ridge (3–5 Ma) on land (Le Moigne et al., 1996; Guivel et al., 2003; Lagabrielle et al., 2009). We will describe in more detail how to use our new discrimination diagrams for a given locality or region. The analyses presented by Le Moigne et al. (1996) will be used as an example. However, the use of normally distributed discordant outlier–free samples (facilitated by DODESSYS computer program) should be preferred; see below the section of "Correct statistical treatment of compositional data for application examples".
First, using SINCLAS computer program (Verma et al., 2002), we classified the samples into basic and ultrabasic magmas (10 samples) and intermediate magmas (16 samples). Because our diagrams should be used preferably for basic and ultrabasic rocks, the identity of magma types must be maintained. The basic and ultrabasic rocks were plotted in Figure 3a, which has three fields (IAB, CRB+OIB, and MORB), and shows that most samples plot in MORB field (9 out of 10; Table 7). Thus, this diagram clearly indicates a MORB setting for the Taitao samples. Now, these samples are evaluated in three of the other four diagrams. In this case, the diagram of IAB–CRB–OIB (Figure 3b), in which the indicated setting of MORB is not present, should be excluded from further consideration. In all the remaining three diagrams (Figure 3c–3e), a large proportion of these basic and ultrabasic rocks (from a total of 10 samples) plot in the MORB field (9, 9, and 10 samples, respectively in Figure 3c, Figure 3d, and Figure 3e; Table 7). Thus, after excluding the "unused" or "inapplicable" diagram (Figure 3b), all the four applicable diagrams suggest MORB setting for these samples. Incidentally, the same conclusion is reached from the intermediate magmas (16 samples) from Taitao Peninsula, because most (14 to 16) of these samples plot in the MORB field (Table 7). If this were not the case, the conclusion reached from basic and ultrabasic magmas should be considered as valid.
The present discrimination diagrams were used for pillow and sheeted dykes from Harga Zarga and Heiani of 600–700 Ma old Gabal Gerf ophiolite complex, northeastern Africa (Zimmer et al., 1995). Pearce (2008) classified these (a total of 23) samples as N–MORB. However, three of these samples proved to be of intermediate rocks and were excluded from our diagrams (Figure 3a–3e), which are based on 20 samples of basic rocks (Table 7). Nevertheless, our diagrams do not discriminate them as MORB setting; the samples are divided into MORB and arc settings, with somewhat greater number of samples plotting as IAB.
Our next example of ophiolites is for Jormua, northeastern Finland (Peltronen et al., 1996). These authors considered Jormua ophiolite as a unique fragment of Red Sea–type oceanic crust formed in a setting of continental break–up 1950 Ma ago. Thirty–six samples from early dikes and main basalt suite from this complex (Peltronen et al., 1996), being E–MORB of Pearce (2008), classified as basic and ultrabasic magmas (30 samples) and intermediate magmas (6 samples), plotted mainly (28 samples) or completely (6 samples), respectively, in the MORB field (Figure 3a,3c–3e; Figure 3b being the "inapplicable" diagram; Table 7), clearly establishing thus MORB setting for Jormua ophiolites. Continental rift setting envisioned by Peltronen et al. (1996) was not observed.
Finally, Kamenetsky et al. (2000) reported two groups of Miocene glassy rocks, which they called Group I (primitive) and Group II (differentiated), from "uplifted" crest of the Macquarie ridge on the Macquarie Island, southwestern Pacific. These rocks with unusual compositions were termed as E–MORB by Pearce (2008). Eighteen basic rock samples belonging to Group I and thirty–seven of Group II (also basic rocks with the exception of one sample of intermediate magma) had complete chemical analyses for our discrimination diagrams (Figure 3a–3e; Table 7). These rocks indicated a continental rift setting (Figure 3a–3c,3e, with Figure 3d being the "inapplicable" diagram), because most of them plotted in the CRB+OIB field (Figure 3a) or CRB field (Figure 3b,3c,3e; Table 7). Thus, these unusual compositions of basaltic glasses from the Macquarie Islands are more consistent with continental rift setting rather than MORB or OIB setting. Their designation as E–MORB by Pearce (2008) does not seem to be justified from our diagrams (see Verma, 2010 who showed that E–MORB magmas generally plot in the MORB field). Nevertheless, more work is required to clarify these discrepancies.
Mafic rock discrimination
Rutanen and Andersson (2009) reported geochemistry of mafic intrusive rocks from the Trans–Scandinavian igneous belt and Hedesunda igneous complex in the Fennoscandian shield of south–central Sweden. From several lines of evidence they inferred a continental arc setting for their samples. We used our present discrimination diagrams to evaluate their samples in Figure 4a–4e. Although these authors designated their rocks as mafic, chemically they represent magma of ultrabasic (one sample), basic (three samples), and intermediate (13 samples) types. Because our diagrams should be used for basic and ultrabasic magmas, the results are individually presented for basic+ultrabasic and intermediate rocks (Table 8). The basic and ultrabasic magmas (four samples) show consistently an arc setting, and thus support the conclusion of the original authors (Rutanen and Andersson, 2009). More samples of basic and ultrabasic rocks are required for confirmation of the tectonic setting of this area. On the other hand, although the intermediate magmas (13 samples) are almost equally divided between IAB and MORB settings, these results cannot be considered decisive, because our diagrams are not recommended to be used for differentiated magmas. Obviously, appropriate diagrams will have to be proposed for such magmas.
Discrimination of volcanic and ophiolitic rocks from Turkey
Turkey has had a very complicated geological and tectonic evolution, which makes this country fascinating for tectonomagmatic studies. Recently, Verma (2010) considered three case histories from Turkey: (i) Quaternary Kula volcanic rocks from western Anatolia (Tokcaer et al., 2005; Borsi et al., 1972; Ercan et al., 1985, 1997; Güleç, 1991; Richardson–Bunbury, 1996; Alici et al., 2002; Agostini, 2004; Innocenti et al., 2005; also F. Innocenti, unpublished data–compiled by S. Agostini); (ii) Jurassic volcanism in the eastern Pontides (Sen, 2007); and (iii) dikes from Tauride belt ophiolite (Lycian ophiolite) in southwestern Turkey (Celik and Chiaradia, 2008). Using major–element and trace–element (La, Sm, Yb, Nb, and Th) based discriminant function diagrams of Verma et al. (2006) and Agrawal et al. (2008), respectively, Verma (2010) obtained clearly continental rift setting for Kula, probably arc setting for Pontides, and undecisive results for Tauride belt ophiolites probably due to major–element mobility. For the latter, Agrawal et al. (2008) diagrams could not be used due to the absence of complete trace–element data required. It is therefore interesting to use these newer discriminant function diagrams for these cases.
The application to Kula basic and ultrabasic rocks fully confirmed continental rift setting (Figure 5a–5c, 5e; Figure 5d being the "inapplicable" diagram; Table 9). For eastern Pontides, the decision is not conclusive although from basic rocks it seems to be more in favor of MORB setting (Table 9). Finally, for basic rocks from Tauride belt ophiolite of southwestern Turkey, the new diagrams suggest an arc setting (Figure 5a–5d; Figure 5e being the "inapplicable" diagram; Table 9). The results for intermediate rocks, although not recommended to be used in this work, are consistent with an arc setting for this ophiolite suite.
For another case study, we compiled the data on 20 Quaternary basalt samples from the East Anatolian and Dead Sea fault zones of southern Turkey (Ceyhan–Osmaniye plain basalts and Hassa graben basalts; Polat et al., 1997). Instead of using the discrimination diagrams, we will illustrate the use of probability calculations (see equations 1–12 and Table A4) to discriminate the tectonic setting of these samples. The results are given in Table A5, which will be referred to in the following discussion.
The probabilities for the first set of discriminant functions corresponding to the IAB–CRB+OIB–MORB (groups 1–2+3–4) diagram (not shown) reported in the first part of Table A5 show that all 20 samples have the highest probability expressed in percent (90.986–99.999%) for the CRB+OIB field and extremely small or negligible for the other two fields (0.000–0.140% for IAB and 0.001–8.956% for MORB). Therefore, either CRB or OIB setting is likely.
The probabilities for the second set of discriminant functions (IAB–CRB–OIB; groups 1–2–3) for CRB are also highest (55.641–88.101%) for all 20 samples although the probabilities for OIB (11.899–0.44.359%) are not negligible; in fact, they are higher than the by–chance probability of 33.333% (35.827–44.359%) for 10 out of 20 samples. Nevertheless, CRB setting is more likely.
The probabilities for the third set of discriminant functions (IAB–CRB–MORB; groups 1–2–4) for CRB are also highest (85.933–100.000%) for all 20 samples. Because the competing OIB setting is missing from this diagram, the probabilities for CRB are very high and for the other two settings are extremely low (0.000–0.122% for IAB and 0.000–13.944% for MORB). Therefore, again from this third diagram CRB setting is more likely.
Thus, the fourth set of discriminant functions (IAB–OIB–MORB; groups 1–3–4) should be considered as inapplicable because the expected CRB setting is missing from this set. Nevertheless, the probabilities for OIB are high (58.419–100.000%) for all 20 samples and low for the other two settings. Only for one sample, the probability for MORB (41.277%) exceeds the by–chance probability of 33.333%.
Finally, the fifth set of discriminant functions (the CRB–OIB–MORB diagram; groups 2–3–4), provides high probabilities for both CRB (33.664–74.039%) and OIB (22.724–66.336%). For CRB these probabilities exceed the by–chance value of 33.333% for all 20 samples whereas for OIB this is so for only 16 out of 20 samples. For MORB all samples show very low probabilities (0.000–3.825%). On the other hand, in terms of the number of samples with the highest probabilities, nine samples indicate CRB setting whereas 11 are consistent with OIB setting. In this context, it is interesting to note that the average probability of all samples for CRB (51.13%) is slightly higher than that for OIB (48.49%). Discordant outlier analysis of complete dataset of 20 samples using DODESSYS did not resolve this complexity of the fifth diagram.
From the above discussion, we conclude that for East Anatolian and Dead Sea fault zones of southern Turkey, CRB setting is more likely. The tectonics of this region is very complex, because this fault zone connects two thrust faults (Polat et al., 1997). Nevertheless, given the complications indicated by the fifth diagram, we should probably have treated the Ceyhan–Osmaniye plain (10 samples) and Hassa graben (10 samples) as separate areas for applications of discrimination diagrams and applied DODESSYS to individual datasets and not the combined one.
Correct statistical treatment of compositional data for application examples
One way to improve and, in fact, correctly use the new discrimination diagrams would be to ensure that the log–ratio transformed compositional data for application are normally distributed. This can de achieved in a similar manner as for the initial world database by processing the data for each application separately for discordant outliers (Barnett and Lewis, 1994; Verma, 1997; Verma and Quiroz–Ruiz, 2006a, 2006b, 2008; Verma et al., 2008). We processed each data set (Tables 7, 8, 9) of the four log–transformed ratios, ln(Nb/TiO2)adj), ln(V/TiO2)adj), ln(Y/TiO2)adj), and 1n(Zr/(TiO2)adj) using DODESSYS from only single–outlier tests (Verma et al., 2009) at 99% confidence level. To avoid possible swamping effects, multiple–outlier tests (González–Ramírez et al., 2009) were not used. None or only a few (one to three) discordant outliers were observed in these statistical samples or different datasets.
For ophiolites (Table 7) from Taitao (basic and intermediate rocks), Jormua intermediate rocks, and Macquarie Island group I samples, one discordant observation was indicated by DODESSYS. For Jormua basic rocks two observations and for Macquarie Island group II rocks three observations were identified as discordant, whereas for Gabal Gerf no observation was discordant. The discordant observations were identified in Figure 3a, and the results of application of our new discrimination diagrams to the remaining data are summarized in Table 10. The conclusions remain the same as in the original Table 7 although with somewhat improved discrimination of samples. In other words, the discordant observations were generally the mis–classified samples in these cases (compare Tables 7 and 10) [8,9].
For application to basic and intermediate rocks from Sweden, no discordant outliers were observed, and therefore, the results of Table 8 and Figure 4 remained as such.
Finally, for each the three case studies from Turkey, one observation was inferred as discordant for Kula Quaternary basic volcanic rocks, Eastern Pontides intermediate rocks, and Tauride belt intermediate ophiolites. Two observations were discordant for Tauride belt basic ophiolites, and no observation was discordant for Eastern Pontides basic rocks. The results are summarized in Figure 5 and Table 11. Once again, the conclusions of Table 9 are reinforced from Table 11. The success rates (although not reported in Tables 7–11 [8, 9, 10] to keep the Tables simpler and because we are generally dealing with relatively small number of samples) can be easily calculated. They remain consistently high for most application examples, for which tectonic settings have been inferred in the present work.
The computer program DODESSYS for objectively identifying outliers as discordant is available on request to the first author (SPV).
Other applications of discriminant function diagrams
The new discriminant function diagrams have been widely used to decipher tectonic settings of several areas around the world. Thus, one or both sets of major–element based diagrams (Agrawal et al., 2004; Verma et al., 2006) were used in the following studies: South Andaman ophiolite suite (Srivastava et al., 2004); basaltic lavas from the central part of New Mexico, U.S.A. (Maldonado et al., 2006); intermediate and silicic charnockites from southern India (Rajesh, 2007); metabasic volcanic rocks from the Salumber area, Aravalli Supergroup, northwestern India (Shekhawat et al., 2007); Early Cretaceous alkaline–mafic–ultramafic igneous complex from Jasra, Shillong Plateau, northeastern India (Srivastava and Sinha, 2007); magmatic activity in southwestern margin of the East European Craton in Poland (Wiszniewska et al., 2007); Precambrian mafic magmatism in the Western Dharwar Craton, southern India (Ramakrishnan, 2009); ophiolites from Turkey (Verma, 2010); Carboniferous volcanic rocks from Junggar basin, China (Wang et al., 2010); and Miocene to Recent rocks from the central part of the Mexican Volcanic Belt (Verma, 2009; Torres–Alvarado et al., 2010). These latter authors also used Agrawal et al. (2008) trace–element based diagrams. Both major– and trace–element based sets of diagrams were used by Verma (2006) for deciphering the tectonic setting of volcanic rocks from the Los Tuxtlas volcanic field and by Verma (2010) for Turkey. Similarly, all sets of discrimination diagrams including the present ones, were further tested by Verma et al. (2011) from independent data sets from the four tectonic settings and then used to decipher the tectonic settings of the Mexican Volcanic Belt, Los Tuxtlas volcanic field, and Central American Volcanic Arc. The Agrawal et al. (2008) immobile trace–element based diagrams have been used for constraining geodynamic setting for the Mesoarchean (ca. 3075 Ma) pillow basalts, Archean, (ca. 2970 Ma – Ali Polat, personal communication, June 2010) anorthosite and associated meta–volcanic rocks, southwestern Greenland (Polat et al. 2009a, 2009b). For all these cases, the present set of new diagrams should prove useful in tectonomagmatic studies.
A computer program TecD by S.P. Verma and M.A. Rivera–Gómez is available on request to SPV that would facilitate the application of these diagrams to potential users.
CONCLUSIONS
A set of five new discriminant function based tectonomagmatic discrimination diagrams based on immobile elements has been successfully proposed. These diagrams have been used for several case studies, and in most cases, consistent results are obtained for the tectonic settings. These new diagrams should prove an excellent addition to the already existing (2004–2008) discriminant function diagrams based on major– as well as trace–elements. Our new diagrams are strictly meant to be used for basic and ultrabasic rocks. Their use for intermediate rocks requires caution and consistency of results with basic and ultrabasic rocks. Finally, normally distributed log–ratio transformed compositional data are to be preferred for use of our diagrams for tectonomagmatic discrimination of four tectonic settings (island arc, continental rift, ocean–island, and mid–ocean ridge). All programs –SINCLAS, DODESSYS, and TecD– are available on request to SPV; they are not only essential for the use of these new diagrams but also they should facilitate this endeavor.
ACKNOWLEDGEMENTS
Samuele Agostini and Dima Kamenetsky are thanked for providing the first author their unpublished compilations on Turkey and Macquarie Island, respectively. We are also grateful to Alfredo Quiroz–Ruiz for frequent help with computer maintenance. Although this work was initiated in 2008, it was concluded during 2009–2010 when the first author (SPV) was on sabbatical leave at the División de Ciencias Básicas e Ingeniería, Universidad Autónoma Metropolitana–Iztapalapa, occupying the Chair (Cátedra) "Ronald Tunstall Ackroyd". We are grateful to Ali Polat and an anonymous reviewer for constructive comments on an earlier version of this paper and the editor–in–chief Susana Alanis–Álvarez for handling this manuscript and communicating to us her unbiased editorial decision.
REFERENCES
Agostini, S., 2004, Il magmatismo post–collisionale dell'Anatolia occidentale: caratteri geochimici e petrologici, distribuzione spazio–temporale, quadro geodinamico (Post–collisional Western Anatolia magmatism: geochemical and petrologic characters, space–time distribution, geodynamic framework): Pisa, Italy, University of Pisa, Ph.D. thesis. [ Links ]
Agrawal, S., 1999, Geochemical discrimination diagrams: a simple way of replacing eye–fitted boundaries with probability based classifier surfaces: Journal of the Geological Society of India, 54, 335–346. [ Links ]
Agrawal, S., Verma, S.P., 2007, Comment on "Tectonic classification of basalts with classification trees" by Pieter Vermeesch (2006): Geochimica et Cosmochimica Acta, 71(13), 3388–3390. [ Links ]
Agrawal, S., Guevara, M., Verma, S.P., 2004, Discriminant analysis applied to establish major–element field boundaries for tectonic varieties of basic rocks: International Geology Review, 46, 575–594. [ Links ]
Agrawal, S., Guevara, M., Verma, S.P., 2008, Tectonic discrimination of basic and ultrabasic volcanic rocks through log–transformed ratios of immobile trace elements: International Geology Review, 50, 1057–1079. [ Links ]
Aitchison, J., 1986, The Statistical Analysis of Compositional Data: Chapman and Hall, London, 416 p. [ Links ]
Alici, P., Temel, A., Gourgaud, A., 2002, Pb–Nd–Sr isotope and trace element geochemistry of Quaternary extension–related alkaline volcanism: a case study of Kula region (Western Anatolia, Turkey): Journal of Volcanology and Geothermal Research, 115, 487–510. [ Links ]
Barnett, V., Lewis, T., 1994, Outliers in Statistical Data: Third edition, John Wiley & Sons, Chichester, UK, 584 p. [ Links ]
Bevington, P.R., Robinson, D.K., 2003, Data Reduction and Error Analysis for the Physical Sciences: McGraw–Hill, Boston, MA, USA, 320 p. [ Links ]
Borsi, S., Ferrara, G., Innocenti, F., Mazzuoli, R., 1972, Geochronology and petrology of recent volcanics in the eastern Aegean Sea (Western Anatolia and Lesbos Island): Bulletin Volcanologique, 36, 473–496. [ Links ]
Cabanis, B., Lecolle, M., 1989, Le diagramme La/10–Y/15–Nb/8: un outil pour la discrimination des séries volcaniques et la mise en évidence des processus de mélange et/ou de contamination crustale: Comptes Rendus Academie de Sciences Paris Serie II, 309, 2023–2029. [ Links ]
Celik, O.F., Chiaradia, M., 2008, Geochemical and petrological aspects of dike intrusions in the Lycian ophiolites (SW Turkey): a case study for the dike emplacement along the Tauride Belt Ophiolites. International Journal of Earth Sciences, 97, 1151–1164. [ Links ]
Ercan, T., Satir, M., Türkecan, A., Akyürek, B., Çevikbas, A., Günay, E., Ates, M., Can, B., 1985, Batý Anadolu Senozoyik volkanitlerine ait yeni kimyasal, izotopik ve radyometrik verilerin yorumu: Türkiye Jeoloji Kurumu Bülteni (Bulletin of the Geological Society of Turkey) 28, 121–136. [ Links ]
Ercan, T., Satir, M., Sevin, D., Türkecan, A., 1997, Bati Anadolu'daki tersiyer ve Kuvaterner Yasli Volkanik Kayaçlarda yeni yapilan radyometrik yas ölçumlerinin yorumu (Some new radiometric ages from Tertiary to Quaternary volcanic rocks from W. Anatolia (Turkey)): Maden Tetkik Arama Dergisi 119, 60 pp. [ Links ]
Floyd, P.A., Winchester, J.A., 1975, Magma type and tectonic setting discrimination using immobile elements: Earth and Planetary Science Letters, 27(2), 211–218. [ Links ]
Floyd, P.A., Winchester, J.A., 1978, Identification and discrimination of altered and meta–morphosed volcanic rocks using immobile elements: Chemical Geology, 21, 291–306. [ Links ]
González–Ramírez, R., Díaz–González, L., Verma, S.P., 2009, Eficiencia relativa de 15 pruebas de discordancia con 33 variantes aplicadas al procesamiento de datos geoquímicos: Revista Mexicana de Ciencias Geológicas, 26(2), 501–515. [ Links ]
Guivel, C., Lagabrielle, Y., Bourgois, J., Martin, H., Arnaud, N., Fourcade, S., Cotton, J., Maury, R.C., 2003, Very shallow melting of oceanic crust during spreading ridge subduction: origin of near–trench Quaternary volcanism at the Chile triple junction: Journal of Geophysical Research, 108, doi:10.1029/2002JB002119. [ Links ]
Güleç, N., 1991, Crust–mantle interaction in western Turkey: implications from Sr and Nd isotope geochemistry of Tertiary and Quaternary volcanics. Geological Magazine, 128, 417–435. [ Links ]
Innocenti, F., Agostini, S., Di Vincenzo, G., Doglioni, C., Manetti, P., Savascin, M.Y., Tonarini, S., 2005, Neogene and Quaternary volcanism in Western Anatolia: Magma sources and geodynamic evolution. Marine Geology, 221, 397–421. [ Links ]
Kamenetsky, V.S., Everard, J.L., Crawford, A.J., Varne, R., Eggins, S.M., and Lanyon, R., 2000, Enriched end–member of primitive MORB melts: petrology and geochemistry of glasses from Macquarie island (SW Pacific): Journal of Petrology, 41, 411–430. [ Links ]
Lagabrielle, Y., Le Moigne, J., Maury, R.C., Cotton, J., Bourgois, J., 2009, Volcanic record of the subduction of an active spreading ridge, Taitao Peninsula (southern Chile): Geology, 22(11), 515–518. [ Links ]
Le Bas, M.J., 2000, IUGS reclassification of the high–Mg and picritic volcanic rocks: Journal of Petrology, 41, 1467–1470. [ Links ]
Le Bas, M.J., Le Maitre, R.W., Streckeisen, A., Zanettin, B., 1986, A chemical classification of volcanic rocks based on the total alkali–silica diagram: Journal of Petrology, 27, 745–750. [ Links ]
Le Moigne, J., Lagabrielle, Y., Whitechurch, H., Girardeau, J., Bourgois, J., Maury C., R., 1996, Petrology and geochemistry of the Ophiolitic and Volcanic Suites of the Taitao Peninsula –Chile Triple Junction Area: Journal of South American Earth Sciences, 9, 43–58. [ Links ]
Maldonado, F., Budahn, J.R., Peters, L., Unruh, D.M., 2006, Geology, geochronology, and geochemistry of basaltic flows of the Cat Hills, Cat Mesa, Wind Mesa, Cerro Verde, and Mesita Negra, central New Mexico: Canadian Journal of Earth Sciences, 43(9), 1251–1268. [ Links ]
McDonough, W.F., Sun, S.–s., 1995, The composition of the Earth: Chemical Geology, 120, 223–253. [ Links ]
Middlemost, E.A.K., 1989, Iron oxidation ratios, norms and the classification of volcanic rocks: Chemical Geology, 77, 19–26. [ Links ]
Morrison, D.F., 1990, Multivariate statistical methods: McGraw–Hill, New York, 495 p. [ Links ]
Pearce, J.A., 2008, Geochemical fingerprinting of oceanic basalts with applications to ophiolite classification and the search for Archean oceanic crust: Lithos, 100, 14–48. [ Links ]
Pearce, J.A., Cann, J.R., 1971, Ophiolite origin investigated by discriminant analysis using Ti, Zr and Y: Earth and Planetary Science Letters, 12, 339–349. [ Links ]
Pearce, J.A., Cann, J.R., 1973, Tectonic setting of basic volcanic rocks determined using trace element analyses: Earth and Planetary Science Letters, 19, 290–300. [ Links ]
Pearce, J.A., Gale, G.H., 1977, Identification of ore–deposition environment from trace–element geochemistry of associated igneous host rocks: Geological Society, London, Special Publication, 7, 14–24. [ Links ]
Pearce, T.H., Gorman, B.E., Birkett, T.C., 1977, The relationship between major element chemistry and tectonic environment of basic and intermediate volcanic rocks. Earth and Planetary Science Letters, 36, 121–132. [ Links ]
Pearce, J.A., Harris, N.B.W., Tindle, A.G., 1984, Trace element discrimination diagrams for the tectonic interpretation of granitic rocks. Journal of Petrology, 25, 956–983. [ Links ]
Peltonen, P., Kontinen, A., Huhma, H., 1996, Petrology and geochemistry of metabasalts from the 1.95 Ga Jormua ophiolite, northeastern Finland: Journal of Petrology, 37, 1359–1383. [ Links ]
Polat, A., Kerrich, R., Casey, J.F., 1997, Geochemistry of Quaternary basalts erupted along the east Anatolian and Dead Sea fault zone of southern Turkey: implications for mantle sources: Lithos, 40(1–2), 55–68. [ Links ]
Polat, A., Appel, P.W.U., Fryer, B., Windley, B., Frei, R., 2009a, Trace element systematics of the Neoarchean Fiskenæsset anorthosite complex and associated meta–volcanic rocks, SW Greenland: Evidence for a magmatic arc origin: Precambrian Research, 175, 87–115. [ Links ]
Polat, A., Frei, R, Fryer, B., Appel, P.W.U., 2009b, The origin of geochemical trends and Eoarchean (ca. 3700 Ma) zircons in Mesoarchean (ca. 3075 Ma) ocelli–hosting pillow basalts, Ivisaartoq greenstone belt, SW Greenland: Evidence for crustal contamination versus crustal recycling: Chemical Geology, 268, 248–271. [ Links ]
Rajesh, H.M., 2007, The petrogenetic characterization of intermediate and silicic charnockites in high–grade terrains: a case study from southern India: Contributions to Mineralogy and Petrology, 154, 591–606. [ Links ]
Ramakrishnan, M., 2009, Precambrian mafic magmatism in the Western Dharwar Craton, southern India: Journal of Geological Society of India, 73(1), 101–116. [ Links ]
Richardson–Bunbury, J.M., 1996, The Kula volcanic field, western Turkey: the development of a Holocene alkali basalt province and the adjacent normal–faulting graben: Geological Magazine, 133, 275–283. [ Links ]
Rodriguez–Ríos, R., Torres–Aguilera, J.M., 2009, Evolución petrológica y geoquímica de un vulcanismo bimodal oligocénico en el Campo Volcánico de San Luis Potosí (México): Revista Mexicana de Ciencias Geológicas, 26(3), 658–673. [ Links ]
Rollinson, H.R., 1993, Using geochemical data: evaluation, presentation, interpretation: Longman Scientific Technical, Essex, 344 p. [ Links ]
Rutanen, H., Andersson, U.B., 2009, Mafic plutonic rocks in a continental–arc setting: geochemistry of 1.87–1.78 Ga rocks from south–central Sweden and models of their palaeotectonic setting: Geological Journal, 44, DOI: 10.1002/gj.1133. [ Links ]
Salters, V.J.M., Stracke, A., 2004, Composition of depleted mantle. Geochemistry Geophysics Geosystems, 5, Q05004, doi:10.1029/2003GC000597. [ Links ]
Sen, C., 2007, Jurassic volcanism in the eastern Pontides: Is it rift related or subduction related? Turkish Journal of Earth Sciences 16, 523–539. [ Links ]
Shannon, R.D., Prewitt, C.T., 1969, Effective ionic radii in oxides and fluorides: Acta Crystallographica, B25, 928–929. [ Links ]
Shekhawat, L.S., Pandit, M.K. Joshi, D.W., 2007, Geology and geochemistry of palaeoproterozoic low–grade metabasic volcanic rocks from Salumber area, Aravalli Supergroup, NW India. Journal of Earth System Science, 116 (6): 511–524. [ Links ]
Shervais, J.W., 1982, Ti–V plots and the petrogenesis of modern and ophiolitic lavas. Earth and Planetary Science Letters, 59, 101–118. [ Links ]
Sheth, H.C., 2008, Do major oxide tectonic discrimination diagrams work? Evaluating new log–ratio and discriminant–analysis–based diagrams with Indian Ocean mafic volcanics and Asian ophiolites: Terra Nova, 20, 229–236. [ Links ]
Srivastava, R.K., Sinha, A.K., 2007, Nd and Sr isotope systematics and geochemistry of plume related early Cretaceous alkaline–mafic–ultramafic igneous complex from Jasra, Shillong Plateau, Northeastern India. In: G.R. Foulger and D.M. Jurdy (Editors) The origins of melting anomalies: Plates, Plumes, and Planetary Processes: Geological Society of America Special Paper, 430, 815–830. [ Links ]
Srivastava, R.K., Chandra, R., Shastry, A., 2004, High–Ti type N–MORB parentage of basalts from the south Andaman ophiolite suite, India: Proceedings of Indian Academy of Sciences (Earth and Planetray Sciences), 113(4), 605–618. [ Links ]
Tokcaer, M., Agostini, S., Savascin, M.Y., 2005, Geotectonic setting and origin of the youngest Kula volcanics (western Anatolia), with a new emplacement model. Turkish Journal of Earth Sciences, 14, 145–166. [ Links ]
Torres–Alvarado, I.S., Verma, S.P., Palacios–Berruete, H., Guevara, M., González–Castillo, O.Y., 2003, DC_Base: a database system to manage Nernst distribution coefficients and its application to partial melting modeling: Computers & Geosciences, 29, 1191–1198. [ Links ]
Torres–Alvarado, I.S., Smith, A.D., Castillo–Román, J., 2011, Sr, Nd, and Pb isotopic and geochemical constraints for the origin of magmas in Popocatépetl volcano (Central Mexico) and their relationship with adjacent volcanic fields: International Geology Review, 53 (1), 84–115. [ Links ]
Verma, S.P., 1997, Sixteen statistical tests for outlier detection and rejection in evaluation of International Geochemical Reference Materials: example of microgabbro PM–S: Geostandards Newsletter. The Journal of Geostandards and Geoanalysis, 21(1), 59–75. [ Links ]
Verma, S.P., 2000, Geochemistry of the subducting Cocos plate and the origin of subduction–unrelated mafic magmas at the volcanic front of the central part of the Mexican Volcanic Belt. In: Delgado–Granados, H., Aguirre–Díaz, G., Stock, J.M., eds., Cenozoic Tectonics and Volcanism of Mexico: Boulder, Colorado. Geological Society of America Special Paper 334, Chapter 13, 195–222. [ Links ]
Verma, S.P., 2005, Estadística Básica para el Manejo de Datos Experimentales: Aplicación en la Geoquímica (Geoquimiometría): Universidad Nacional Autónoma de México, Mexico City, Mexico, 186 p. [ Links ]
Verma, S.P., 2006, Extension related origin of magmas from a garnet–bearing source in the Los Tuxtlas volcanic field, Mexico: International Journal of Earth Sciences, 95, 871–901. [ Links ]
Verma, S.P., 2009, Continental rift setting for the central part of the Mexican Volcanic Belt: A statistical approach: Open Geology Journal, 3, 8–29. [ Links ]
Verma, S.P., 2010, Statistical evaluation of bivariate, ternary and discriminant function tectonomagmatic discrimination diagrams: Turkish Journal of Earth Sciences, 19(2), 185–238. [ Links ]
Verma, S.P., Quiroz–Ruiz, A., 2006a, Critical values for six Dixon tests for outliers in normal samples up to sizes 100, and applications in science and engineering: Revista Mexicana de Ciencias Geológicas, 23(2), 133–161. [ Links ]
Verma, S.P., Quiroz–Ruiz, A., 2006b, Critical values for 22 discordancy test variants for outliers in normal samples up to sizes 100, and applications in science and engineering: Revista Mexicana de Ciencias Geológicas, 23(3), 302–319. [ Links ]
Verma, S.P., Quiroz–Ruiz, A., 2008, Critical values for 33 discordancy test variants for outliers in normal samples of very large sizes from 1,000 to 30,000 and evaluation of different regression models for the interpolation and extrapolation of critical values: Revista Mexicana de Ciencias Geológicas, 25(3), 369–381. [ Links ]
Verma, S.P., Torres–Alvarado, I.S., Sotelo–Rodríguez, Z.T., 2002, SINCLAS: standard igneous norm and volcanic rock classification system: Computers & Geosciences, 28, 711–715. [ Links ]
Verma, S.P., Torres–Alvarado, I.S., Velasco–Tapia, F., 2003, A revised CIPW norm: Schweizerische Mineralogische und Petrographische Mitteilungen, 83, 197–216. [ Links ]
Verma, S.P., Guevara, M., Agrawal, S., 2006, Discriminating four tectonic settings: five new geochemical diagrams for basic and ultrabasic volcanic rocks based on log–ratio transformation of major–element data: Journal of Earth System Science, 115(5), 485–528. [ Links ]
Verma, S.P., Quiroz–Ruiz, A., Díaz–González, L., 2008, Critical values for 33 discordancy test variants for outliers in normal samples up to sizes 1000, and applications in quality control in Earth Sciences: Revista Mexicana de Ciencias Geológicas, 25(1), 82–96. [ Links ]
Verma, S.P., Díaz–González, L., González–Ramírez, R., 2009, Relative efficiency of single–outlier discordancy tests for processing geochemical data on reference materials: Geostandards and Geoanalytical Research, 33(1), 29–49. [ Links ]
Verma, S.P., Rodríguez–Ríos, R., González–Ramírez, R., 2010, Statistical evaluation of classification diagrams for altered igneous Rocks: Turkish Journal of Earth Sciences, 19(2), 239–265. [ Links ]
Verma, S.P., Verma, S.K., Pandarinath, K., Rivera–Gómez, M.A., 2011, Evaluation of recent tectonomagmatic discrimination diagrams and their application to the origin of basic magmas in Southern Mexico and Central America: Pure and Applied Geophysics (in press). [ Links ]
Vermeesch, P., 2007, Tectonic discrimination diagrams revisited: Geochemistry Geophysics Geosystems, 7, doi:10.1029/2005GC001092. [ Links ]
Wang, L., Li, J.H., Shi, Y.M., Zhang, L.W., 2010, The identification and prediction of Carboniferous volcanic rocks in Dixi area, Junggar basin: Acta Petrologica Sinica, 26 (1), 242–254. [ Links ]
Winchester, J.A., Floyd, P.A., 1976, Geochemical magma type discrimination: application to altered and metamorphosed basic igneous rocks: Earth and Planetary Science Letters, 28, 459–469. [ Links ]
Winchester, J.A., Floyd, P.A., 1977, Geochemical discrimination of different magma series and their differentiation products using immobile elements: Chemical Geology, 20, 325–343. [ Links ]
Wiszniewska, J., Krzeminska, E., Dörr, W., 2007, Evidence of arc–related Svecofennian magmatic activity in the southwestern margin of the East European Craton in Poland: Gondwana Research, 12, 268–278. [ Links ]
Wood, D.A., 1980, The application of a Th–Hf–Ta diagram to problems of tectonomagmatic classification and to establishing the nature of crustal contamination of basaltic lavas of the British Tertiary volcanic province: Earth and Planetary Science Letters, 50, 11–30. [ Links ]
Xu, G., Frey, F.A., Clague, D.A., Weis, D., Beeson, M.H., 2005, East Molokai and other Kea–trend volcanoes: magmatic processes and sources as they migrate away from the Hawaiian hot spot. Geochemistry Geophysics Geosystems, 6, Q05008, doi: 10.1029/2004GC000830. [ Links ]
Zimmer, M., Kroner, A., Jochum, K.P., Reischmann, T., Todt, W., 1995, The Gabal Gerf complex: A Precambrian N–MORB ophiolite in the Nubian Shield, NE Africa: Chemical Geology, 123, 29–51. [ Links ]

