


Serviços Personalizados
Journal
Artigo
 Inglês (pdf)
 Artigo em XML
 Referências do artigo
 Enviar este artigo por email
Indicadores
-
 Citado por SciELO
 -
 Acessos
Links relacionados
-
 Similares em
SciELO
Similares em
SciELO
Compartilhar

 Permalink
Revista mexicana de ciencias geológicas
versão On-line ISSN 2007-2902versão impressa ISSN 1026-8774
Rev. mex. cienc. geol vol.27 no.2 Ciudad de México Ago. 2010
Sección especial
Statistical analysis of dynamical parameters of solar ejections observed from 1996 to 2006
Análisis estadístico de parámetros dinámicos de eyecciones solares observadas de 1996 a 2006
Guadalupe Muñoz1,2,3,*, Bernardo Vargas2, and José Luis López–López4
1 Escuela Superior de Ingeniería Mecánica y Eléctrica, Instituto Politécnico Nacional, Av. IPN s/n, Unidad Profesional Adolfo López Mateos, Edificio 2, Col. Lindavista, Del. Gustavo A. Madero, 07738 México D. F., Mexico.
2 Instituto de Geofísica, Universidad Nacional Autónoma de México, Ciudad Universitaria, Del. Coyoacán, 04510 México D. F., Mexico.
3 Instituto Max Planck para Investigaciones del Sistema Solar, Max–Planck Str. 2, 37191, Katlenburg–Lindau, Germany. * gumunozm@ipn.mx
4 Escuela Superior de Física y Matemáticas, Instituto Politécnico Nacional, Av. IPN s/n, Unidad Profesional Adolfo López Mateos, Edificio 9, Col. Lindavista, Del. Gustavo A. Madero, 07738 México D. F., Mexico.
Manuscript received: January 11, 2008.
Corrected manuscript received: June 20, 2009.
Manuscrpt accepted: November 23, 2009.
ABSTRACT
In this work we show a statistical analysis of the main parameters ofsolar ejections observedfrom January 1996 to December 2006 and reported on the SoHO–LASCO CME Catalog by the Coordinated Data Analysis Workshops (CDAW); this catalog contains the most complete data bank of coronal mass ejections (CMEs) ever compiled. The parameters of the CMEs analyzed are: angular position, angular width, speed and acceleration. For them, we obtained the distribution for each parameter and their representative values in order to characterize CMEs during solar cycle 23. These values are compared with the ones reported by previous analyses; we found that extreme values (maximum and minimum) are, for this sample, even more extremes. We discuss some specific cases from where can be shown that such extreme values correspond not only to a higher sensibility of the instruments, but to an overestimation of the values, and the consideration of events that are not properly CMEs.
Key words: coronal mass ejections, solar wind, dynamical parameters, statistics.
RESUMEN
En este trabajo se presenta un análisis estadístico de los parámetros principales de las eyecciones solares observadas de enero de 1996 a diciembre de 2006 y publicadas en el Catálogo de Eyecciones Coronales de Masa (ECM) de SoHO–LASCO por el Coordinated Data Analysis Workshops (CDAW); este catálogo contiene el acervo más extenso de datos de ECMs que existe. Los parámetros de las ECM analizados son la posición angular, el ancho angular, la velocidad y aceleración. Para ellos se obuvo la distribución así como los valores representativos de los mismos, lo que permite caracterizar a las ECM durante el ciclo solar 23. Se comparan estos valores con los reportados por análisis similares realizados previamente, encontrándose que los valores extremos (máximosy mínimos) son, para esta muestra, aún más extremos. Se discuten algunos casos específicos de donde puede demostrarse que dichos valores extremos corresponden no sólo a una mayor sensibilidad de los instrumentos, sino a una sobreestimación de los valores e incluso a la consideración de eventos que no son propiamente ECM.
Palabras clave: eyecciones coronales de masa, viento solar, parámetros dinámicos, estadística.
INTRODUCTION
Coronal mass ejections and their dynamical parameters have been defined from coronagraph white light images (Hundhausen et al., 1984; Schwenn, 1996). The main parameters identified for a single CME are: central position angle, angular width and speed. All these measurements are evaluated on the plane of the sky (POS), as the CME is projected on the images. Some other parameter can be calculated from the above, e.g., acceleration, mass and kinetic energy. These parameters are important not only in the characterization of each single event, but in the correlation to other phenomena, such as flares, prominences and interplanetary coronal mass ejections (ICMEs), which are known to be the interplanetary counterparts of CMEs, (Schwenn et al., 2005).
Ever since the first CME observations, there have been attempts to classify them with regard to their shape, their relationship to other solar phenomena, the phase of the solar cycle, or their dynamical properties, such as speed, acceleration, mass, and energy.
CMEs have been classified according to their acceleration into two groups: Type A, which are accelerated events, and type C, with constant speed (Sheeley et al., 1999; Moon et al., 2002). Some authors have proposed a relationship between type (A or C) with the appearance of events in the chromosphere and photosphere, such as flares or erupting prominences, while others associate it with the kind of the disturbance observed in the corona, e.g., Moreton waves, EIT waves, and EUV dimmings (Andrews and Howard, 1999; Schwenn et al., 2006 and references therein).
Some other authors propose a different classification of CMEs regarding their speed: fast ones, with speeds greater than that of the ambient solar wind, and slow ones, with lower speeds. In these two cases, the corresponding accelerations will be, according to the models, negative or positive (Chen and Krall 2003; Cantó et al., 2005). It has been shown that fast CMEs are mainly related to type II (m) and type IV radio bursts (Lara et al., 2003; Cane and Erickson 2005), but no other direct relationship can easily be found regarding solar or interplanetary phenomena.
PREVIOUS ANALYSIS
In order to understand the behavior of CMEs, it is important to know their main characteristics to analyze their origin, propagation, and evolution. Since the beginning of the 70s, several coronagraphs on board of space missions, like the Seventh Orbiting Solar Observatory (OSO–7), Skylab, Solwind, Solar Maximum Mission (SMM), Spacelab 2, and LASCO–SoHO have produced a great quantity of CME images (Table 1).
Gosling et al. (1976) studied the speeds of CMEs observed by the Skylab coronagraph. It was determined from these observations that the speed range goes from less than 100 km/s to more than 1,200 km/s. The average speed of these events was 470 km/s, ranging from 1.75 to 6 solar radii. In that work, they also analyzed the association of CMEs to flares and prominences, as well as with type II and IV radio bursts.
Howard et al. (1985) reported a statistical analysis of 998 CME images taken by the Solwind coronagraph on board the P78–1 satellite from March 28, 1979 to December 31, 1981. They classified these CMEs in 10 types according to their apparent structure and concluded that CME properties depend strongly on these structures, being halos and curved front ones the most energetic. Distributions of speed, angular width, central latitude, mass, kinetic energy, and latitude were presented for the whole data set and for each one of the classes considered. Though CMEs occur at any possible latitude, they concentrate mainly about the equator. The average angular width was found to be 45°, the average speed 474 km/s, and the expelled mass and kinetic energy 4.1×10¹⁵ and 3.5×1030 ergs, respectively. The occurrence of CMEs for this period was 1.8 CMEs per day for the whole data set, 0.9 per day for "strong" CMEs and 0.15 per day for CMEs at least 45° wide.
The High Altitude Observatory Coronagraph on board the Solar Maximum Mission obtained information of CMEs from March to September 1980 and from June 1984 to November 1989, having registered more than 1,000 events which were compiled on a catalogue by St. Cyr and Burkepile in 1990. The properties, sizes, and positions were analyzed statistically by Hundhausen (1993), who reported 1,209 events and by Burkepile et al. (2004), who analyzed data of 1,462 events.
St. Cyr et al. (1999) reported a statistical study of CMEs registered between 1980 and 1989 by the Mark III K–Coronameter at Mauna Loa Solar Observatory. The studied properties were position, size, speed, and acceleration. Their results are compatible with the data for the same period from Solwind and SMM. St. Cyr et al. (2000) analyzed the properties of 841 CMEs observed by the C2 and C3 LASCO coronagraphs from January 1996 to June 1998. The parameters they studied were apparent central position angle, apparent angular width, and apparent speed.
Gopalswamy (2006) summarized the properties of more than 7000 CMEs registered by LASCO–SoHO. He presented distributions for speed, apparent width, acceleration, mass, and energy. The average values of the parameters are 483 km/s for the POS, and 46° for the apparent angular width. The mass, estimated by the angular width and the excess mass in coronagraphic field of view ranges from a few times 1013 g to more than 1016 g, while the kinetic energy, obtained from the measured speed and mass ranges from ~1027 erg to ~1032 erg, with an average value of ~5×1029 erg.
DATA
The data analyzed in this work were obtained by the LASCO C2 and C3 coronagraphs on board of SoHO from January 1996 to December 2006, excluding three months in 1998 (July, August and September) and one in 1999 (January) for which no data are available in the catalog. In this period, 11,657 CMEs were registered and listed in the Coordinated Data Analysis Workshop (CDAW) catalog (Yashiro et al., 2004; <http://cdaw.gsfc.nasa.gov/CME_list/>). SoHO instruments have already covered the largest observation period of CMEs, which by now include an almost complete solar cycle (from minimum to minimum).
The most representative feature of the solar magnetic cycle is the sunspot cycle. Even though CMEs, as originally defined (Hundhausen et al., 1984; Schwenn 1996), are hydrodynamic phenomena, their origin is spatially and temporally related to active regions (which usually contain sunspots). The temporal behavior of solar cycle 23 as determined from the smoothed monthly relative sunspot number (SIDC, 1996–2006) is plotted in Figure 1 along with the observed smoothed monthly CME rates. Two major peaks are observed for CMEs, the highest around 2000 and the second between 2002 and 2003. A similar two peaks behavior is observed for sunspot activity but the second peak is located between 2001 and 2002. A larger difference appears after 2003; while sunspots continue decreasing in number, CME rates seem to increase briefly until 2005, when they continue decreasing again, but not reaching the decreasing rate of sunspots. This effect is produced mainly due to different criteria applied in the analysis of the images to obtain the data of the used catalog. A different catalog, CACTus (<www.sidc.be/cactus>), applying other criteria and methods in the image analysis (Robbrecht et al., 2006, Robbrecht 2007, personal communication), shows a behavior similar to the sunspot number on the last decreasing phase.
ANALYSIS OF THE APPARENT CENTRAL POSITION ANGLE
The central position angle (PA), as defined by Hundhausen et al. (1984), was measured for all the reported CMEs in the catalog, except for Halo CMEs. In such a case, the feature seems to cover the full solar disk, and neither PA nor the apparent width is available. Not a numerical value but a classification of "Halo" is then assigned to PA. Excluding halo events from this analysis, 11,264 CMEs remained; for them, the lowest value was 0° and the highest 359°, covering the complete range of geometrically possible values. The histogram of the distribution (Figure 2) shows two peaks, which are non–symmetric about the equator. Fourteen events have a position value of 0° and twelve of 180° (right on the poles). The remaining CMEs are distributed asymmetrically, 48 % are located from 1° to 179° and 52% from 181° to 359°. There is a small difference among the number of CMEs observed on the East side and the ones on the West side. This difference is important considering the total number of CMEs analyzed.
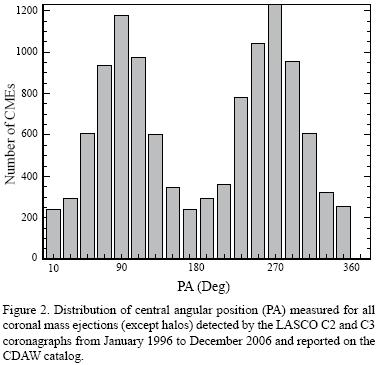
Such East–West asymmetry has also been observed for solar cosmic ray flares (Reid and Leinbach, 1959; Obayashi and Hakura, 1960; Carmichael, 1962). A possible explanation for this asymmetry is the influence of the configuration and strength of the solar and interplanetary magnetic fields. For the case of CMEs, a similar explanation has been proposed. It seems that, under the effect of the Parker spiral magnetic field, a fast CME will be blocked by the background solar wind ahead and deflected to the east whereas a slow CME will be pushed by the following background solar wind and deflected to the west (Wang et al., 2004).
Of the CMEs 73% are located within ±45° about the equator. Therefore, a central value (median or average PA) would be meaningless for this parameter. The characteristic values are those with the highest frequency of occurrence. Like other features related to the solar magnetic cycle, CMEs have clearly a higher occurrence around the equator. Even if a few CMEs, as reported in the CDAW catalog, have latitudes right on the poles, these locations, and some other near them, should be due to projection effects. CME sources are related to closed field regions (Schwenn et al., 2006) and their location varies with the course of the magnetic activity cycle. For the data in this sample, 14 events have a PA of 1° and 12 have 180°; this events, as some others, should be considered carefully (see Figure 3), as many of them are classified as partial halo, poor events or even are just a part of a more complex structure. According to Burkepile et al. (2004), no limb CMEs are located ±10° around the poles and less than 2 % are centered above 60° latitude. On the other hand, for the SMM data (no limb) analyzed in that work, around 13 % were within this latitude similar to the 14 % of our sample.
ANALYSIS OF ANGULAR WIDTH
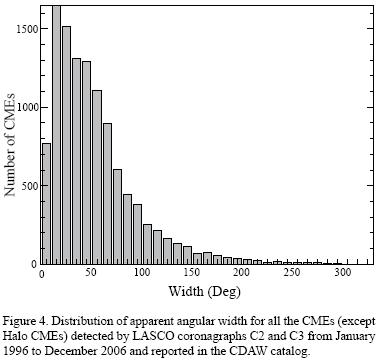
The angular span of a CME on the coronagraph field of view is an approximation of the actual size. The apparent width, defined as the angular distance between the outer edges of the structure (Hundhausen, 1993), is determined for every CME listed in the catalog. For all the CMEs reported in the catalog it was possible to measure this parameter. The smallest angular width value was 1°, for a jet observed on April 3, 2005. This object can be hardly recognized only in three C2 images, and for sure, it is not compared to other CMEs with a different shape. Starting with this extremely thin object, every single value in increments of 1° seems to be possible due to the high resolution of LASCO observations and ambiguous identification of CMEs. Faint parts of one single structure are clearly distinguishable in the images, reaching extremely high width values as well. A value of 360° is applied to the so called halo CMEs (Howard et al., 1982), nevertheless it can be considered that some of the values of the angular width are overestimated; for example, an angular width of 314° was assigned to a CME (classified as partial halo) on October 24, 2002, when clearly a value smaller than 270° should be assigned. From previously performed analyses, the reported CMEs with apparent angular sizes larger than 115° are: 1.4 % for SMM (Burkepille and St. Cyr, 1993) and 13 % for LASCO data until 1998 (St. Cyr et al., 2000). In the data reported until December 2006, we found 11.2 % of the CMEs with angular width within the range of 115° to 359°; excluding halo events, which comprise 3.4 % of the total sample.
The histogram of the distribution for the apparent angular width is shown in Figure 4. The peak of the distribution is between 10° and 20°; 25 % of the sample has an angular width between 10° and 30°, whereas 43 %> lie within the 30° and 80° range. The median angular width (excluding halo CMEs) is 44° and the average 63°. Both values are smaller compared to the median of 50° and 72° reported previously for LASCO data (St Cyr et al., 2000).
ANALYSIS OF SPEED
The distribution of apparent speeds for LASCO CMEs is presented in Figure 5. The plotted speed corresponds to the linear speed in the CDAW catalog, obtained from the first order fit. This parameter was calculated for 11,550 events. Rounding to integer values, the smallest speed found was 31 km/s for a CME observed on March 23, 1997. This is a particular CME, even when a clear bright, slowly expanding arc is distinguishable; it does not seem to move out from the field of view of C2, in fact, never reaches the outer border but looks like merging a faster CME appearing in C2 almost 16 hrs after the first one. The largest speed, 2,604 km/s, was found for an event occurred on May 12, 2000. The plot shows an asymmetric distribution with peak on 300–400 km/s, being the mode 314 km/s and the rounded average speed is 457 km/s.
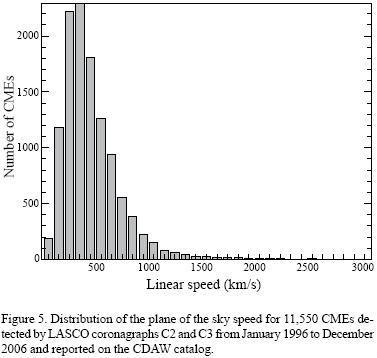
From those 11,550 events, 6,300 (54 %) have speeds between 200 km/s and 700 km/s, and 5,883 (50.9%) have speeds smaller than 400 km/s, i.e., they are slower than the average speed of the ambient solar wind. From these 5,883 slow CMEs, 192 have speed below 100 km/s. One of the most important facts derived from LASCO data is that more CMEs with small POS speed are detected compared to previous missions. It is clear that POS speed is only one component of the actual velocity vector, but, considering that in this mission many more wide CMEs have been observed as well, this implies that much more low energy CMEs are detected.
ANALYSIS OF ACCELERATION
For 10,124 CMEs in CDAW catalog, acceleration was determined using a second order fit between position and time. Acceleration is considered constant for the fit. Most of them are marked as not reliable because just three measurements were used in the second order fit to evaluate this parameter. From the 10,124 events which initially had an associated acceleration value, 4,333 (43 %) were found to have a reliable acceleration value. The histogram of the distribution of the acceleration for this subgroup is shown in Figure 6.
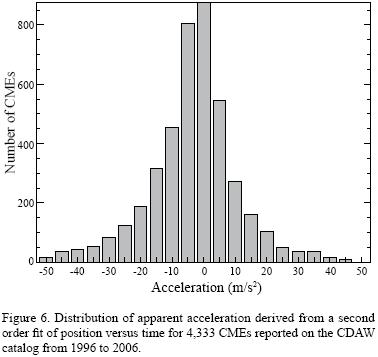
The acceleration shows a standard normal distribution centered at 0 m/s2. The smallest acceleration value is –172 m/s2 for a fast CME (POS speed ~1,900 km/s) which occurred on September 10, 2005 and the largest value was 117.5 m/s2 for a moderate CME (POS speed ~800 km/s) on December 17, 2006. 2,697 events have accelerations between –10 and 10 m/s2, representing 62 % of the analyzed sample. As a result, more than the half of the CMEs can be considered to have a constant speed.
Acceleration is a controversial parameter, not only in the cases when the number of images is small. It is clear from the plots in the catalog that in many cases acceleration changes while the object is moving through the field of view of the coronagraph, i.e., the actual acceleration of a CME is not necessarily constant. Nevertheless, both position analyses, linear and second order fits are based on a constant acceleration supposition. The normal distribution of acceleration shows that the parameter has a random behavior and can not be characterized in a simple approach.
Under these circumstances, any correlation to other parameters without a physical model is meaningless. When acceleration is plotted against speed a huge dispersion of the data points in every direction is shown. Any curve can be fitted to them with the same accuracy.
At first glance it can be seen that slow CMEs have negative acceleration while fast CMEs seem to have positive accelerations (Figure 7). Compared to a threshold speed of 467 km/s, for the subgroup under consideration, 56 % of the events are fast CMEs, 43 % are slow and only seven events have speed 467 km/s. Four of these seven CMEs have negative and three have positive accelerations (–0.9 ms–2 being the closest one to 0). From the fast CMEs, 39 % have positive accelerations and from the slow CMEs 38 %, have negative accelerations. Even when they are not close to the half, these quantities are important in this context. It is evident from a punctual analysis of single events that a straight line is not the best to use in the fit. Acceleration of a single CME depends not only in the speed at the beginning of the movement but on the ambient conditions during its propagation, and is not necessarily constant during its transit through the interplanetary medium. Average values for the ambient solar wind parameters can be evaluated but, considering that CMEs clearly represent disturbances themselves, the surrounding environment does not necessarily have those average values before and after the ejection. A classification of slow or fast for each single CME should be made compared to ambient conditions in each case, as well as a single evaluation of the acceleration. It is almost impossible and worthless to evaluate average values for this kind of phenomena though most of them depend on different conditions.

SUMMARY AND DISCUSSION
For more than ten years, CMEs have been detected and registered systematically by LASCO C2 and C3 coronagraphs on board the SoHO mission. This period covers almost a complete solar cycle, from minimum to minimum. The data bank of CMEs, which is available on the web provided by the CDAW, is the most complete compilation ever existed. This data bank includes the main dynamical parameters of CMEs. In this work, we analyzed these parameters in order to characterize CMEs.
The behavior of CME occurrence for this sample is similar to the one for sunspots with a difference in amplitude. A sample obtained using an automatic detection system (CACTus) seems to show an even closer appearance in the decreasing phase (Robbrecht et al., 2006).
The principal angle for these events reaches all angle values from 1° to 360°. While the range of values is broad, most of the events are located around the equator, though they are asymmetrically distributed: 48% are located on the East and 52% on the West side.
Of the parameters reported for CMEs in the CDAW catalog, the apparent angular width is the only approximation to CME size and, from this parameter, the amount of plasma released can be evaluated. Widths from 1° to 314° were found for the sample, excluding halo CMEs. The median value is 44°, which is smaller than in previous analyses. The detection of very thin events is remarkable from these observations, generating some doubts whether these events can be considered CMEs.
Not only the width seems to reach extreme values for CME parameters, but speed and PA show a similar behavior as well. The speed covers the largest range of values ever recorded in CMEs registers (from 31 km/s to 2604 km/s). All these parameters are measured on coronagraph white light images so that the values correspond to the POS projection. The mean speed for this sample is 457 km/s, which is comparable to those obtained previously for SoHO–LASCO.
Acceleration is the parameter with greatest uncertainty, owing to the fact that more than 50 % of the sample does not have a reliable value. A standard normal distribution centered at 0 m/s2 represents the acceleration. Positive and negative accelerations are related to both, fast and slow CMEs, so no direct relation can be found in a statistical way. A more detailed evaluation of CMEs accelerations is necessary in order to characterize the parameter and identify the possible associated physical processes.
It is remarkable that the definition of CME is now ambiguous. Many of the events considered in the catalog as CMEs, as the ones shown in Figure 3, have characteristics different from the "classical" concept, so they should not be mixed.
ACKNOWLEDGEMENTS
The authors would like to thank the Escuela Superior de Ingeniería Mecánica y Eléctrica del IPN for its support in the development of this work. The data in this analysis were obtained from the on–line SoHO–LASCO CME catalog. This CME catalog is generated and maintained at the CDAW Data Center by NASA and The Catholic University of America in cooperation with the Naval Research Laboratory. SoHO is a project of international cooperation between ESA and NASA. The authors thank as well Dr. Prof. Rainer Schwenn and Prof. Carlos G. Pavía Miller, the careful reading and suggestions to the manuscript.
REFERENCES
Andrews, M.D., Howard, R.A., 1999, The identification of two distinct types of coronal mass ejections by the LASCO C2 and C3 corona–graphs, in Wilson, A. (ed.), Magnetic Fields and Solar Processes, Proceedings of the 9th European Meeting on Solar Physics, Florence, Italy: European Space Agency, SP–448, 927–934. [ Links ]
Burkepile, J.T., St. Cyr, O.C. 1993, A Revised and Expanded Catalogue of Mass Ejections Observed by the SMM Coronagraph: National Center for Atmosferic Research, Techical Note NCAR/TN–369+STR, 57 pp. [ Links ]
Burkepile, J.T., Hundhausen, A.J., Stanger, A.L., St. Cyr, O.C., Seiden, J.A., 2004, Role of projection effects on solar coronal mass ejection properties: 1. A study of CMEs associated with limb activity: Journal of Geophysical Research, 109(A3), A03103.1–A03103.16. [ Links ]
Cane, H.V., Erickson, W.C., 2005, Solar Type II Radio Bursts and IP Type II Events: The Astrophyscal Journal, 623, 118–1194. [ Links ]
Cantó, J., González, R.F., Raga, A.C., de Gouveia Dal Pino, E.M., Lara, A., González–Esparza, J.A., 2005, The dynamics of velocity fluctuations in the solar wind–I. Coronal mass ejections: Monthly Notices of the Royal Astronomical Society, 357(2), 572–578. [ Links ]
Carmichael, H., 1962, High–energy solar–particle events: Space Science Reviews, 1(1), 28–61. [ Links ]
Chen, J., Krall, J., 2003, Acceleration of coronal mass ejections: Journal of Geophysical Reserach, 108(A11), SSH2–1–SSH2–22. [ Links ]
Gopalswamy, N., 2006, Coronal Mass Ejections of Solar Cycle 23: Journal of Astrophysics and Astronomy, 27(2–3), 243–254. [ Links ]
Gosling, J.T., Hildner, E., MacQueen, R.M., Munro, R.H., Poland, A.I., Ross, C.L., 1976, The speeds of coronal mass ejection events: Solar Physics, 48(2), 389–397. [ Links ]
Howard, R.A., Michels, D.J., Sheeley Jr N.R., Koomen, M.J., 1982, The observation of a coronal transient directed at Earth: Astrophysical Journal, 263, L101–L104. [ Links ]
Howard, R.A., Sheeley, N.R.Jr., Michels, D.J., Koomen, M.J., 1985, Coronal Mass Ejections – 1979–1981: Journal of Geophysical Research, 90, 8173–8191. [ Links ]
Hundhausen, A.J., 1993, Sizes and locations of Coronal Mass Ejections: SMM Observations from 1980 and 1984–1989: Journal of Geophysical Research, 98(A8), 13,177–13,200. [ Links ]
Hundhausen, A.J., Sawyer, C.B., House, L., Illing, R.M.E., Wagner, W.J., 1984, Coronal mass ejections observed during the solar maximum mission – Latitude distribution and rate of occurrence: Journal of Geophysical Research, 89(A5), 2639–2646. [ Links ]
Lara, A., Gopalswamy, N., Nunes, S., Muñoz, G., Yashiro, S., 2003, A statistical study of CMEs associated with metric type II bursts: Geophysical Research Letters, 30(12), 8016. [ Links ]
Moon, Y.J., Choe, G.S., Wang, H., Park, Y.D., Gopalswamy, N., Guo, Y., Yashiro, S., 2002, Statistical study of two classes of Coronal Mass Ejections: The Astrophysical Journal, 581, 694–702. [ Links ]
Obayashi, T., Hakura, Y., 1960, Solar corpuscular radiation and polar ionospheric disturbances: Journal of Geophysical Research, 65, 3131. [ Links ]
Reid, G.C., Leinbach, H., 1959, Low–energy cosmic–ray events associated with solar flares: Journal of Geophysical Research, 64(11), 1801–1805. [ Links ]
Robbrecht, E., Berghmans, D., Van der Linden, R.A.M., 2006, LASCO CME–catalog for 1997–2004 based on automated detection, in SoHO17 Giardini Naxos, Sicily. [ Links ]
Schwenn, R., 1996, An essay on terminology, myths, and known facts: Solar Transient – Flare – CEM – Driver Gas – Piston – BDE – Magnetic Cloud – Shock Wave – Geomagnetic Storm: Astrophysics and Space Science, 243, 187–193. [ Links ]
Schwenn, R., Dal–Lago, A., Huttunen, E., Gonzalez, W.D., 2005, The association of coronal mass ejections with their effects near the Earth: Annales Geophysicae, 23(3), 1033–1059. [ Links ]
Schwenn, R., Raymond, J.C., Alexander, D., Ciaravella, A., Gopalswamy, N., Howard, R., Hudson, H., Kaufmann, P., Klassen, A., Maia, D. , Muñoz–Martinez, G., Pick, M., Reiner, M., Srivastava, N., Tripathi, D., Vourlidas, A., Wang, Y.M., Zhang, J., 2006, Coronal Observations of CMEs: Space Science Reviews, 123(1–3), 127–176. [ Links ]
Sheeley, N.R., Walters, J.H., Wang, Y.M., Howard, R.A., 1999, Continuous tracking of coronal outflows: Two kinds of coronal mass: Journal of Geophysical Research, 104(A11), 24739–24768. [ Links ]
SIDC (Sunspot Index Data center)–team, World Data Center for the Sunspot Index, Royal Observatory of Belgium, online catalogue of the sunspot index, <http://www.sidc.be/sunspot–data/>, 'year(s)–of–data', 1996–2006. [ Links ]
St. Cyr, O.C., Burkepile, J.T., 1990, A catalogue of mass ejections observed by the Solar Maximum Mission coronagraph: Boulder, Colorado, Center for Atmospheric Research, Technical Note NCAR/TN–352+STR. [ Links ]
St. Cyr, O.C., Burkepile, J.T., Hundhausen, A.J., Lecinski, A.R., 1999, A comparison of ground–based and spacecraft observations of coronal mass ejections from 1980–1989: Journal of Geophysical Research, 104(A6), 12493–12506. [ Links ]
St. Cyr, O.C., Howard, R.A; Sheeley Jr N.R., Plunkett, S.P., Michels, D.J., Burkepile, J.T., Paswaters, S.E., Koomen, M.J., Simnett, G.M., Thomson, B.J., Gurman, J.B., Schwenn, R., Webb, D.F., Hildner, E. , Lamy, P. L., 2000, Properties of coronal mass ejections: SoHO LASCO observations from January 1996 to June 1998: Journal of Geophysical Research, 105(A8), 18169–18185. [ Links ]
Yashiro, S., Gopalswamy, N., Michalek, G., St Cyr, O.C., Plunkett, S.P., Rich, N.B., Howard, R.A., 2004, A catalog of white light coronal mass ejections observed by the SoHO spacecraft: Journal of Geophysical Research, 109, A07105. [ Links ]
Wang, Y; Shen, C; Wang, S., Pinzhong, Y., 2004, Deflection of coronal mass ejection in the interplanetary medium: Solar Physics, 222(2), 329–343. [ Links ]

