


Servicios Personalizados
Revista

Articulo
 Inglés (pdf)
 Artículo en XML
 Referencias del artículo
 Enviar artículo por email
Indicadores
 Citado por SciELO
 Links relacionados
-
 Similares en
SciELO
Similares en
SciELO
Compartir

 Permalink
Revista mexicana de ciencias geológicas
versión On-line ISSN 2007-2902versión impresa ISSN 1026-8774
Rev. mex. cienc. geol vol.25 no.3 Ciudad de México dic. 2008
Assessment of nitrate contamination of karst springs, Bani Kanana, northern Jordan
Evaluación de la contaminación por nitratos de manatiales cársticos, Bani Kanana, norte de Jordania
Mutewekil M. Obeidat1,*, Fayez Y. Ahmad2, Nezar A. Hamouri2, Adnan M. Massadeh3, and Faisal S. Athamneh1
1 Department of Environmental Sciences, Faculty of Science and Arts, Jordan University of Science and Technology, P.O. Box 3030, Irbid 22110, Jordan. * mobeidat@just.edu.jo
2 Department of Earth and Environmental Sciences, Faculty of Natural Resources and Environment, Hashemite University, P.O. Box 150459, Zarqa 13115, Jordan.
3 Department of Medicinal Chemistry and Pharmacognosy, Faculty of Pharmacy, Jordan University of Science and Technology, P.O. Box 3030, Irbid 22110, Jordan.
Manuscript received: April 9, 2008
Corrected manuscript received: July 14, 2008
Manuscript accepted: July 15, 2008
ABSTRACT
Contamination of ground–water from point and non–point sources is one of the major problems of water resources in Jordan. Altogether one hundred and six groundwater samples were collected from twenty six karst springs emerging from Umm Rijam aquifer and three wells tapping Amman–Wadi As Sir aquifer, and investigated for NO3– concentrations. Results showed that NO3– concentration in spring water ranged from 8 to 192 mg/L with an average of 33 mg/L. Seventy seven percent of the samples collected from the springs had nitrate concentrations exceeding the threshold value of 20 mg/L of anthropogenic source, and eight percent of the samples collected had nitrate concentrations higher than 50 mg/L, the maximum acceptable nitrate concentration for drinking water. About eighty percent of the sampled springs had nitrate concentrations higher than 20 mg/L. The K–means cluster analysis performed on the collected samples revealed the presence of three major clusters. The data were processed for the possible presence ofdiscordant outliers using the unpublished computer program UDASYS by Verma and Díaz–González. There is a wide spatial variation in the nitrate concentration in spring water. Monitoring the water quality of these springs showed that the lowest concentrations of nitrate were found in the wet season (January, February, and December), while the highest concentrations were found in the dry season (August, September). Nitrate concentration in Amman–Wadi As Sir aquifer ranges from <1 mg/L to 19.2 mg/L, with an average of 9.8 mg/L. Untreated domestic wastewater is most probably the major source of the nitrate in the spring water, as the study area is not served with sewer system, and domestic wastewater is collected in cesspools dug in the karised Umm Rijam Formation. Moreover, in the area under consideration there are no major industries or intensive agricultural activities. The results of this study are useful to highlight one of the most important environmental problems, namely the degradation of the water quality, and may serve to alert and encourage local and national authorities to take substantial steps and actions to protect and manage water quality.
Keywords: nitrate, karst springs, wastewater, Amman–Wadi As Sir aquifer, Umm Rijam aquifer, Bani Kanana, Jordan.
RESUMEN
La contaminación del agua subterránea por fuentes puntuales y no puntuales es uno de los mayores problemas para los recursos de agua en Jordania. Se colectaron 106 muestras de agua subterránea de 26 manantiales cársticos que emanan del acuífero Umm Rijam y de tres pozos que drenan el acuífero Amman–Wadi As Sir, y se investigaron sus concentraciones de NO3–. Los resultados mostraron que la concentración de NO3– en agua de manantiales está en el rango de 8 mg/L a 192 mg/L, con un promedio de 33 mg/L. Setenta y siete por ciento de las muestras colectadas en manantiales tuvieron concentraciones de nitrato que exceden el valor límite de 20 mg/L de fuentes antropogénicas, y ocho por ciento de las muestras colectadas tuvieron concentraciones de nitrato mayores que 50 mg/L, la concentración máxima de nitrato permisible para agua potable. Aproximadamente el 8% de los manantiales muestreados tuvieron concentraciones de nitrato mayores que 20 mg/L. El análisis de conglomerados por el método de los centroides ('K–means cluster analysis') reveló la presencia de tres conglomerados mayores. Los datos fueron analizados por la posible presencia de valores discordantes empleando el programa de cómputo no publicado UDASYS de Verma y Díaz–González. Existe una amplia variación espacial en la concentración de nitrato en agua de manantial. El monitoreo de la calidad del agua de esos manantiales mostró que las concentraciones más bajas de nitrato se encontraron en la estación de lluvias (enero, febrero y diciembre), mientras que las concentraciones más altas se encontraron en la estación seca (agosto y septiembre). La concentración de nitrato en el acuífero Amman–Wadi As Sir varía entre <1 mg/L y 19.2 mg/L, con un promedio de 9.8 mg/L. La fuente más probable de nitrato en los manantiales son las aguas residuales domésticas no tratadas, ya que el área de estudio no cuenta con sistema de drenaje y las aguas residuales domésticas son colectadas en cisternas cavadas en la Formación Umm Rijam afectada por procesos cársticos. Además, en el área no hay industrias grandes o actividades agrícolas intensivas. Los resultados de este estudio son útiles para resaltar uno de los problemas ambientales más importantes como es la degradación de la calidad del agua, y pueden servir como una alerta a las autoridades locales y nacionales para que sean tomados pasos substanciales y acciones para proteger y manejar la calidad del agua.
Palabras clave: nitratos, manantiales cársticos, aguas residuales, acuífero Amman–Wadi As Sir, acuífero Umm Rijam, Bani Kanana, Jordania.
INTRODUCTION
In urban areas, there are many possible sources for groundwater contamination, including landfills, septic tanks and cesspools, domestic and industrial effluents, leaky sewage system and gasoline stations (Eiswirth and Höltzl, 1997, in Wakida and Lerner, 2005; Seiler, 2005; Navarro and Carbonell, 2007). Nitrate is the most frequently introduced pollutant into groundwater systems (Spalding and Exner, 1993; Babiker et al, 2004). Recent studies revealed that groundwater contamination by nitrate is a globally growing problem due to the high rate of population growth and increasing consumption (Thorburn, et al., 2002; Jalali, 2005; Liu et al, 2005; Wakida and Lerner, 2005). The adverse health effects of high nitrate levels in drinking water are well documented (Walton, 1951; Fan et al, 1987; Ward et al, 1994; Fan and Steinberg, 1996). The most well known effects are methemoglobinemia, gastric cancer, and non–Hodgkin's lymphoma. Groundwater with nitrate concentration exceeding the threshold of 20 mg/L is considered contaminated as result of human activities (Spalding and Exner, 1993). According to the World Health Organization (WHO, 1993), the maximum acceptable nitrate concentration for drinking water is 50 mg/L. There are few, if any, mineral sources of nitrate for natural waters, and it is considered the end product from a sequence of biologically mediated reactions (Faust and Aly, 1981). Because of its negative charge, nitrate is not strongly adsorbed to soil colloids and is highly mobile within the soil liquid phase (Thompson, 1996). In strongly oxidizing groundwater, nitrate is the stable form of dissolved nitrogen (Kaçaroglu and Giinay, 1997). It moves in groundwater with no transformation and little or no retardation (Freeze and Cherry, 1979). Two factors are predominant in determining the mineralization of groundwater: the PCO2 produced in the soil, and the aquifer mineralogy (Edmunds et al, 2003). Chemical composition of groundwater is determined by a number of processes including atmospheric input, interaction of water with soil and rocks, and input of chemicals derived from human activities (Jeong, 2001).
Karst springs represent natural exits for groundwater to the surface through hydrogeologically conductive fractures in an otherwise low–permeability karst massif (Bonacci, 2001). Karst catchments are characterized by the occurrence of large numbers of swallow holes, jamas, dolines, and other karsts features, which readily conduct surface water to the underground (Bakalowicz et al., 1995, in Kaçaroglu, 1999). Karst aquifers are generally considered to be particularly vulnerable to pollution, due to their unique structure (Doerfliger et al, 1999). According to Toran and White (2005), reasons for karst groundwater vulnerability include: (1) recharge to karst aquifers bypasses the filtering capability of soil through macropores and swallow holes; (2) groundwater flows through conduits, so that there is little opportunity for filtration or sorption of contaminants onto aquifer material; (3) the movement of pollutants cannot be directly observed as in a surface–flowing stream; (4) flow paths may take routes that are not apparent from the topography or slope of the land; (5) flow velocities in karst aquifers are fast compared to velocities in granular aquifers, therefore, there is no sufficient time for the pollutants to be retarded by chemical reactions or other attenuation mechanisms, such as acid–base reactions, adsorption, ion exchange, complexation, precipitation or bacteriological degradation (Kaçaroglu, 1999); (6) flow is in converging conduits, therefore, pollutants are not diluted through dispersal. Typical behavior of a karst spring is manifested by rapid variation of the spring discharge, rapid variation of the chemical and isotopic composition of the spring water, etc. (Atkinson, 1977).
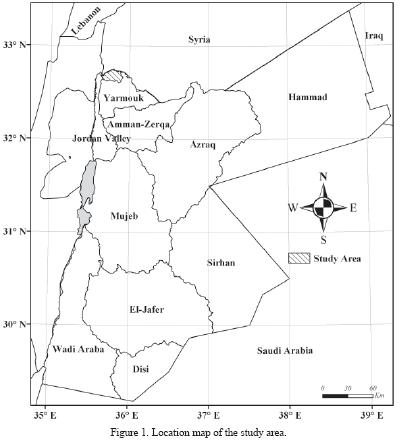
Jordan, with its limited water resources, is facing the problem of groundwater contamination with different types of pollutants. In the area under investigation, groundwater contamination with nitrate is considered to be one of the major problems. This study focused initially on nitrate as both a contaminant of concern and an important tracer of human–induced environmental degradation. Springs with elevated nitrate concentration will be resampled and analyzed for other parameters and pollutants such as isotopes, pesticides and caffeine to delineate accurately the sources of nitrate and the relative inputs of each source. The main objectives are: (1) to evaluate the nitrate contamination of groundwater resources, (2) to assess nitrate concentration spatially and temporarily and, (3) to evaluate the correlation between cesspool density and nitrate concentration. The study area is located between the Palestine Grids: 210–240 East and 225–240 North (Figure 1).
DESCRIPTION OF STUDY AREA
The study area is a part of the Yarmouk basin, which is one of the transboundary basins that Jordan shares with the neighboring countries. It is characterized by typical karst topographic features such as sinkholes, soil fissures, caves, karst pavement and sinking underground streams.
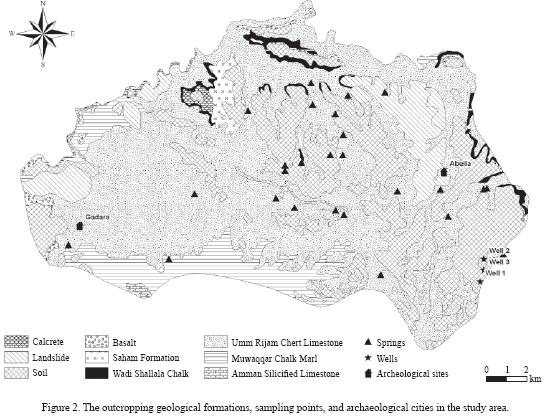
The outcropping geological formations in the study area are presented in Figure 2. Basalt of Pliocene–Pleistocene age is exposed in the western part of the study area. The Saham Formation of Miocene to Pliocene age is well exposed in the area between Saham and Aqraba. This formation represents an evidence for a lake that covered part of the present–day Yarmouk river (Mofr D, 2000). The lake is illustrated by the distribution of several facies: sandstone followed by finely laminated limestone, fossiliferrous limestone, conglomeratic limestone, chalky limestone and detrital clayey limestone. The Shallala Chalk Formation (B5) of early Middle to early Late Eocene age is composed of limestone, chalky limestone and marl with chert intercalations. The Umm Rijam Chert Limestone Formation (B4) of Lower–Middle Eocene age is composed of alternations of limestone, chalk and chert; it is highly fractured and characterized by karstic, and cavernous features, making it a good aquifer. Many perennial and intermittent springs emerge from the Umm Rijam Chert Limestone Formation with mean discharge ranging from 0.9m3 /hr to more than 38m3/hr (Table 1). The B4/B5 aquifer has a hydraulic conductivity ranging from  to
to  m/s, with an average of
  m/s (Margane et al., 1999). The Muwaqqar Chalk Marl Formation (B3) is composed of marl and marly limestone and is considered as aquitard throughout Jordan. Other geological formations which have a great importance with regard to their potential of being aquifers in the study area and in Jordan as a whole are the Amman Silicified Limestone Formation (B2) of Santonian–Campanian age and the Wadi As Sir Limestone Formation (A7) of Turanian age. The former one is predominantly built up of chert, marl, limestone, tripoli, and some phosphate–bearing strata (phosphatic chert and phosphatic limestone); the later one is composed of massive limestone and dolomite with chert nodules (Obeidat, 1993). Because of their hydraulic interconnection, the two formations are considered as one aquifer in the study area and throughout Jordan (B2/A7). The Amman–Wadi As Sir aquifer is separated from the overlying Umm Rijam/Shallala aquifer by the Muwaqqar Chalk Marl Formation (B3). The hydraulic properties of B2/A7 aquifer are highly anisotropic and heterogeneous; it has transmissivity values ranging from 7m2 /d to more than 8,000 m2/d (Woshah, 1979), and groundwater flows in a northly and northwesterly direction. The aquifers provide water for domestic supply.
Yarmouk river is the major Jordan river tributary. Its water is shared with the upstream and downstream neighboring countries. The flow of the river is highly fluctuating between summer and winter. Average historical records of the river flow (in millions of cubic meters, MCM) was about 400 MCM, whereas in the recent years it dropped down to about 90–130 MCM (MWI, 2004). El Wehdah dam, with a storage capacity of 110 MCM is being constructed at Yarmouk river. Soil covers an extensive part of the study area; it is of Red Mediterranean type and rich in the calcareous content (Moorman, 1959).
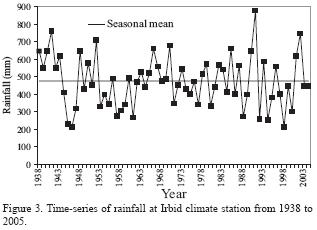
The climate of the study area is of Mediterranean type, which is characterized by a cool, rainy winter, and a hot, dry summer. The average annual rainfall (1938–2005) at Irbid Climate Station, 10 km south to the study area, is 476 mm (Figure 3), and the average annual potential evaporation is about 2,179 mm. The mean annual minimum and maximum temperatures are 12.3 °C and 23.1 °C, respectively.
The historical cities of Gadara (Um Qais) and Abila (Qweilbeh), two of the ten Decapolis towns, are located in the study area. The Roman cities were supplied with drinking water from the springs emerging from Umm Rijam aquifer, which were tapped during the Roman times with the construction of aqueducts. There is no sewer–age system for collection and treatment of the domestic wastewater. Instead, houses are connected to cesspools dug for the purpose of wastewater disposal. Uncontrolled and irresponsible disposal of wastewater into the surrounding environment via karst features was and is currently being practiced.
MATERIALS AND METHODS
A total of 106 water samples were collected and used in the present study. One hundred samples were collected from the outlets of 26 springs emerging from the Umm Rijam aquifer (B4), and six samples from three wells tapping the Amman–Wadi As Sir aquifer (B2/A7). In addition, five water samples were collected from cistern wells representing the rainfall of the rainy season 2005/2006. To investigate temporal trends, sampling span was extended from January 2006 to January 2007 for some preselected springs (AD550, AD560 AD580, AD590, AD600, AD610, AD630, Um Said). Measurements of electrical conductivity (EC), pH, and temperature were carried out in situ using a portable conductivity meter (Cond 330Í/SET, WTW, Germany) and a portable pH–meter (pH 315Í/SET, WTW, Germany). Samples were collected in clean polyethylene bottles and dispatched for analysis to the laboratory in an ice–filled box. In the laboratory, samples were refrigerated at 4°C and the analysis was carried out within 48 hours of collection. Chloride, calcium, magnesium, bicarbonate and hardness were determined with titrimetric methods. Sulfate was determined by spectrophotometric turbidimetry. Spectrophotometer (UV–2401 PC, ShiMAD_Zu) was used for determination of NO3– concentrations. The methods described by the American Public Health Association (Clesceri et al., 1998) were followed during field and laboratory analysis.
The method used to determine the NO3– concentration can be summarized in the following steps: (1) Stock nitrate solution: 7.218 g of dried and pure KNO3 (Sigma chemical) was dissolved in 1,000 mL deionized water. Concentration equals to 4,430 mg/L of NO3–. (2) Intermediate nitrate solution: an aliquot of 100 mL stock nitrate solution was diluted to 1,000 ml with deionized water. Concentration equals to 443 mg/L of NO3–. (3) Standard calibration curve: NO3– calibration standard solutions in the range of 0 to 40 mg/L NO3– were prepared from the intermediate nitrate solution. (4) Spectrophotometric measurements: the absorbance was read at 220 nm to obtain NO3– readings and at 275 nm to determine the interference due to dissolved organic matter. The absorbance at 275 nm was subtracted from the absorbance at 220 nm to obtain absorbance due to nitrate. (5) A standard calibration curve was constructed by plotting absorbance due to nitrate against NO3– concentration of the standards. NO3– concentration in the sample was directly read from the standard calibration curve. The NO3– calibration curve follows the Beer's law up to 48 mg/L. Samples with concentrations higher than 40 mg/L were diluted to fit the calibration curve. All samples were analyzed in triplicate with analytical uncertainty of less than 4%. The precision of the instrument used is ± 0.005 absorbance unit. The results are expressed as mg/L NO3–.
The obtained data were processed for the possible presence of discordant outliers, by using the unpublished computer program UD AS YS by Verma and Díaz–González (manuscript in preparation). This computer program is based on the original methodology proposed by Verma (1997; see also Barnett and Lewis, 1994) along with the new, precise and accurate critical values recently simulated by Verma and Quiroz–Ruiz (2006a, 2006b, 2008), and Verma et al. (2008). The discordant outliers can thus be identified and interpreted accordingly. The statistical parameters of the analytical data are reported as rounded values following the criteria put forth by Bevington and Robinson (2003) and Verma (2005).
Cluster analysis is a classification that places objects into more or less homogenous groups in a manner so that the relation between groups is revealed. During this study, a K–means cluster analysis was performed. The statistical software SPSS 13.0 for Windows was employed for this purpose.
Discharge of some springs was measured with the aid of a container of known volume and a stopper. Some springs are located in deep–incised wadis, and they were approached with a great difficulty.
RESULTS AND DISCUSSION
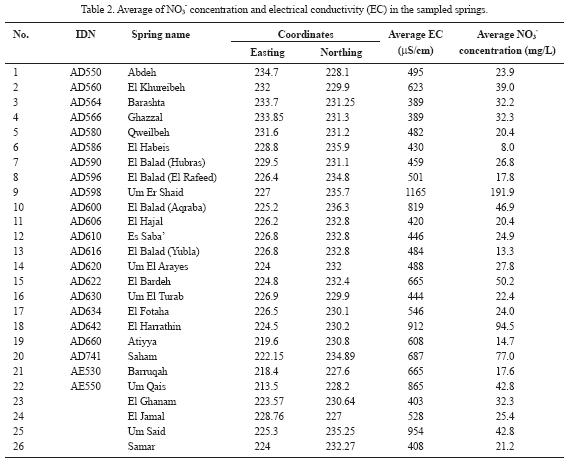
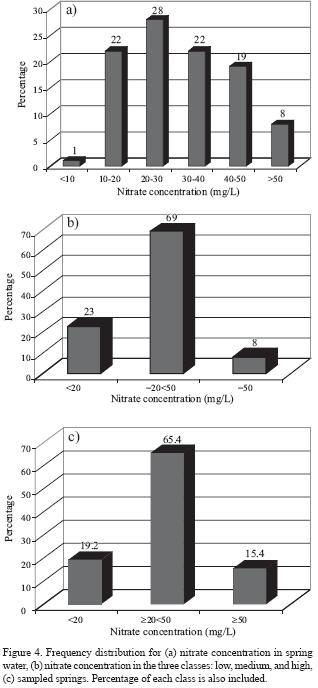
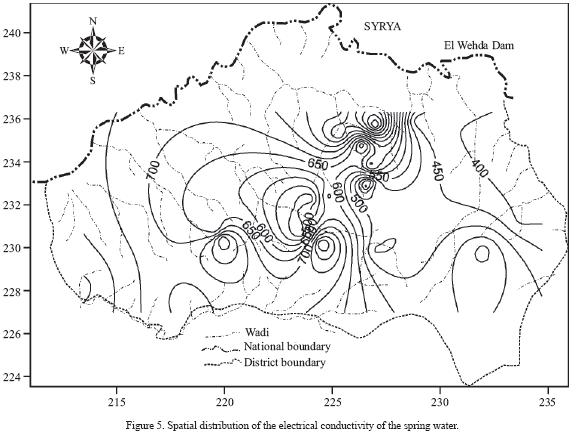
Nitrate concentration in the rainfall (rainy season 2005/2006) ranges from less than 1 to about 5.8 mg/L with an average of 2.72 mg/L. Thus, addition of nitrate in rainwater recharging the groundwater is negligible due to the low nitrate content. Salamehet al.. (1991) estimated the average nitrate concentration in rainfall at Irbid Climate Station to be about 4 mg/L. Nitrate concentration in the sampled springs (Umm Rijam aquifer) ranges from 8 to 192 mg/L, with an average of 33 mg/L (Table 2). The frequency distribution of nitrate concentration is presented in Figure 4a, with 69% of the samples having NO3– concentration in the range of 20–50 mg/L. Seventy seven percent of the samples has nitrate concentrations exceeding the threshold value of 20 mg/L of anthropogenic source. Eight percent of the samples has nitrate concentration higher than 50 mg/L, the maximum acceptable nitrate concentration for drinking water (WHO, 1993). The nitrate concentrations were grouped into one of three classes (Figure 4b). These include the following: i) low (<20 mg/L), ii) medium (> 20 mg/L to <50 mg/L), and iii) high (>50 mg/L). Nitrate concentrations in the high class exceed the recommendations for drinking water set by WHO (1993). The medium class involves samples with nitrate concentrations high enough to indicate the influence of human activities (Spalding and Exner, 1993). The low class involves samples with a low risk for humans or the environment. About 80% of the sampled springs has nitrate concentrations higher than 20 mg/L, the threshold value of anthropogenic source (Figure 4c). Electrical conductivity rangedbetween389and 1165 µS/cm with an average of 576 µS/crn (Figure 5). Chloride concentration ranged between 25 and 116 mg/L, with an average of 46 mg/L. Hardness (as CaCO3) ranged between 101 and 366 mg/L, with an average of 195 mg/L. A statistically significant correlation (r = 0.73; n = 26; Bevington and Robinson, 2003; Verma, 2005) was observed between nitrate and chloride. Similarly, a statistically significant correlation (r = 0.77; n = 26) was also documented between nitrate and the electrical conductivity. A weak correlation between hardness and nitrate concentration was found, indicating different origins. The source of water hardness is the aquifer material (calcite) that undergoes water–rock interaction processes. A very strong correlation (r = 0.94; n = 93) was found between the electrical conductivity and chloride.
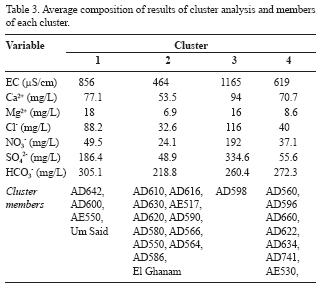
Cluster analysis resulted in three main clusters. Table 3 presents the average composition and the members of each cluster. Cluster 1 involves about 19.8 % of the total samples. By excluding cluster 3, which contains only one sample (AD598), this cluster has the highest ionic concentrations. Cluster 2 comprises about 60.4 % of the total samples and has the lowest ionic concentration. Cluster 3 contains only one sample, namely Um Er Shaid (AD598). Cluster 4 involves about 18.7 % of the total samples and has ionic concentration intermediate to that of clusters 1 and 2.
The test for the detection discordant outliers at the strict 99% confidence level was conducted on all samples collected from the springs as well as on the members of each cluster. The test performed on all spring samples revealed the presence of 0, 41, 7, 1, and 0 outliers in the pH–value, electrical conductivity, nitrate, calcium and bicarbonate, respectively. On the other hand, the test performed on the clustered samples showed a lower number of outliers in the above five parameters for the three main clusters, and the final statistics were significantly improved after this classification. The original statistics of the raw data together with the final statistics are presented in Table 4.
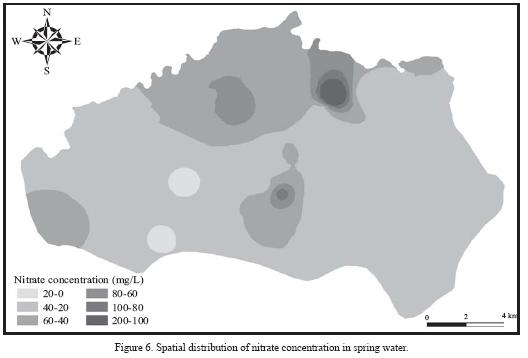
There is a wide spatial variation in nitrate concentration in the spring water (Figure 6). The lowest value (8 mg/L) was recorded for El Habéis spring, and the highest value (192 mg/L) was found for Um Er Shaid spring (AD 598). Salameh (1996) and Salameh and Farajat (1999) found that the nitrate concentration in the Um Er Shaid spring water was 198 mg/1. The former spring can be considered unpolluted as indicated by the low nitrate concentration. This spring is located 5 km north to Hartha village, where olive tree plantation is the dominating land use in its catchment area. The later spring underlies the village of El Rafeed which is still, as for all villages, unconnected to sewer system and uses cesspools as the disposal option of wastewater. Many of these cesspools are not able to hold the water. Moreover, the depth to groundwater in the catchment area of this spring (AD598) is less than 40 m. High values are observed for springs overlain by villages lacking a proper sewer system. As shown in Figure 7, there is a statistically significant correlation between nitrate concentration in spring water and the number of cesspools in the catchment area of each spring (r = 0.75; n = 18; a statistically valid linear correlation at 99% confidence level and 14 degrees of freedom, Bevington and Robinson, 2003). This indicates that domestic wastewater form the major source of nitrate in the spring water. In some springs, significant amounts of faecal coliforms were detected (Salameh and Farajat, 1999), suggesting the possibility of wastewater infiltration. The time that the cesspools could take to contaminate the groundwater can vary depending on the depth to water table, degree of fracturing and karstification of the aquifer, and permeability of the aquifer.
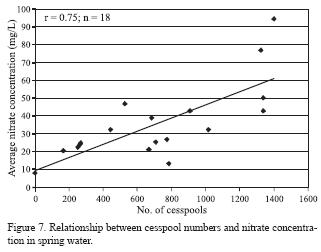
Other potential sources of groundwater pollution include agricultural activities (fertilizers and animal husbandry, olive presses), and gas stations. However, as it is indicated by linear correlation between cesspools density and nitrate concentration (r= 0.75; n = 18), the major source of nitrate is domestic wastewater. Moreover, the study area is devoid of major industries and intensive agricultural activities; the area that is cultivated by rainfed cereals and vegetables where fertilization takes place does not exceed 8% of the total study area; the area occupied by villages and roads is about 36%, olive trees 28%, woodland 19%, and rangeland 6%. The spatial variation in nitrate concentration can be attributed to different factors, suchas hydrogeology, degree of karstification, and land use. According to Yates (1985), septic tanks are the largest contributors of wastewater to the subsurface. Improper construction, siting, installation, and maintenance of the septic tanks, as well as factors such as depth to groundwater, climate, geology of the site, and septic tank density influence the potential of septic tanks to pollute groundwater. The improper location of wells with respect to septic tanks increase the potential for leaching of effluents to the well and groundwater.
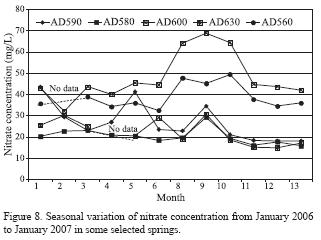
Seasonal variations were observed in nitrate concentration of spring water (Figure 8). Generally, the lowest values were observed in the wet season (January, February, and December) whereas the highest values were observed in the dry season (August, September). Minimum values of nitrate concentration are recorded directly after rainfall events.
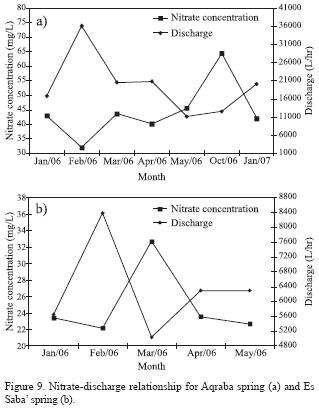
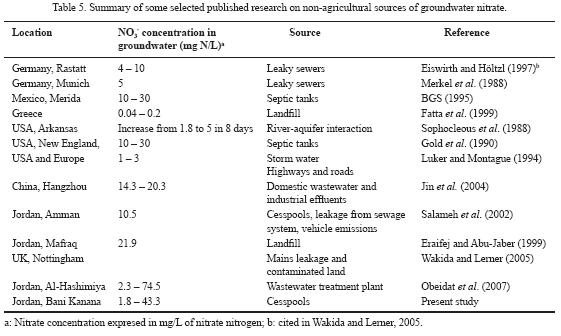
The co–variation of electrical conductivity and nitrate concentration in spring water reflects the same source of pollution. Nitrate concentration was strongly correlated with the discharge of springs (Figure 9). Nitrate concentration in Amman–Wadi As Sir aquifer ranged from less than one to 19.2 mg/L, with an average of 9.8 mg/L. This indicates that the groundwater of the same aquifer has nitrate concentration less than the threshold value of 20 mg/L of anthropogenic source, and less than the nitrate concentration in Rijam aquifer as well. This can be attributed to the hydrogeology of the study area, where the Amman–Wadi As Sir aquifer is protected from the pollution sources by the Muwaqqar aquitard. Results from this study were compared with nitrate concentrations in groundwater in other parts of Jordan and the world as well (Table 5). It can be deduced that non–agricultural sources, especially wastewater, represent a dominating source of nitrate in groundwater in many urban areas of the world and Jordan as well.
CONCLUSIONS
1. The present study confirms the contamination of the springs emerging from Umm Rijam Aquifer by nitrate. Eighty percent of the sampled springs have nitrate concentration exceeding 20 mg/L.
2. The k–means cluster analysis revealed the presence of three groups of springs with different proportions in the ionic compositions.
3. Temporal variations in nitrate concentration occur, with lowest values in the wet season. In addition, wide spatial variations occur, which are attributed to hydrogeology, degree of karstification and landuse.
4. Domestic wastewater forms the major source of ground–water pollution in the study area. Other potential sources of pollution include agricultural activities represented by fertilization, animal husbandries, and others.
5. The study area with about 100,000 inhabitants needs to be connected with a sewer system to collect wastewater. This will help prevent the deterioration of the ground–water ecosystem and protect human health.
ACKNOWLEDGEMENTS
The authors are deeply grateful to Jordan University of Science and Technology (JUST) for funding and offering analytical laboratories, and thankful to Dr. Surendra P. Verma, Centro de Investigación en Energía, Universidad Nacional Autónoma de México, Mexico, for conducting the tests on discordant outliers in the data.
REFERENCES
Atkinson, T.C., 1977, Diffuse flow and conduit flow in limestone terrain in the Mendip Hills, Somerset (Great Britain): Journal of Hydrology, 35, 93–103. [ Links ]
Babiker, I.S., Mohamed M.A.A., Terao H., Kato, K., Ohta, K., 2004, Assessment of groundwater contamination by nitrate leaching from intensive vegetable cultivation using geographical information system: Environmental International, 29, 1009–1017. [ Links ]
Barnett, V., Lewis, T., 1994, Outliers in Statistical Data: Chichester, John Wiley, 3rd edition, 584 p. [ Links ]
Bevington, P.R., Robinson, D.K., 2003, Data Reduction and Error Analysis for the Physical Sciences: New York, McGraw Hill, 3rd edition, 320 p. [ Links ]
Bonacci, O., 2001, Analysis of the maximum discharge of karst springs: Hydrogeology Journal, 9, 328–338. [ Links ]
British Geological Survey (BGS), Autonomous University of Yucatan, and National Water Commission of Mexico, 1995, Impacts of urbanization on groundwater in Merida: final report: Keyworth, Nottingham, UK, British Geological Survey, Technical Report WC/94/38, p 22. [ Links ]
Clesceri, L.S., Greenberg, A.E., Eaton, A.D., 1998, Standard methods for the examination of water and wastewater: Washington, DC, American Public Health Association (APHA), American Water Works Association (AWWA), and Water Environment Federation (WEF), 20th edition. [ Links ]
Doerfliger, N., Jeannin, P–Y., Zwahlen, F., 1999, Water vulnerability assessment in karst environments: a new method of defining protection areas using a multi–attribute approach and GIS tools (EPIK method): Environmental Geology, 39(2), 165–176. [ Links ]
Edmunds, W.M., Shand, P., Hart, P., Ward, R.S., 2003, The natural (baseline) quality of groundwater: a UK pilot study: The Science of the Total Environment, 310, 25–35. [ Links ]
Eraifej, N., Abu–Jaber, N., 1999, Geochemistry and pollution of shallow aquifers in the Mafraq area, North Jordan: Environmental Geology, 37 (1–2), 162–170. [ Links ]
Fan, A.M., Steinberg, V.E., 1996, Health implications of nitrate and nitrite in drinking water: an update on methemoglobinemia occurrence and reproductive and developmental toxicity: Regulatory Toxicology and Pharmacology, 23, 35–43. [ Links ]
Fan, A.M., Willhite, C.C., Book, S. A., 1987, Evaluation of the nitrate drinking water standard with reference to infant methemoglobinemia and potential reproductive toxicity: Regulatory Toxicology and Pharmacology, 7, 135–148. [ Links ]
Fatta, D., Papdopoulos, A., Loizidou, M., 1999, A study on the landfill leachate and its impact on the groundwater quality of the greater area: Environmental Geochemistry and Health, 21, 175–190. [ Links ]
Faust, S.D., Aly, O.M., 1981, Chemistry of natural waters: Michigan, Ann Arbor Publishers Inc., 400 p. [ Links ]
Freeze, R.A., Cherry, J.A, 1979, Groundwater: New Jersey, Prentice Hall, 604 p. [ Links ]
Gold, A.J., Deragon, W.R., Sullivan, W.M., Lemunyon, J.L., 1990, Nitrate–nitrogen losses to groundwater from rural and subrural land uses: Journal of Soil and Water Conservation, 45, 305–310. [ Links ]
Jalali, M., 2005, Nitrates leaching from agricultural land in Hamadan, Western Iran: Agriculture, Ecosystems & Environment, 110, 210–218. [ Links ]
Jeong, C.H., 2001, Effects of land use and urbanization on hydrochemistry and contamination of groundwater from Taejon area, Korea: Journal of Hydrology, 253, 194–210. [ Links ]
Jin, Z., Chen, Y., Wang, F., Ogura, N., 2004, Detection of nitrate sources in urban groundwater by isotopic and chemical indicators, Hangzhou City, China: Environmental Geology, 25, 1017–1024. [ Links ]
Kaçaroglu, F., 1999, Review of groundwater pollution and protection in karst areas: Water, Air, and Soil Pollution, 113, 337–356. [ Links ]
Kaçaroglu, F., Günay, G., 1997, Groundwater nitrate pollution in an alluvium aquifer, Eskisehir urban area and its vicinity, Turkey: Environmental Geology, 31, 178–184. [ Links ]
Liu, G.D., Wu, W.L., Zhang, J., 2005, Regional differentiation of non–point source pollution of agriculture–derived nitrate nitrogen in groundwater in northern China: Agriculture, Ecosystems & Environment, 107, 211–220. [ Links ]
Luker, M., Montaggue, K., 1994, Control of pollution from highway drainage discharges, report 142: London, Construction Industry Research and Information Association (CIRIA), 152 p. [ Links ]
Margane, A., Hobler, M., Subah, A., 1999, Mapping of groundwater vulnerability and hazards to groundwater in the Irbid area, N Jordan: Zeitschrift für Angewandte Geologie, 45, 175–187. [ Links ]
Merkel, B., Grossmann, J., Udluft, P., 1988, Effect of urbanization on a shallow Quaternary aquifer, in Proceedings of the International Symposium of Hydrological Processes and Water Management in Urban areas, 24–29, April 1988, Duisburg, Germany, 461–468. [ Links ]
Ministry of Water and Irrigation (MWI), 2004, Open files: Amman, Jordan, Ministry of Water and Irrigation. [ Links ]
Moh'd, B.K., 2000, The Geology of Irbid and Ash Shuna Ash Shamaliyya (Waqqas): Map Sheets No. 3154–11 and 3154–111: Amman, Jordan Natural Resources Authority, Bulletin 46. [ Links ]
Moorman, F., 1959, Report on the soils of east Jordan: Rome, United Nations Food and Agriculture Organization, Report no. 1132 for the Government of Jordan. [ Links ]
Navarro, A., Carbonell, M., 2007, Evaluation of groundwater contamination beneath an urban environment: The Besos river basin (Barcelona, Spain): Journal of Environmental Management, 85, 259–269. [ Links ]
Obeidat, M., 1993, Petrographical, mineralogical and geochemical investigations of Wadi As Sir carbonates, North Jordan: Irbid, Jordan, Yarmouk University, M. Sc. Thesis. [ Links ]
Obeidat, M., Massadeh, A., Al–Ajlouni, A., Athamneh, E., 2007, Analysis and evaluation of nitrate in groundwater at Al–Hashimia Area, Jordan: Environmental Monitoring and Assessment, 135, 475–486. [ Links ]
Salameh, E., 1996, Water quality degradation in Jordan (impacts on environment, economy and future generations resources base): Amman, Friedrich Ebert Stiftung, 179 p. [ Links ]
Salameh, E. and Farajat, M., 1999, Karstification in Northeast Jordan –An enhancing factor of groundwater pollution: Hydrogeologie und Umwelt, 18, 180–188. [ Links ]
Salameh, E., Rimawi, O., Abumoghli, I., 1991, Precipitation water quality in Jordan: Amman, Jordan, The University of Jordan, Bulletin of the Water Research and Study Center, 16, 98 p. [ Links ]
Salameh, E., Alawi, M, Batarseh, M., Jiries, A., 2002, Determination of triholomethanes and ionic composition of groundwater at Amman City, Jordan: Hydrogeology Journal, 10, 332–339. [ Links ]
Seiler, R., 2005, Combined use of 15N and 18O of nitrate and "B to evaluate nitrate contamination in groundwater: Applied Geochemistry, 20, 1626–1636. [ Links ]
Sophocleous, M., Townsend, M.A., Vogler, L.D., McClain, T.J., Marks, E.T., Coble, G.R., 1988, Experimental studies in stream–aquifer interaction along the Arkansas river in central Kansas–field testing and analysis: Journal of Hydrology, 98, 249–273. [ Links ]
Spalding, R.F., Exner, M.E., 1993, Occurrence of nitrate in groundwater–a review: Journal of Environmental Quality, 22, 392–402. [ Links ]
Thompson, T.L., 1996, Agricultural fertilizers as a source of pollution, in Pepper, I.L., Gerba, C.P., Brusseau, M.L. (eds.), Pollution Science: San Diego, Academic Press, 211–223. [ Links ]
Thorburn, P.J., Biggs, J.S., Weier, K.L., Keating, B.A., 2002, Nitrate in groundwaters of intensive agricultural areas in coastal Northeastern Australia: Agriculture, Ecosystems & Environment, 94, 49–58. [ Links ]
Toran, L., White, W.B., 2005, Variation in nitrate and calcium as indicators of recharge pathways in Nolte Spring, PA: Environmental Geology, 48, 854–860. [ Links ]
Verma, S.P., 1997, Sixteen statistical tests for outlier detection and rejection in evaluation of international geochemical reference materials: example of microgabbro PM–S: Geostandards Newsletter, Journal of Geostandards and Geoanalysis, 21(1), 59–75. [ Links ]
Verma, S.P., 2005, Estadística Básica para el Manejo de Datos Experimentales: Aplicación en la Geoquímica (Geoquimiometría): México, D. F., Universidad Nacional Autónoma de México, 186 p. [ Links ]
Verma, S.P., Quiroz–Ruiz, A., 2006a, Critical values for six Dixon tests for outliers in normal samples up to sizes 100, and applications in science and engineering: Revista Mexicana de Ciencias Geológicas, 23(2), 133–161. [ Links ]
Verma, S.P., Quiroz–Ruiz, A., 2006b, Critical values for 22 discordancy test variants for outliers in normal samples up to sizes 100, and applications in science and engineering: Revista Mexicana de Ciencias Geológicas, 23(3), 302–319; with electronic tables available at http://satori.geociencias.unam.mx. [ Links ]
Verma, S.P., Quiroz–Ruiz, A., 2008, Critical values for 33 discordancy test variants for outliers in normal samples of very large sizes from 1,000 to 30,000 and evaluation of different regression models for the interpolation and extrapolation of critical values: Revista Mexicana de Ciencias Geológicas, 25(3), 369–381. [ Links ]
Verma, S.P., Quiroz–Ruiz, A., Díaz–González, L., 2008, Critical values for 33 discordancy test variants for outliers in normal samples up to sizes 1000, and applications in quality control in Earth Sciences: Revista Mexicana de Ciencias Geológicas, 25(1), 82–96, with 209 pages of electronic tables available at http://satori.geociencias.unam.mx. [ Links ]
Wakida, T.F., Lerner, D.N., 2005, Non–agricultural sources of groundwater nitrate: a review and case study: Water Research, 39, 3–16. [ Links ]
Walton, B., 1951, Survey of literature relating infant metemoglobinemia due to nitrate contamination of water: American Journal of Public Health, 41, 986–996. [ Links ]
Ward, M.H., Zahm, S.H., Blair, A., 1994, Dietary factors and non–Hodgkin's lymphoma in Nebraska (United States): Cancer Causes and Control, 5, 422–432. [ Links ]
Water Authority of Jordan (WAJ), 1986, Spring flow data in Jordan prior to October 1985: Amman, Water Authority of Jordan, Technical Paper No. 51. [ Links ]
World Health organization (WHO), 1993, Guidelines for drinking water quality–recommendations: Geneva, World Health Organization, 2nd edition. [ Links ]
Woshah, A., 1979, Assessment of groundwater resources in Mughayer Jaber–Mughayer Sirhan–Um Essurab area: Amman, Jordan Natural Resources Authority. [ Links ]
Yates, M.V., 1985, Septic–tanks density and groundwater contamination: Groundwater, 23, 586–591. [ Links ]

