


Servicios Personalizados
Revista
Articulo
 Inglés (pdf)
 Artículo en XML
 Referencias del artículo
 Enviar artículo por email
Indicadores
-
 Citado por SciELO
 -
 Accesos
Links relacionados
-
 Similares en
SciELO
Similares en
SciELO
Compartir

 Permalink
Revista de la Sociedad Química de México
versión impresa ISSN 0583-7693
Rev. Soc. Quím. Méx vol.47 no.1 Ciudad de México ene./mar. 2003
Investigación
Elimination of Chlorinated Unsaturated Hydrocarbons from Water by Ozonation. Simulation and Experimental Data Comparison
Tatiana I. Poznyak,* A. Manzo, José Luis Mayorga
Escuela Superior de Ingeniería Química e Industrias Extractivas, Instituto Politécnico Nacional (ESIQIE-IPN), Edif. 7, UPALM., C.P. 07738, México D.F., México. Tel: (52)(55)-5729-6000, ext. 55288. E-mail: tpoznyak@hotmail.com
Recibido el 30 de septiembre de 2002.
Aceptado el 17 de marzo de 2003.
Abstract
The decomposition of chlorinated unsaturated hydrocarbons in water by ozone at constant pressure and temperature (20 °C) was realized experimentally in a semi-batch reactor (250-mL) in distilled water. The compounds were trichloroethylene (TCE) and tetra-chloroethylene (PCE). The kinetics of the pollutant ozonation is proposed in a mathematical model that includes the ozone's mass-transfer as well as the reaction kinetics between molecular ozone and chlorinated unsaturated hydrocarbons. Based on the computer simulation, the optimal conditions to perform the maximal removal of TCE and PCE from water are obtained. The optimal ozonation conditions in this case were as follows: the initial ozone concentration was 1.0 × 10⁻³ mole L−1, the ozone-oxygen mixture flow was 5-L min−1. The experimental data and simulation results show fit well.
Key words: Ozonation of water, simulation and elimination, trichloroethylene, tetrachloroethylene.
Resumen
Experimentalmente se llevó a cabo la descomposición de hidrocarburos insaturados clorados en agua destilada con ozono, manteniendo constantes la presión y la temperatura (20 °C), utilizando un reactor semicontinuo (250 mL). Los compuestos estudiados fueron tricloroetileno (TCE) y tetracloroetileno (PCE). En este trabajo se propone un modelo matemático para la ozonación de dichos contaminantes. El modelo describe la transferencia de masa de ozono, así como la cinética de reacción entre ozono molecular y los hidrocarburos insaturados clorados. Se obtuvieron, mediante la simulación por computadora, las condiciones óptimas para alcanzar la máxima eliminación posible de TCE y de PCE del agua. Las condiciones óptimas de ozonación, para este caso, fueron las siguientes: la concentración inicial de ozono fue de 1.0 × 10⁻³ mole / L, el flujo de la mezcla ozono-oxígeno fue de 5 L min−1. La comparación entre los datos experimentales y de simulación presenta buena concordancia.
Palabras clave: Ozonación de agua, simulación y eliminación, tricloroetileno, tetracloroetileno.
Introduction
It is well known that most of the common chlorinated water pollutants, among others, are trichloroethylene (TCE), tetrachloroethylene (PCE), carbon tetrachloride (CTC) and vinyl chloride (VC) which are volatile organic compounds. These contaminants could be found in underground water. Moreover, the presence of the composed TCE and PCE has been found in wastewater from diverse chemical processes such as oil refineries, vulcanization, industries of pesticides production, agro-chemistry, etc. [1-3]. Recent results [4-9] indicate that ozonation can be considered as an effective method for the removing most of unsaturated hydrocarbons pollutants (UHP) and chlorinated unsaturated hydrocarbons pollutants (CUHP) from ground water. Several studies [10-14], addressing the oxidation kinetics of different organic compounds by ozone were realized. Some of them [15-17] investigate the ozonation of UHP in semi-batch or continuous-flow reactors. Several system parameters having a great influence in the ozone mass transfer (gas flow rate, partial pressure of ozone, degree of mixing, bubble size and reactor geometry) are inherently involved with the ozonation rate constant and the ozone dose. In some of the previous studies, the proposal has been the ozone absorption in the liquid phase and, in other cases, the aim has been the stripping of the soluble gas in the bulk of the liquid. The different theoretical models [18-23] can describe mass transfer between two phases (gas-liquid). Here, the mass transfer often is limited to the applications of only one treatment. The experimental determination of the volumetric ozone mass transfer coefficient (kLa) in the liquid phase for a semi-batch system was applied by different researchers [15,24]. In there works a continuous supply of a gaseous solute to the batch-added liquid contained in an agitated vessel or in a bubble column was done. In some cases, the values of the mass transfer coefficient (kL) have been estimated from the determination of the volumetric mass transfer coefficient (kLa) and the specific interfacial area (α). However, the bubble size distribution determination in a disperse system is subjected to inaccuracies and experimental difficulties. In order to overcome this problem, some authors suggested a correlation that does not involve the representative bubble diameter (db) and bubble rise velocity [25-28]. The correlation requires the knowledge of the column diameter, gas superficial velocity and fluid parameters. In this case, the film and surface renewal theories are the most representative. Application of these theories allows the establishment of the kinetic regime of gas absorption in a given liquid medium and allows the determination of fluid dynamic data such as specific interfacial area or mass transfer coefficient, which can not be easily determined for most of the experimental data obtained.
In this work a simple mathematical model is presented as an alternative approach to describe ozonation in water for a semi-batch reactor at constant pressure and temperature. This model permits the characterization of the ozone mass-transfer in water introducing an empirical saturation constant (ksat). This constant depends on several easily measured experimental variables (the gas flow, gas phase volume and liquid phase volume as well as the maximum ozone concentration in liquid phase). It can be easily calculated without any previous information about the diffusion coefficient, the specific interfacial area, the bubble size distribution and the bubble diameter. The proposed model includes differential equations describing the ozone dissolution in water and the occurring chemical reaction, including the ozonation mass balance relation. The simulation of the ozonation under different initial ozone concentrations (2.4-48 mg / L) associated with the initials CUHP concentrations are done too. Based on the computer simulation, the optimal conditions to perform the maximal decomposition of TCE and PCE in water are achieved.
Experimental
Ozonation
Fig. 1 presents the block-diagram of the experimental system for the model aqueous solution of TCE and PCE ozonation. Ozone was generated from oxygen by the ozone generator VMUS-4 ("AZCO"-Canada, corona discharge type) with an ozone concentration regulation. The reactor was the semi-batch type (250-mL).

The ozonation conditions were as follows: initial ozone concentration 1.0 × 10⁻³ mole L−1, initial organic concentration 3.5 × 10⁻⁶ mole L−1 for TCE and of 9 × 10⁻⁷ mole L−1 for PCE. The ozone-oxygen mixture flow was 5 L min−1. The reaction temperature was 20 °C. To obtain the best ozone distribution, a magnetic agitation (usually operated at 120 rpm) in water was realized.
Analysis
The ozone concentration was determined in the gas phase in the reactor outlet by the Ozone Analyzer BMT 963 (BMT Messtechnik, Berlin).
The water samples were withdrawn regularly from the reactor for the current analysis. The TCE and PCE determination in water was realized by Gas Chromatograph (Perkin Elmer AutoSystem) with FID after the liquid-liquid extraction using chloroform. The water-to-extracting volume ratio was 250:5. The conditions of the chromatographic analysis were as follows: capillary glass column (30 m, 0.32 mm with PE - 17), the column temperature of 80 °C, the evaporator temperature of 250 °C and the detector temperature of 200 °C. The gas-carrier (helium) flow rate was 1.5 mL min−1. The sample volume was 0.2 L.
Mathematical model
In this paper we use the mathematical model suggested before by the same authors in 1976 [29] and then modified in 1998 [30-32]. The previous publications using this model tackled only the problem on the determination of the ozonation constants for very quick reactions with amines and olefins based on the measurements of the variation of the ozone concentration in gas-phase without any computer simulations. It showed a good agreement between the experimental and calculated values of the reaction constants.
Now, in this paper using the information on the reaction constants obtained before and the mathematical model as well, we design the model-based technique of mass-transfer and organic decomposition simulation. This provides the complete and detailed information on the ozonation and serves to the optimization of this process under different initial conditions. This model in the first time was implemented for the simulation of the organic elimination from water by ozonation.
The model designed here includes the integral equation of material balance describing, in a very simple form, the ozone dissolution in water (or ozone mass transfer) and the chemical reaction between TCE and PCE and ozone, that is,

Here c0g, cg(t) are the initial and current ozone concentrations in the gas phase (mole L−1); is the gas flow-rate (L s−1); Vg, Vliq are the volumes of the gas and liquid phases (L); ciUHP(0), ciUHP(t) are the initial and current organic compounds concentrations in the reactor (mole L−1); Q(t) is the current ozone amount in liquid phase (mole).
The auto-decomposition of the ozone in water was not taken into account in the analysis and modeling of the ozonation. In this particular case, the part of the decomposed ozone was less than 1 % of the initial concentration. This information was obtained by the ozone concentration measurement in the inlet and outlet of the reactor in an experiment without chemical reaction. The variation of the ozone concentration in the gas phase in the outlet of the reactor is given by the following differential equation [29]:
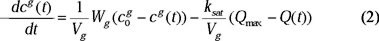
Where ksat is the saturation constant of ozone in water (s−1) and Qmax is the maximum amount of ozone in the saturation state of the liquid phase (mole) at a fixed temperature.
Different authors [11, 33, 34] have studied the ozone solubility in various solvents. The analysis of these data shows that the solubility follows the Henry's law. However, the values of the Henry's constant determined by different authors are not always consistent. The differences reported in measuring Henry's constant may be due to the analysis method employed. The most important factor in obtaining correct values of ozone solubility is the analysis method used. For example, the ozone concentration determination by the titration of the I2 formed from KI solution can increase the ozone dissolved, so the amount of the I2 formed does not correspond to the dissolved ozone, as a result of catalytic decomposition [12].
The Qmax can be expressed as follows:

Here H is the Henry's constant (mole Lliq−1 / mol Lg−1).
Assuming that the ozone reaction with TCE and PCE is described by a second order equation:

Here kTCE and kPCE are the rate constants of the TCE and PCE oxidation by ozone, respectively (L mole−1 s−1).
The mass transfer process of ozone is given by:

The set of four ordinary differential equations (2), (4) - (6) describes the ozonation in a simple way for further analysis of mass transfer and chemical reactions, simultaneously.
Determination of the saturation constant
The model proposed in this work includes the empirical constant ksat (the saturation constant), which depends on several easily measurable parameters (the gas flow, gas phase volume and liquid phase volume as well as the maximum ozone concentration in liquid phase). The model describes the ozone mass transfer using the saturation constant (ksat) as the characteristic parameter of the ozone-water heterogeneous system. This constant is calculated without any a priori information about the diffusion coefficient, the specific interfacial area and the bubble size distribution and on a bubble diameter. The calculation can be realized using only the variation of the current ozone concentration in the gas phase with the known initial ozone concentration, the gas flow and the reactor volume.
In the case of the modeling of the ozone mass transfer only, without a chemical reaction (ciUHP (0) = 0) [35], the system of two differential equations (7) and (8) describes the ozone mass transfer in water:

That implies [36]:
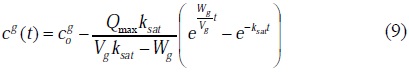
and

The substitution of

in to equation (8), leads to the following formula for the saturation constant calculation
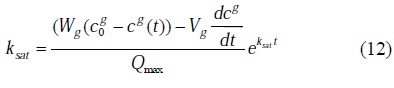
The solution of the transcendent equation (12) for a given time exists if and only if
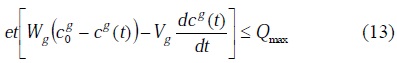
The numerical solution of (12) was obtained by the standard regression iterative method using the program MATLAB 5.3-SIMULINK.
Results of the TCE and PCE ozonation simulation
The computer simulation of the UHP ozonation was realized under the different experimental conditions using the MAT-LAB-5.2 and SIMULINK-2 as toolbox.
The conditions were as follows: gas flow varied from 5 to 40 L h−1, initial ozone concentration from 5.0 × 10⁻⁵ to 1.0 × 10⁻³ mole L−1 and the reactor volume from 2 up to 4 L. The experiments were realized at a temperature 20 °C. The initial concentration of TCE and PCE in water were as follows: CTCE = 3.5 × 10⁻⁶ mole L−1, CPCE = 9 × 10⁻⁷ mole L−1. The reaction constants, corresponding to ref. [12], were kTCE = 3.6 L mol−1 s−1 and kPCE = 1. 0 L mole−1s−1.
It can be seen from the obtained simulation results, the TCE decomposition was faster than the PCE decomposition (Fig. 2a, b and Fig. 3). This can be explained by the fact that the chemical reaction rate constant for TCE is greater than the chemical reaction rate constant for PCE.
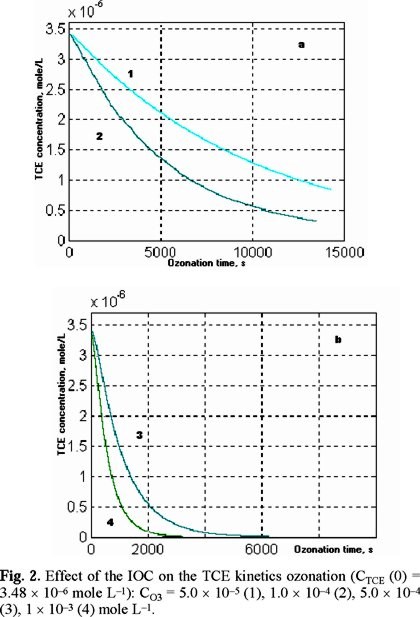

The effect of the factors (initial ozone concentration, ozone flow and volume of the reactor) to the removal of the TCE / PCE and to the ozone saturation in water was simulated. An effect of the initial ozone concentration (IOC) to the ozonation of TCE at e gas flow 5 L h−1 and the reactor volume 2 L can be observed from Fig. 2 a, b. An effect of the IOC to the ozonation of PCE at the same experimental conditions can be observed from Fig. 3. A decrease of the decomposition time in the case of the IOC increasing was observed the similar results for the TCE and PCE ozonation.
In Fig. 2b curve 3 corresponds to an ozone concentration 5 × 10⁻⁴ mole L−1 while curve 4 does to 1 × 10⁻³ mole L−1. The difference in the removal time for TCE is 2000 s, approximately.
For the PCE ozonation, curve 1 of Fig. 3 corresponds to initial ozone concentration 5 × 10⁻⁵ mole L−1 while curve 4 does to 1 × 10⁻³ mole L−1. In this case, the minimal removal time of PCE is 8000 s.
The simulations of ozonation were realized also at different gas flows. The removal dynamics for the TCE and the PCE by gas flows being 5, 10, 20, 30 and 40 L h−1 were simulated (Fig. 4 a, 4 b). As we can conclude from the obtained results, gas flow does not affect significantly to the ozonation kinetics. The increasing of gas flow more than 20-L h−1 for the TCE does not affect, practically, to the decomposition dynamics.

In the case of the PCE ozonation, gas flow effect was not observed. The gas flow effect on the ozonation kinetics increases only for faster reactions.
The removal times of TCE (80 %) for different gas flow and for different initial ozone concentration also were simulated. As it can be observed from Fig. 5a, the ozone flow is not a "strong" parameter for the removal time at the same IOC. The IOC is seen to have a larger effect on the TCE destruction. The gas flow is a variable that, barely intervenes to high conversion (80 %) (see Fig. 5a). A small influence of the gas flow for less conversion of 50 % can be detected.

The simulation shows also that the gas flow effect, both on the ozone saturation in water and on the ozone concentration variation in the gas phase in the reactor outlet, is very significant (Figs. 6 and 7).

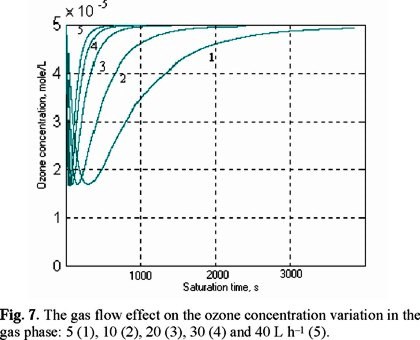
The increasing of the gas flow from 5 L h−1 to 40 L h−1 decreases the saturation time from 3000 s to 400 s (Fig. 8). It is more noticeably the effect in the range of 5-20 L h−1, since the increase of the gas flow from 20 L h−1 to 40-L h−1 has a minimal effect (from 700 s to 400 s).

Other important factor in the ozone saturation is the reactor volume. It also affects the ozone concentration in the reactor outlet. In Fig. 9 this effect is shown. The reactor volume was varied from 2 to 4 L under the IOC 1 × 10⁻¹ mole L−1 keeping the gas flow equal to 40 L h−1. We can see that increasing the reactor volume the saturation time decreases in two times, approximately.

We also looked for the conditions to obtain the maximum conversion of the pollutant elimination in the minimal time. This could be achieved varying the initial ozone concentrations, which turned out to be the main parameter effecting the process of ozonation. The increasing of initial ozone concentration accelerates the TCE and PCE decomposition time (Fig. 10). It should be noted, however, that this dependence is not linear and that the increase of the initial ozone concentration in more than 5 × 10⁻⁴ mole L−1 does not lead to any significant effect.
Comparison of the simulation and experimental results
The simulation of the TCE and PCE ozonation was realized under the real initial concentrations of the organic compounds and ozone. The initial ozone concentration was 1 × 10⁻³ mole L−1 and the pollutant concentrations were 3.5 × 10⁻⁶ mole L−1 and 9 × 10⁻⁷ mole L−1 of TCE and PCE, respectively. The elimination curves shown in Fig. 12 permit to compare the experimental and the simulation results for the TCE decomposition. The curve "tce (exp.)" demonstrates the destruction dynamics of the TCE according to the experimental ozonation data. The curve "tce (sim.)" describes the TCE elimination according to the results of the simulation under the same conditions. The elimination curves of Fig. 13 show the experimental data as well as the simulation results for the PCE ozonation. In this case, the curve "pce" corresponds to the real datum obtained in the experiment and the curve "pce (sim.)" corresponds to the simulation result.

Discussion
Ozonation of organic compounds in water is a complex technology involving mass transfer processes and a variety of possible chemical reactions:
1. Direct reactions between the molecular ozone and the organic compounds.
2. Radical reactions between hydroxyl radicals and organic.
In the latter case, radicals are produced through the ozone molecule decomposition catalyzed by the hydroxyl ion. In the studied case, the radical route of degradation of TCE and PCE may be neglected and these substances are decomposed by direct reaction by ozone. The radical mechanism of the ozonation was not analyzed, neither the auto-decomposition of the ozone in water was considered within the proposed mathematical model. The measurement and comparison of the ozone concentration in the gas phase in the inlet and the outlet of the reactor let us confirm that the auto-decomposition of ozone was not, practically, observed.
In this work it was not checked up whether the gaseous stream do cause air stripping of VOC's or not, since it was out of the scope of this study. Nevertheless, according to some bibliographic data [6, 8], the TCE and PCE evaporation has not been observed in the water ozonation. On the other hand, these compounds are heavier than water in addition, that they are slightly soluble. Hence, to avoid partial evaporation, more ozonation time or temperatures < 20 °C would be suggested. To reinforce this, a 20-cm water layer covers these compounds. In this way the evaporation of this organic may be neglected, at the experimental conditions handled. For example, if the gas flow is 5 L h−1, the compound evaporation is practically unobservable. Contrarily, if same partial evaporation occurs, their reactions with ozone in the gas phase would seem to be practically impossible, since the corresponding residence time in the reaction zone is too short to complete this reaction including the fact that their reaction constants with ozone are very small. In addition, we ought to mention here that the mathematical model of the ozonation in the gas phase is already developed [37]. One can see that the simple coupling of these two models (for gas and liquid phases) leads only to a high complex description though the TCE and PCE ozonation in gas phase may be considered as an attractive field of further investigations.
The relative errors calculated based on complete experimental data (including large deviations) are 8.35 % for TCE and 22.31 % for PCE. However, if we exclude the large deviation point for TCE and PCE, corresponding to long ozonation times, at the preliminary step, then these errors are 5.23 % and 8.43 %, respectively. They can be considered within an acceptable margin of error. On our opinion, the PCE and TCE ozonation in water is too complicated for an experimental study from the "reproducibility" point of view. That's why the accuracy on the obtained results may be considered as acceptable or even good for the mathematical model as it is in this work.
Conclusions
Based on this study, we may conclude that on-line measurements of the ozone concentration in gas-phase can provide good identification of the ozonation process. So, the saturation constant (ksat) can be calculated directly using the measurements of the current ozone concentration in the gas phase (without the preliminary diffusion coefficient estimation) for concrete experimental conditions.
According to the computer simulation of the TCE and PCE ozonation, the optimal conditions to perform the maximal decomposition (95 %) of these compounds for a short elimination time in water can be derived.
The ozonation of these organic compounds in a semi-batch reactor (250 mL) under the optimal conditions of process was realized, showing a good agreement between experimental and simulation data consequently. It was possible to eliminate more than 95 % of these pollutants approximately at 135 s of ozonation.
Acknowledgement
The authors thank the CGPI of the National Polytechnic Institute of Mexico for the economic support (Research Project of DEPI # 970124) and COFAA's support for assisting the authors in this investigation.
References
1. Russell, H. H; Matthews, E. J.; Sewell, G.W. 1992, EPA/540/S-92/002 (1992). [ Links ]
2. Fischer, A.J.; E.A. Rowan, E. A.; R.F. Spalding, R.E. Ground Water. 1987, 25, 407-414. [ Links ]
3. Viessman, W.; M. J. Hammer, M.J. Water Supply and Pollution Control, Harper Collins, 5th Ed., USA, 1993. [ Links ]
4. Glaze, W.H., Kang, J.W.; Chapin, D.H. J. Ozone Sci. & Eng. 1987, 9, 335-352. [ Links ]
5. Glaze, W.H.; Kang, J.W. J. AWWA. 1988, 80, 5-57. [ Links ]
6. Aieta, E. et al. J. AWWA. 1988, 80, 64-72. [ Links ]
7. Karimi, A.A. Ozone News IOA, 1992, 19-22. [ Links ]
8. Karimi, A.A.; A.R. Jeremy, A.R. J. AWWA, 1997, 89, 41- 53. [ Links ]
9. Schwämmlein, K.; Leitzke, O. Proc. of 13-th Ozone World Congress, Kyoto, Japan, 1997, 105-110. [ Links ]
10. Hoigné, J.; Bader, H. J. Water Research. 1983, 17,173-184. [ Links ]
11. Hoigné, J.; Bader, H. J. Water Research. 1983, 17, 185-194. [ Links ]
12. Razumovskii S.D.; Zaikov, G.E. Ozone and its Reactions with Organic Compounds, Elsevier, Amsterdam-Oxford-New York-Tokyo, 1984. [ Links ]
13. Razumovskii, S.D. Bull. Russian Acad. Sci. Ser. Chim. 1995, 12, 305-311. [ Links ]
14. Hoigné. J. Proc. IOA / EA3G Conf., Switzerland, Basel, 1999, 119-130. [ Links ]
15. Wright, P. C.; Meeyoo, V.; Soh, W.K. Ozone Sci. & Eng. 1998, 20, 17-33. [ Links ]
16. Bin, A.K.; M. Roustan, M. Proc. IOA / EA3G Sym. "Fundamental and Engineering Concepts for Ozone Reactor Design", Toulouse, France, 2000, 99-131. [ Links ]
17. Farines, V.; Baig, S.; Albet, J.; Molinier, J. Proc. IOA/ EA3G Sym. "Fundamental and Engineering Concepts for Ozone Reactor Design", Toulouse, France, 2000, 137-140. [ Links ]
18. Fortscue, G.E.; Pearson, J.R.A. Chem. Eng. Sci. 1964, 22, 1163-1176. [ Links ]
19. Lamont, J.C.; Scott, D.S. A.I.Ch.E. J. 1970, 16, 513-519. [ Links ]
20. Brumfield, L.K.; Theofanous, T.G. A.I.Ch.E. J. 1976, 22, 607-610. [ Links ]
21. King, C. Ind. Eng. Chem. Fundam. 1966, 5, 1-8. [ Links ]
22. Danckwersts, P.V. Gas-liquid Reaction, McGraw Hill, N.Y., 1970. [ Links ]
23. El-Din, M. G.; Smith, D.W. Ozone Sci. & Eng. 2001, 23, 313-326. [ Links ]
24. Kuo, C.H. Environ. Progress. 1982, 1, 189-195. [ Links ]
25. Akita, K.; Yoshida, F. Ind. Eng. Chem. Process Res. Develop. 1974, 13, 84-91. [ Links ]
26. Hikita, H.; Asai, S.; Tanigawa, K.; Segawa, K.; Kitao, M. Chem. Eng. J. 1981, 22, 61-69. [ Links ]
27. Deckwer, W. -D.; Shumpe, A. Chem. Eng. Sci. 1993, 48, 889-911. [ Links ]
28. Beltrán, F.J.; García-Araya, J.F.; Rivas, F.J.; Álvares, P.; E. Rodríguez, E. Ozone Sci. & Eng. 2000, 22, 167-183. [ Links ]
29. Lisitsyn, D.M.; Poznyak, T.I.; Rasumovskii, S.D. Kinet Katal. 1976, 17, 1049-1056. [ Links ]
30. Poznyak, T.I.; Mayorga Vera, J. L.; Vivero Escoto J. L.; Manzo Robledo, A. Proc. 3rd Int. Symposium of ESIQIE-IPN, Mexico City, Mexico, 308-323, 1998. [ Links ]
31. Poznyak, T.I.; Manzo Robledo, A. Proc. IOA / PAG Conf., ,Vancouver, Canada, 301-311, 1998. [ Links ]
32. Poznyak, T.I.; Vivero Escoto, J.L. Proc. IOA/EA3G Sym. "Fundamental and Engineering Concepts for Ozone Reactor Design", Toulouse, France, 133-136, 2000. [ Links ]
33. Roth, J.A.; Sullivan, D.E. Ind. Eng. Chem. Fundam. 1981, 20, 137. [ Links ]
34. Zhou, H.; Smith, D.W.; Stanley, S.J. J. Environ. Eng., ASCE. 1994, 120, 821-840. [ Links ]
35. Poznyak, T.I.; Vivero E. J.L.; García, J.A. Proc. IOA / PAG Conference, Newport Beach, California, USA, May 5-9, 2001, 453 - 464. [ Links ]
36. Poznyak, T.I. "Study of the Polymerization Products on the Basis of the Ozonation Reactions", Ph.D. Thesis, Institute of Chemical Physics of Academy of Science of Russia, Moscow, 1981. [ Links ]
37. Poznyak, T.I. Fresenius J. Anal. Chem. 2000, 367, 275-278. [ Links ]

