


Servicios Personalizados
Revista
Articulo
 Inglés (pdf)
 Artículo en XML
 Referencias del artículo
 Enviar artículo por email
Indicadores
-
 Citado por SciELO
 -
 Accesos
Links relacionados
-
 Similares en
SciELO
Similares en
SciELO
Compartir

 Permalink
Agricultura técnica en México
versión impresa ISSN 0568-2517
Agric. Téc. Méx vol.32 no.1 México ene./abr. 2006
Artículos
Spatial and temporal distribution of honeybee foragers in a cantaloupe field with different colony densities*
Distribución espacial y temporal de abejas en melón con diferente densidad de colonias
José Luis Reyes–Carrillo1, Pedro Cano–Rios2 , Frank A. Eischen3, Rafael Rodríguez–Martínez1 and Urbano Nava–Camberos2
1 Universidad Autónoma Agraria Antonio Narro, Unidad Laguna. Carretera a Santa Fe y Periférico. Torreón, Coahuila, México.
2 Campo Experimental La Laguna, INIFAP.
3 Honey–Bee Unit, USDA–ARS–SARC.
Autor para correspondencia:
cano.pedro@inifap.gob.mx
* Recibido: Agosto de 2005
Aceptado: Febrero de 2006
ABSTRACT
A field trial was carried out in "La Laguna", a region in northern Mexico during the summer of 2003. The objective of this work was to determine the temporal and spatial honeybee (Apis mellifera L.) distribution in a commercial cantaloupe (Cucumis melo L.) field with different colony densities. Starting in the second week after the onset of blooming, honeybee colony densities were increased by adding from one to five colonies per hectare one day before every observation day. Honeybee colonies were uniformly distributed adjacents to a cantaloupe field. In five randomly selected rows, transects 10 m long were marked at 25, 50, 75 and 100 m from the center of the apiary. Foraging bees were counted every 30 min from 7:30 to 19:30 h. Significant differences (p<0.001) in the number of pollinating honeybees were found among the evaluated distances, with the highest density at 50 m from the apiary (7.2a), intermediate number at 25 (6.6ab) and 75 m (6.7ab), and the lowest at 100 m (5.3c). The number of foraging honeybees varied temporally (p<0.0001), observing the highest density from 10:00 to 15:00 h, with a peak at 11:00 h. The number of colonies per hectare influenced honeybee density (p<0.0001). The maximum bee number per transect (6.08a) was observed with three colonies per hectare; therefore, this number of bee colonies is considered as the optimum number for cantaloupe pollination.
Key words: Cucumis melo L., colony density, honeybee behavior, pollination.
RESUMEN
Las abejas melíferas (Apis mellifera L.), además de ser importantes productoras de miel, contribuyen a la polinización de diversos cultivos, entre ellos el melón (Cucumis melo L.). Se realizó un experimento de campo en la región Lagunera, situada en el norte de México, durante el verano de 2003. El objetivo de esta investigación fue determinar la distribución temporal y espacial de las abejas melíferas en un cultivo comercial de melón con diferente densidad de colmenas. En la segunda semana del inicio de la floración, se incrementó la densidad de colmenas de una hasta cinco colmenas por hectárea un día antes de cada día de observación. Las colonias de abejas se distribuyeron uniformemente adyacentes al cultivo de melón. Dentro del campo de melón se marcaron transectos de 10 m de longitud en cinco surcos elegidos al azar a las distancias del centro del apiario de 25, 50, 75 y 100 metros. Las abejas pecoreadoras se contaron cada 30 min de las 7:30 a las 19:30 h. Se encontraron diferencias significativas (p<0.001) en el número de abejas entre las distancias evaluadas; el mayor número se observó a los 50 m (7.2a), un número intermedio a los 25 (6.6ab) y 75 m (6.7ab), y el más bajo a los 100 m (5.3c). El número de abejas pecoreadoras varió en el tiempo (p<0.0001), observándose el mayor número de las 10:00 a las 15:00 h y un máximo a las 11:00 h. El número de colmenas influyó en la densidad observada de abejas (p<0.0001) de tal manera que el máximo número de abejas por transecto (6.08a) se observó con tres colmenas por hectárea; por lo tanto, este número de colmenas pudiera ser considerado como el óptimo para polinizar el cultivo de melón.
Palabras clave: Cucumis melo L., comportamiento de abejas melíferas, densidad de colmenas, polinización.
INTRODUCTION
Flowering plants that require insect pollination typically show increased seed set with increased visitation by honeybees (Gingras et al, 1999). Insect pollinators also increase yields at different percentages depending upon plant species (Heather et al, 2004). Cross pollination by bees causes a significant increase in fruit set not only of the self–sterile but also the self–fertile species (Klein et al, 2003). Poor fruit quality is usually attributed to pollination problems, such as low bee numbers and/or ineffective pollinators within the agro–ecosystem (Sheffield et al, 2005). It has been determined that foraging pollinators choose flowers according to reward and energy waste (Rush et al, 1995; Russell et al, 1998); recently, it has been suggested that attractiveness is related to flower symmetry (Waser et al., 1996; Endress, 2001), floral scents, nectar production and color (Briscoe and Chittka, 2001; Varassini et al, 2001).
Cantaloupe (Cucumis melo L.) pollen can only be transferred by insects since it is sticky, therefore not suitable for wind pollination. The effective period in which this pollen can be deposited on the stigma is just for few hours in the morning, but if the air temperature gets high, then the effective period may only be of few minutes (McGregor, 1976); therefore, extensive cantaloupe plantings requires honey bee pollination. Since wild pollinators are often too scarce, providing honeybees is a requirement for cantaloupe production. This pollinator scarcity has often been caused by agrochemicals and other modern farming methods (Kearns and Inouye, 1997; Kearns et al., 1998). These methods have even damaged commercial honey bee colonies (DeLaplane and Mayer, 1996). There is further interest in whether the presence of honeybees in production fields relies upon a density–dependent relationship. Though much is known about honeybee pollination, how foragers are distributed spatially, and to some extent temporally, in cantaloupe fields is poorly understood. This is particularly true when colony density is varied.
The objective of this work was to determine the temporal and spatial honeybee distribution in cantaloupe fields with different bee colony densities.
MATERIAL AND METHODS
This research was carried out during June 2003 in a commercial five–hectare cantaloupe crop sown with the hybrid "Cruiser", which was located near the INIFAP–Campo Experimental La Laguna, Matamoros, Coahuila –103° 14' west longitude, and 25° 31' north latitude– within the Comarca Lagunera region, in Northern Mexico. This region has a 235 mm mean annual rainfall, an altitude of 1139 m above sea level and 18.6 °C annual mean temperature (Schmidt, 1989). The cantaloupe field was furrow–irrigated and 25 bee colonies (Jumbo size) were used. The colonies were stocked with Italian honeybees (Apis mellifera ligustica L.), each with a new commercial queen bee, and equalized to ca 24 000 workers. In five randomly–selected rows of 105 m in length, 10 m transects were marked at 25, 50, 75 and 100 m from the apiary and five replications were used for each distance. During the second week from the onset of blooming, when is considered optimum for pollination (Eischen et al, 1994), colony density was increased by adding from one to five colonies per hectare, one day before every observation, and five replications were used for each density. Colonies were uniformly distributed adjacent to the field. In the observation day, one day per colony density, the foraging honeybees were counted in the transects simultaneously every 30 min from 7:30 h until 19:30 h. Analysis of variance following a complete randomized block design and mean separation, using the Least Significance Difference test (LSD), were conducted to evaluate differences in honeybee numbers among distances, times and colony numbers. Quadratic regression analysis were used to describe the relationships between honeybee numbers (dependent variable) and colony distance, times and colony numbers (independent variables) (Steel and Torrie, 1960).
RESULTS AND DISCUSSION
Significant (p<0.001; LSD= 0.31 bees) higher number of honeybee foragers (x= 6.4 bees) were found at a distance of 50 m from the colony compared with the number at a distance of 100 m (x= 4.4 bees) (Figure 1).
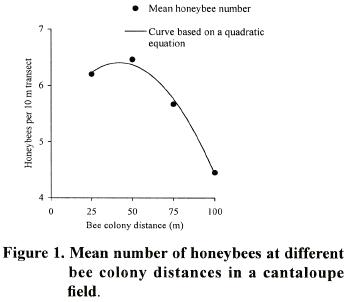
Forager numbers in other distances were at intermediate densities. T,he high determination coefficient (R2= 0.99) of the quadratic curve, indicates that there is a strong relationship between the number of honeybees per transect and bee colony distance. The temporal pattern showed that the total number of honeybees present in the cantaloupe field varied with the hour during the day, reaching the highest density from 10:00 to 15:00 h and observing a peak at 11:00 (Figure 2).
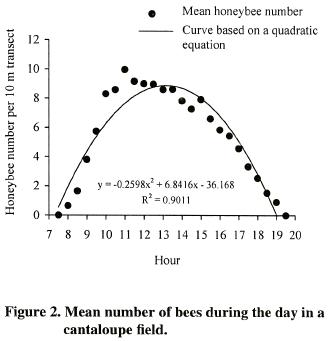
Statistical differences were observed among the different times of counting during the day with the smaller number of foraging honeybees observed early in the morning and late afternoon (p<0.0001; LSD= 0.55 bees). The foraging activities in the cantaloupe field ceased at sunset. The quadratic regression model explained 89% (R2= 0.9) of the observed variation of honeybee density as a function of the hour of the day (Figure 2).
Despite the fact that maximum honeybee density was maintained in the cantaloupe field with three and four colonies per hectare, wild honeybees and wasps and other pollinating insects were also observed.
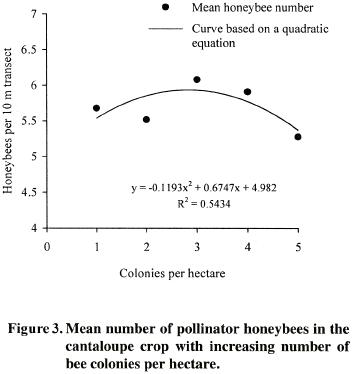
Bee–colony density influenced significantly honeybee numbers (p<0.0001; LSD= 0.34 bees). The highest number of foragers was observed with three (x= 6.08 honeybees) and four (x= 5.91 honeybees) colonies per hectare. However, increasing the rate to five bee colonies per hectare showed a significantly declining in honeybee number (x= 5.28 bees) (Figure 3). The quadratic regression model explained 54% (R2= 0.54) of the observed variation of honeybee density as related to colony density, which indicates a low predicting capacity of the quadratic equation obtained.
Results of this study were expected since honeybees can flight considerable distance to collect nectar or pollen (Amdam et al., 2004), but once a honeybee gets there it will tend to maintain its foraging activity confined in a small area, particularly when the selected plant species is a good food source (DeLaplane and Mayer, 2004). Using pollination experiments along replicated distance gradients in a coffee crop, authors found that forest based pollinators increased the yields by 20% within one kilometer of forest (Ricketts et al, 2004). Honeybee exhibits easily manipulated feeding behavior coupled with extremely high mnemonics fidelity (Meller and Davis, 1996), this can explain their foraging activities in the vicinity of the apiary at the evaluated distances.
Foraging honeybee activity usually peaks by mid morning in temperate climate (McGregor, 1976) and these insects are active during the daylight (Tian et al, 2004) as was observed in this work.
A small number of bees with the highest bee–hive number was observed in this study; this suggests an altered bee performance when the pollinating bees must substitute the target crop by an alternative food source. The effects of bee–hive rate observed in this study were similar to those found in the rabbiteye blueberry (Vaccinium ashei J.M. Reade), such that its rate of legitimate flower visits when pollinated by honeybee and increased bee–hive rate produced an evasive behavior and reduced the honeybee pollen load average and fruit size (Dedej and DeLaplane, 2003).
Different authors reported different bee–colony number for pollinating cantaloupe from one (OSU, 1999) to six (Atkins et al, 1997) colonies per hectare. The lower recommended bee–hive number found in the literature varied from one (OSU, 1999) to two (USDA, 1986; Hodges and Baxendale, 1995; OSU, 1999), while the higher number was six colonies per ha (Crane and Walker, 1984; Eischen and Underwood, 1991; Atkins et al, 1997) and the mean number of bee colonies per hectare from the cited references was 3.7. Results of this work are similar to the bee–hive number obtained in different trials in cantaloupe pollination with three (Eischen and Underwood, 1991) and four colonies per hectare (McGregor, 1976; USDA, 1986; Atkins et al, 1997).
Insects pollinators such as honeybees are attracted to flowers by their visual display and their scent. Although most flowers reinforce visits by providing rewards such as pollen and/or nectar (Galizia et al, 2005), the general manageability of honeybees and their demonstrated variety–specific efficacy as pollinators suggests a renewed attention to the plant side of the pollination management syndrome (Dedej and DeLaplane, 2003). This includes crops like cantaloupe in arid conditions. In this study the relative importance of the contribution of wild pollinators was not evaluated, but this and related aspects might be considered in future pollination works.
CONCLUSIONS
There were significant differences in the number of honeybee pollinators foraging among the distances, throughout across the day and colony number tested. The highest honeybee density was observed at 50 m from the apiary. The foraging honeybees present in the cantaloupe field throughout the day reached the highest numbers from 10:00 to 15:00 h and lowered their activity at sunset. The maximum number of bees per transect was observed with three colonies per hectare, thus suggesting this number as an optimum for cantaloupe pollination in the environmental conditions prevalent in La Laguna region of northern Mexico.
ACKNOWLEDGEMENTS
We thank The Fundación Produce Coahuila, A.C. and Cámara Agrícola y Ganadera de Torreón for financial support, Lie. Abel Juárez cantaloupe grower and Elias Gaona–González, Oscar Barajas–Arcos, Santiago Espitia–Villalva and Fernando Castrejón–Lozano, Veterinary and Agronomy students of the Universidad Autónoma Agraria Antonio Narro for their technical assistance.
LITERATURE CITED
Amdam, G. V.; Norberg, K.; Fondrk, M. K. and Page, R. E. 2004. Reproductive ground plan may mediate colony–level selection effects on individual foraging behavior in honey bees. Proc. Nati. Acad. Sci. USA 101:11350–11355. [ Links ]
Atkins, E. L.; Anderson, L. D.; Kellum, D. and Neuman, K.W. 1997. Protecting honey bees from pesticides. University of California. Division of Agricultural Sciences. 4 p. (Leaflet 2883). [ Links ]
Briscoe, A. and Chittka, D. 2001. The evolution of color vision in insects. Annu. Rev. Entomol. 46:471–510. [ Links ]
Crane, E. and Walker, P. 1984. Pollination directory for world crops. International Bee Research Association. London, U.K. 183 p. [ Links ]
Dedej, S. and DeLaplane, K. S. 2003. Honey bee (Hymenoptera: Apidae) pollination of rabbiteye blueberry Vaccinium ashei var. 'Climax'is Pollinator Density–Dependent. J. Econ. Entomol. 94(4): 1215–1220. [ Links ]
DeLaplane, K.S. and Mayer, D. F. 1996. Principles and practices of bee conservation. Bee Sci. 4:4–10. [ Links ]
DeLaplane, K.S. and Mayer, D. F. 2004. Crop pollination by bees. University Press. Cambridge, U.K. 331 p. [ Links ]
Eischen, F. and Underwood, B. A. 1991. Cantaloupe pollination trials in the lower Rio Grande Valley. Am. Bee J. 131:775. [ Links ]
Eischen, F.; Underwood, B. A. and Collins, A. 1994. The effect of delaying pollination on cantaloupe production. J.Apic. Res. 33:180–184. [ Links ]
Endress, P. K. 2001. Evolution of floral symmetry. Curr. Opin. Plant Biol. 4:86–91. [ Links ]
Galizia, C. G.; Kunze, J.; Gumbert, A.; Borg–Karlson, A. K.; Sachse, S.; Markl, C. and Menzel, R. 2005. Relationship of visual and olfactory signal parameters in a food–deceptive flower mimicry system. Behav. Ecol. 16:159–168. [ Links ]
Gingras, D.; Gingras, J. and De Oliveira, D. 1999. Visits of honeybees (Hymenoptera: Apidae) and their effects on cucumber yields in the field. Hortic. Entomol. 92:435–438. [ Links ]
Heather, H. A.; Rice, N. D.; Winston, M. L. and Lewis, R. 2004. Honey bee (Hymenoptera: Apidae) distribution and potential for supplementary pollination in commercial tomato greenhouses during winter. J. Econ. Entomol. 97:163–170. [ Links ]
Hodges, L. and Baxendale, F. 1995. Bee pollination of cucurbit crops. Cooperative Extension. Institute of Agriculture and Natural Resources. University of Nebraska Lincoln, USA. 2 p. (Bulletin NF91–5D). [ Links ]
Kearns, C.A. and Inouye, D. W. 1997. Pollinators, flowering plants, and conservation biology. BioScience 47:297–307. [ Links ]
Kearns, C.A.; Inouye, D. W. and Waser, N. 1998. Endangered mutualism:The conservation of plant–pollinator interactions. Annu. Rev. Ecol. Syst. 29:83–106. [ Links ]
Klein, A.M.; Stefaffan–Dewenter, I. and Tscharntke, T. 2003. Bee pollination and fruit set of Coffea arábica and C. canephora (Rubiaceae). Am. J. Bot. 90:153–157. [ Links ]
McGregor, S.E. 1976. Insect pollination of cultivated crop plants. Agriculture Handbook No. 496. United States Department of Agriculture. Washington, D.C., USA. 411 p. [ Links ]
Meller, V. H. and Davis, R. L. 1996. Biochemistry of insect learning: lessons from bees and flies. Insect Biochem. Molec. Biol. 26:327–335. [ Links ]
Ohio State University (OSU). 1999. Bee pollination of crops in Ohio. Ohio State University. 22 p. (Bulletin 559). [ Links ]
Ricketts, T. H.; Daily, G. C; Ehrlich, P. R. and Michener, C. D. 2004. Economic value of tropical forest to coffee production. Proc. Nati. Acad. Sci. USA 101(34):12759–12582. [ Links ]
Rush, S.; Conner, J. and Jennetten, P. 1995. The effects of natural variation in pollinator visitation on rates of pollen removal in wild radish, Raphanus raphanistrum (Brassicaceae). Am. J. Bot. 82:1522–1526. [ Links ]
Russell, D.; Meyer, R. and Bukowski, J. 1998. Potential impact of microencapsulated pesticides on New Jersey apiaries. Am. Bee J. 138 (3):207–210. [ Links ]
Schmidt, R. H. 1989. The arid zones of Mexico: climatic extremes and conceptualization of the Sonoran Desert. J. Arid Environ. 16:241–256. [ Links ]
Sheffield, C. S.; Smith, R. F. and Kevan, P. G. 2005. Perfect syncarpy in apple (Mains x domestica 'Summerland McIntosh') and its implications for pollination, seed distribution and fruit production (Rosaceae: Maloideae). Ann. Bot. 95:583–591. [ Links ]
Steel, R. G. D. and Torrie, J. H. 1960. Principles and procedures of statistics. McGraw–Hill Book Company. New York, USA. 481 p. [ Links ]
Tian, J.; Liu, K. and Hu, G. 2004. Pollination ecology and pollination system of Impatiens reptans (Balsaminaceae) endemic to China. Ann. Bot. 93:167–175. [ Links ]
United States Department of Agriculture (USDA) 1986. Using honey bees to pollinate crops. (Leaflet 549). 4 p. [ Links ]
Varassini, I. G.; Trigo, J. R. and Sazima, M. 2001. The role of nectar production, flower pigments and odour in the pollination of four species of Passiflora (Passifloraceae) in south–eastern Brazil. Bot. J. Linn. Soc. 136:139–152. [ Links ]
Waser, N. M.; Chittka, L.; Price, M. V.; Williams, N. M. and Ollerton, J. 1996. Generalization in pollination systems, and why it matters. Ecology 77:1043–1069. [ Links ]

